Sustainable Urban Management
Master Thesis in Built Environment (15 credits) Spring Semester 2015
Supervisor: Christina Scholten
In the pursuit of sustainable transport:
A
study of perceived accessibility in two areas
of Malmö, Sweden
1 In the pursuit of sustainable transport: A study of perceived accessibility in two areas of Malmö,
Sweden
Rebecca Luong and Hampus Mattson
Sustainable Urban Management – Thesis in Built Environment (15 Credits) One-Year Master | Spring Semester 2015
2 Summary
This thesis looks at the study of accessibility and the role that attitudes and perceptions, based on place and socioeconomic standing, play in determining individual accessibility. The link between accessibility through public transportation systems and sustainable cities and the problems of designing these systems with equity in mind are presented. A framework based on current theory related to accessibility and the effect of perceptions on individual accessibility is developed to investigate if there is a relationship between place of residence, socioeconomics and attitudes towards bus travel and perceptions of accessibility. Surveying through a self-administered questionnaire is used as a method to test if relationships do, in fact, exist. Rosengård and Limhamn, two disparate areas of Malmö, Sweden are chosen as study areas. Relationships between place and attitudes towards bus travel are found to be weak or non-existent, with only concerns of bus wait times and timeliness in reaching one’s destination testing as having a significant relationship to place of residence. Bus users’ perceptions of accessibility are also found to be independent of place of residence. This suggests that the bus provides for satisfactory accessibility in Malmö regardless of place of residence and socioeconomic background.
Keywords
Accessibility, Perceived accessibility, Public transportation, Social sustainability
Acknowledgements
We would like to thank the following people for their kind support: Christina Scholten, Malmö University
Erika Knobblock, Malmöstad Fredrik Palm, Skånetrafiken Katrin Lättman, Karlstad University
3
Contents
1. Introduction... 4
1.1 Background: Malmö, Sweden ... 5
1.2 Problem Statement ... 8
2. Theory ... 10
2.1 Measuring Accessibility ... 10
2.2 Non-spatial Factors that Influence Accessibility ... 11
3. Methods ... 14
3.1 Research Design ... 14
3.2 Study Area ... 14
3.3 Questionnaire design ... 16
3.4 Pilot Tests ... 18
3.5 Surveying location and method ... 19
3.6 Survey Data Analysis ... 20
3.6.1 Demographics and Socio-Economic Status ... 21
3.6.2 Attitudes of bus travel experience ... 21
3.6.3 Non-Spatial Factors and Perceived Accessibility Likert Scale Questions ... 22
4. Survey Data Results ... 22
4.1 Rosengård vs Limhamn bus users ... 23
4.2 Overall Bus travel experience: Timeliness, Affordability, Safety and Comfort ... 24
4.3 Perceived Accessibility ... 27 4.4 Missing Data ... 28 5. Discussion ... 29 6. Conclusion ... 31 6.1 Limitations ... 32 References ... 34 Appendix A ... 38
4
1. Introduction
“An advanced city is not one in which the poor can get around by car, but one that even the rich use public transport”// “Una ciudad avanzada no es aquella en la que los pobres pueden moverse en coche, sino una
en la que incluso los ricos utilizan el transporte público” -Enrique Peñalosa (2013)
Accessibility and sustainable urban development are inherently linked to one another. Building a sustainable, resilient city requires a robust transportation system that provides equitable accessibility to all of its citizens. Planning for accessibility is far from an easy task, however, as it requires serious investments of capital and time, complex management of space, and a thorough understanding of human behaviour. As Bertolini (2005) describes it, a major challenge in land use and transport planning is discovering balance in an accessibility measure that is both theoretically and empirically sound. Because of its importance and complexity, accessibility and how to measure and provide for it requires deeper research than what is currently available in geographic approaches to its study. A closer look at the human side of accessibility is needed for the future sustainable development of cites.
This human side requires stepping away from the objective, numbers-based methods that are commonly used in measuring accessibility and exploring the more subjective aspects that influence accessibility. In this regard we turn our attention to perceived accessibility, or to what degree people feel they have access to what they need and want to do. Do people’s perceptions of their own accessibility match the level of accessibility that they have been measured to have? Or do some other factors like place, socioeconomics and attitudes influence these perceptions enough to change a person’s real accessibility? To explore these ideas we investigate the attitudes and perceptions of two socio-economically disparate groups of bus riders in the city of Malmö, Sweden.
The city of Malmö is chosen as the location for our study because of its recent history of swift development and its diverse ethnic and socioeconomic character. Also, importantly, in terms of public transportation, this medium-sized city is primarily serviced by bus, rather than train, light rail or subway, and this limitation in modal choice allows for a more targeted study of perspectives on public transportation.
5 Our paper begins by presenting relevant background on the city of Malmö and then looks at the problem of measuring accessibility and follows with our research questions. Continuing on, we look at existing theory on accessibility and the role that the non-spatial factors of socioeconomics, attitudes and perception play in accessibility. Based on that theory, we then present the hypothesis that socioeconomic factors are reflected in attitudes towards bus use that in turn shape bus users’ perceptions of accessibility. That is followed by our research design, a description of our survey and analytical methods, and the presentation of our findings. The thesis concludes with a discussion on what we have learned through our research, potential policy implications and the limitations of our study.
1.1 Background: Malmö, Sweden
Malmö is a mid-size city of 300,000 inhabitants in the south of Sweden. It is a city that has undergone a massive economic and social shift from a working class city heavy with industry and manufacturing to a multicultural city driven largely by the selling of its image as a leader in sustainability. This shift occurred in conjunction with a national swing towards more neoliberal economics (Hedin, Clark et al. 2012, Schierup, Alund 2011), the result of which is sharply visible in Malmö, where problems like a lack of affordable housing are mostly ignored in favor of more upscale development designed to attract investment.
The regional or city-level competitiveness that has come with neoliberalism in Sweden has seen Malmö having to compete with Sweden’s other big cities for national and EU level funding while at the same time working with (and simultaneously competing with) Copenhagen, Denmark to create a new Öresund region-identity in order to draw the attention of multinational corporations while also attracting new ‘creative’ human capital through development of better amenities. Initiatives driven by this economic shift began in the 1990s with the Bo01 housing exhibition, which spread into a district wide sustainability project in Västra Hamnen that included the building of the Turning Torso and continues today, ideologically and aesthetically, in the southerly district of Hyllie (Baeten 2012). Justification for the focus on growth in Västra Hamnen and Hyllie has largely been built on a discourse of sustainable development. A visit to Malmö City’s website (www.malmö.se) reveals swaths of project pages, publications and reports that are peppered with the word sustainable (hållbar in Swedish). So, while it is logical and perhaps honorable for any city to strive for sustainability and all that it entails, authors such as Guy Baeten (2012) explain that while Malmö is arguably improving in terms of its economic and environmental sustainability it has left social equity far behind.
6 The two areas mentioned above, Västra Hamnen and Hyllie, have been linked together by (and the latter would probably not exist without) a substantial investment in public transportation, the City Tunnel, which is a sort of single metro line that runs between Malmö’s central station (on the edge of Västra Hamnen) in the north and Hyllie in the south. The line that the City Tunnel cuts subterraneously through Malmö runs nicely along the traditional east-west, socioeconomic dividing line of the city. The area to the west of this train line (see Map 1), which includes the district of Limhamn, is an area of affluence both reputationally and statistically, while the area to the east of the line hosts the city’s most severely deprived areas such as Rosengård, an area with serious reputational and socioeconomic problems (Ristilammi 1998). These two districts are standout examples of the east-west, economic-ethnic segregation found in Malmö. Data analysis and mapping carried out through the cooperation of several Swedish institutes and presented in a report (Salonen 2012) for the Commission for a Socially Sustainable Malmö (2013), provides a stark visual account of just how divided the city is (see Map 2).
7 Malmö City has shown over the past 5 years or so a growing interest in addressing this social equity deficit. Concerned by this trend towards segregation and statistical data that showed a seven year difference in life-expectancy depending on where you lived in the city, Malmö City funded a commission on social sustainability. The Malmö Commission’s report on social sustainability (2013), was written by fourteen researchers and provided advice on how Malmö should move forward in terms of social sustainability. This report includes several recommendations, such as free public transportation for children and the building of a new train station near Rosengård, that promote increased accessibility as a tool for overcoming the segregated nature of the city and increasing social equity (Commission for a socially sustainable Malmö, 2013). Providing accessibility might not, however, be so straightforward.
Map 2: Displaying segregated nature of Malmö. Yellow areas are defined as being resource rich and having a majority ethnic-Swedish population. Blue areas are defined as being resource poor and having a majority foreign-background population. Green areas are mixed. Source:
Befolkningsrörelser, försörjningsvillkor och bostadssegregation: En sociodynamisk analys av Malmö, (2012)
8
1.2 Problem Statement
Sustainable urban development entails providing infrastructure that supports sustainable modes of transport, such as mass public transport. Neglecting this would be detrimental to the health of the city. It is known that uncontrolled urban sprawl leads to car dependency that further encourages environmental degradation, economic recession and social inequality. Unsustainable modes of transport such as automobiles contribute to a range of environmental concerns, such as poor air quality, consumption of large amounts of non-renewable energy and compromise of greenbelts. On the human scale, studies have shown that long-term exposure to environmental problems like road wear particles from automobiles increased the risks of respiratory problems (Willers, Eriksson et al. 2013).
Economically, the cost of traffic congestion cannot be ignored. It was estimated that the UK Government would begin paying an annual estimated price of £30 billion in 2010 to deal with congestion (Goodwin 2004), while at the EU level, congestion costs 1 percent of GDP, which translates to €100 billion annually (European Commission 2015). Moreover, effective, sustainable transportation infrastructure is important to ensuring that labour markets are connected with the ‘right’ labour force, which increases the market potential for companies and encourages knowledge spillovers (Pettersson 2009). Even employee turnover rates can be affected by public transportation systems as is demonstrated in a recent study from the US, which found that access to fixed-route bus transit decreased employee turnover (Faulk, Hicks 2015).
In addition to the environmental and economic concerns of transport planning, there are also social considerations that are of importance. Delbosc & Currie (2011), for example, found people that claimed to experience difficulties with transport more often reported that they were not able to participate in activities due to these difficulties. Furthermore, Bannister (2006) points out that, traditionally, transport policy has been designed to accommodate the needs of male, car-based users, which could explain why women have been shown to require more time to access most facilities than men do (Hine 2004). To complicate things further, accessibility and conversely, lack of access, can both reinforce and be affected by problems often found in the urban context, such as social exclusion and segregation. As Karen Lucas (2012, p. 107) writes,
“[...] transport disadvantage and social disadvantage interact directly and indirectly to cause transport poverty. This in turn leads to inaccessibility to essential goods and services, as well as ‘lock-out’ from planning and decision-making processes, which can result in social exclusion outcomes and further social and transport inequalities will then ensue.”
9 When trying to form solutions to the above problems by designing public transportation systems that enable accessibility and promote the use of more sustainable forms of transport, planners and policy makers often encounter the conundrum of generalizability. What works for one region or city or neighborhood does not by default work for others because the makeup of the residents of those areas will not be the same. Given two identically laid out cities, it is not only the spatial context within which the transportation network operates that decides if accessibility is evenly distributed, but also individual preference and the socioeconomic conditions within which the residents find themselves.
As such, socioeconomically segregated cities, like Malmö, present significant challenges for researchers and planners trying to design systems of equitable public transportation that provide good accessibility for all. As our opening quote suggests, public transportation is key to sustainable development. Problems inherent to segregation, such as spatial mismatch (Kryvobokov, Bouzouina 2014), where groups like those with high rates of unemployment live far from the very thing they need most, job opportunities, are problems that can be addressed in part through increasing the accessibility of residents in these segregated areas. But, when planners look to address challenges like these they most often turn to objective integral measures of accessibility that look mostly at factors such as travel distances, availability of transport modes and distribution of employment opportunities and amenities (Kwan, Weber 2003). As such, they fail to incorporate other measures such as residents’ perceptions of accessibility.
These ‘soft’ measures are more difficult to account for, but are crucial to understanding an individual's ‘true’ level of accessibility. Failure to understand this can, in turn, result in the design of public transportation systems that hinder access and people’s mobility, potentially limiting an individual’s opportunities while simultaneously limiting the use and effectiveness of sustainable forms of transportation.
Evidence of this problem exists in health related research by authors such as Hawthorne and Kwan (2013) and Comber (2011), who looked at non-spatial factors affecting perceptions of access to health care facilities. Hawthorne and Kwan demonstrate that despite having good measured accessibility (proximity) to facilities, people in a low-income area do not perceive their access to these facilities as being good because the quality of service is low. Comber, similarly shows that health status and car-ownership (an indicator of socioeconomic standing) are more significant predictors of ease of access to facilities than distance was.
Very little research exists that looks at links between socioeconomic factors, attitudes on public transportation and general perceptions of accessibility. If we are to develop and promote more sustainable modes of mass transit, like bus and rail, then it is necessary to look not only at how a transportation system is physically distributed within the space of a city, but also at how the users of this service ‘feel’ that it meets their needs in terms of accessibility.
10 In order to narrow the scope of our research, we select bus users as the focus of our study. As bus travel is currently a significant part of most cities’ public transportation systems we feel that measuring the perceived accessibility of bus users is important in determining sustainable outcomes in transportation policy. We are concerned with contributing knowledge to the study of accessibility and as such, the purpose of this thesis is to investigate the relationships between socioeconomic factors, attitudes on bus travel and perception of accessibility (as opposed to objectively measured accessibility). In doing this we aim to provide insight into what sort of role perceptions should play in planning for accessibility. These insights may help planners and policy makers to adopt a more holistic approach to accessibility planning that will lead to more equitable public transportation systems and consequently more sustainable cities. As such we propose the following research questions:
1. Is there a measurable relationship between place of residence and attitudes on bus travel? 2. Is there a measurable relationship between place of residence and perceptions of
accessibility?
2. Theory
Accessibility is a complex concept and can be defined and understood in many different ways. Section 2.1 will give an overview of the current theory on accessibility, and section 2.2, will provide a more detailed look at how socioeconomic factors and attitudes work to shape a person’s perceptions of accessibility.
2.1 Measuring Accessibility
As mentioned above, accessibility is complex and may take on different meanings (Haugen 2012). Accessibility can be generally understood as the “potential for reaching locations” (Kwan, Weber 2003, Haugen 2012, Weber, Kwan 2002). To elaborate, there needs to be a spatial separation between a fixed origin and desired destinations as well as an impedance on mobility in order to make accessibility meaningful (Weber 2006). Moreover, accessibility is generally viewed to consist of two dimensions: place-based accessibility and individual (person) accessibility (Cascetta, Cartenì et al. 2013, Haugen 2012, Kwan, Weber 2003).
Place-based accessibility is concerned with the ease of access from one ‘place’ or location to another desired ‘place’. Whereas individual accessibility on the other hand, is concerned with the ease with which people can reach their destinations (Kwan 1998). Kwan (1998) identifies two main approaches to measuring individual accessibility, they are integral and space-time measures. The
11 integral measures set out to calculate either the time or distance between locations using a single point. This model is appropriate for place-based accessibility in comparing accessibility between different locations or zones. However, integral approaches tend to generalize area accessibility, and as such, mask the individual differences of each zone or point.
To overcome this, researchers have turned to disaggregation or non-zonal methods for obtaining integral measures (Kwan 1998). These conventional measures are not useful, however, in understanding individual accessibility as they fail to address variations in an individual’s travel behaviours in three important ways. First, using distance measures takes away the importance of place and its impacts on accessibility. Place is important as it shapes individuals views on access, knowledge of the city, and attitudes (Kwan, Weber 2003). Second, integral measures make the assumption that all trips are based on a single location, thus discounting multi-trips which can result in considerable underestimation of levels of accessibility (Kwan, Weber 2003). Third, they do not take into consideration spatial-temporal constraints. Research in Portland, Oregon, studied the influence of time through traffic congestion and opening hours of businesses and found that when time was taken into consideration there was highly spatially uneven declines in accessibility (Weber, Kwan 2002). Thus, integral measures of accessibility put too much emphasis on distance measures and take away from the individual aspects and influences that affect how people travel.
2.2 Non-spatial Factors that Influence Accessibility
Having established that accessibility is multivariate we now look at non-spatial factors that affect accessibility. Non-spatial factors are any that do not rely explicitly on objective distance as a measure of impedance.
A person's ability to participate in opportunities is important to accessibility. This ‘ability to access’ is a factor determined by one's socioeconomic standing and one's physical reality, which is determined by health status, gender, and other characteristics. Kulkarni, Stough et al. (2000, p. 424) astutely point out that "an agent with the highest income in a region can in theory access all of the economic opportunities in that region". People with lesser incomes are not, however, so lucky. The UK Social Exclusion Unit study on transport and social exclusion found that households that were not able to afford a car, and thusly did not own one, had significantly lower chances of improving their lives as their number of potential job opportunities were decreased; i.e. they could not access workplaces in a reasonable amount of time (Social Exclusion Unit 2003). Other social factors like gender have been seen to compound the problem of low income as a limiting factor in access to opportunities (Hine 2004).
12 A study on access to healthcare facilities by Comber, Brunsdon et al. (2011) provide further evidence of the effect of socioeconomic standing on accessibility. In their study they find that not owning a car is "a significant predictor of perceived difficulties in accessing [healthcare facilities]" (Comber, Brunsdon et al. 2001, p. 7). The same study also finds that one’s health status influences how accessible a facility is perceived to be (Comber, Brunsdon et al. 2011). This is not surprising, as one’s physical condition, inhibited perhaps by disability or old age makes for more difficult mobility and thusly a narrowing of perceived space (Smith 1985).
Perceived space is heavily influenced by time. The faster one can move the more distance one can cover. Faster modes of travel generally lead to greater accessibility. Time, like money, is a resource to be spent in accessing an opportunity and much like money, different people have different amounts of time to spend. And the amount of time they spend on travel will differ and depend on personal choices they have made (Vilhelmson 1999), and as a result, a person’s travel-time budget can be a limiting factor in a person’s individual accessibility (Lucas 2012). Hägerstrand (1985) explains this problem by way of the return principle. People generally start and end their day at the same point in space, and the area they can cover in between these two points in time (departure, return) is determined by the speed with which they can cover distances. When one adds events (work, appointments, picking up children after school, etc.) into this area of time and space it begins to shrink the overall area that is accessible to that person. Since each trip during the day must touch the physical point in space associated with those events, this takes time away from potential movement to another location (Hägerstrand 1985). For each person, this area of time-space is different, which often renders typical accessibility measures irrelevant to them.
Safety is another factor that has been shown to affect accessibility and perceptions of it. While safety is generally a concern for everyone, perceptions of safety have been shown as significantly influencing women’s decisions on modal choice and travel patterns (Loukaitou-Sideris 2009). In research on how the physical space and location of bus stops affects female travelers, Loukaitou-Sideris (2009) showed that the threat of having to use a dangerous bus stop can be a deterrent to their use of public transport. Thus, if fear of violence is limiting in terms of modal choice this may also negatively affect what is accessible to the individual.
As the case of safety concerns demonstrates, cognitive factors also play an important role in accessibility. To begin with, a person must perceive or know of an opportunity before they can access it. Whether that is a job opportunity or an important amenity such as a healthcare facility, if a person is unaware of the existence of it then it is inaccessible to them. Kwan, Murray et al.: “[...] since people do not have information on all opportunities, their cognitive environment and constraints may play an important role in determining which opportunities are accessible to them" ( 2003, pg 131). Scott (2007) demonstrates, for instance, that adolescent girls are far more likely to exercise if they are aware of opportunities to do so regardless of the distances involved, or in her words, "The total
13 number of objectively measured facilities within a mile of girls' homes proved to have no relationship with the amount of physical activity in which the girls engaged. However, the more types of facilities girls perceived accessible, the higher their levels of [physical activity]" (Scott 2007, p. 355. Emphasis ours).
Besides being aware that an opportunity is available to them, a person's attitude towards that opportunity will determine how accessible they perceive it to be. Hawthorne and Kwan (2013), for example, show that despite having several free or low-cost clinics within reasonable proximity to their homes, which would objectively signify 'good' accessibility, residents of a low-income area often forego these opportunities as they deemed their quality to be too low. This attitude development is also linked to ideas like emotional involvement with and desirability of destinations as Canter reviews in his 1975 paper (Canter, Tagg 1975). People develop attitudes or perceptions of certain places that then influence their perceived accessibility to that destination. This, for example, can manifest itself as estimating undesirable or unknown places as being farther away from the traveler than they actually are and vice-versa.
Negative attitudes driven by societal problems such as segregation also affect perceived accessibility. While segregation and associated problems like social exclusion and spatial mismatch (Kryvobokov, Bouzouina 2014) can play a role in geographic accessibility they also play a role in cognition and attitude development that then influences perceived accessibility. Sociological work by Bourdieu (Grenfell 2014) on the concept of habitus and Wacquant (2007) on place and territorial stigmatization explain that people, how they perceive reality and their behaviors are shaped by the social connections and constraints around them and that these constructions are often internalized in group identity. In our case, accessibility is constrained by the internalization that certain opportunities are ‘unreachable’, despite the fact that they are objectively within reach. Haugen (2012) writes, in a more practical way, that, “‘poverty of access’ – depends not only on spatial separation but on other forms of ‘separation’ [that] may include socioeconomic factors such as gender, age, income, ethnicity and other characteristics [implying] that even in the absence of, [for example], space-time constraints, other restrictions that are social in character – for instance, perceptions and cultural factors – may nevertheless limit de facto accessibility.”
A final point in terms of non-spatial factors is that one’s physical and economic reality and one’s attitudes and perceptions also influence choice. Choice, discussed here, is the choice of transport mode. Writers like Anable (2005) and Beirão and Cabral (2007), drawing on Ajzen’s theory of planned behavior (1991), show that when choosing how to travel, many factors, like lifestyle, destination, worldview and perceived levels of service affect whether people choose to travel by car, train or bus. This choice then affects one’s individual accessibility. Choosing the flexibility of a car allows for theoretically greater accessibility than fixed route bus travel allows for, so understanding why people choose the bus is important to accessibility planning.
14
3. Methods
3.1 Research DesignFollowing the tradition of post-positivism we investigate attitudes and perceptions on accessibility as measurable phenomena that contribute to understanding of truth in the social world (Robson 2002). Our research is deductive in nature, as we put forth a hypothesis based on existing theory in the fields of social science and geography (i.e. accessibility). That hypothesis, based on the theory presented in the previous section is:
Factors of place and socioeconomics are reflected in attitudes towards bus use that in turn shape bus users’ perceptions of accessibility.
Our cross-sectional study employs a non-experimental fixed design (Robson 2002) that aims to find relationships between variables associated with the human scale of accessibility. The method selected for answering our research questions on these relationships is to obtain data through surveying residents of two study areas (Limhamn and Rosengård) in the city of Malmö, Sweden and then to analyze that data statistically.
The following sections describe our study areas in detail and the design and implementation of our quantitative method.
3.2 Study Area
The city of Malmö is chosen as the location for our study because of its recent history of swift development and its diverse ethnic and socioeconomic character. Also, in terms of public transportation, the city is primarily serviced by bus, rather than train, light rail or subway, which allows for a more targeted study of perspectives on public transportation. Our study area is further narrowed to the above mentioned districts of Rosengård and Limhamn. They are chosen as study areas for our research for three reasons: 1) the demographic and socioeconomic disparity between them, 2) their approximate equidistance from Malmö’s central business district (CBD as defined by SEPREF at Fastighetsvärlden (2012)) and three major transport nodes (see Map 1), which gives them a similar spatial context within the city, and 3) their similar ranking in an objectively measured accessibility index (Trivector, 2014). We further limit our study to the neighborhoods that fall within a radius of 400m of their central bus stops (Limhamn Centrum and Rosengård Centrum). Malmö City’s online mapping service was used to calculate this radius (www.malmo.se/karta). 400m gave
15 us a radius within which our populations could reasonably be expected to live, as this distance is the desirable maximum distance between home and bus stop according to Swedish planning standards (Trafikverket 2012). For reference purposes we drew data from two sources, the Normativt Index För Hållbart Tillgänglighet i Malmö, 20141 and the Statistikunderlag för Malmö 2007 – 2013 (Malmö Stad) for the three neighborhoods (delområde) in Limhamn and the four in Rosengård that fell, at least partially, within the desired radius. Census data and accessibility index numbers were then averaged or totaled.
This data demonstrates that our study areas are starkly different in all reported demographic categories. Residents of Rosengård have significantly lower levels of education, employment and income than do residents of Limhamn and the city as a whole (see Table 1). Ethnically, a whole 90 percent of the people living in Rosengård have a foreign background (either born abroad or whose parents were born abroad) while only 17 percent of Limhamn’s residents can claim the same.
One aspect in which our two study areas do not show a significant disparity, is in measured sustainable accessibility (Trivector 2014). This measure is derived from factors like distances to amenities by sustainable forms of transport like bicycle, the difference in travel times of these sustainable modes when compared to travel by car, and distance to major transport nodes. Here we see a score of 2.6 for our defined area of Rosengård and 2.3 for Limhamn. According to the study this technically means that residents of Rosengård have an acceptable level of accessibility (any score above 2.5 is acceptable), while the residents of Limhamn do not, but the difference in score is negligible enough that they can both be labelled as having middling levels of accessibility.
1 This was a study carried out for the City of Malmö’s streets and parks department by Trivector wherein the general
level of accessibility of Malmö residents is measured based upon where they live. In the study, geographic accessibility is coupled with individual accessibility to provide a measure of sustainable accessibility. 8 criteria that include access to various transport options, the ratio of time needed to reach a destination when comparing car and public transport and the time required to reach a destination by bicycle are combined with distances to 10 important amenities, such as schools, medical clinics and public transport nodes. Malmö is split up into 226 neighborhood size areas and each is given a final aggregated number between 0 and 5 (5 being the best score) that indicates its level of sustainable accessibility. Scores above 2.5 are deemed to be acceptable. 59 percent of Malmö achieved this ‘acceptable’ rating (Trivector 2014).
16 As the sustainable accessibility index demonstrates, while the number of cars owned by residents of Limhamn (one car for every 2.9 residents) is significantly more than those owned by Rosengård residents (one car for every 7.4 residents) (see Table 1), access to public transportation infrastructure in both areas is similar. Both areas lack direct access to train services and both have more than one bus line running through the area. Bus users at the central bus stop for Rosengård, Rosengård Centrum, are served by two bus lines, line 5 and line 33. Bus users at Limhamn’s central bus stop, Limhamn Centrum, are served by three bus lines, line 4, line 33, and line 34 (see Map 1). Shuffling of bus routes and increases in service have occurred in both areas within the last year (2014-2015). The most significant of these upgrades was the introduction of the MalmöExpressen (line 5), a BRT-like bus line (Institute for Transportation & Development Policy 2015), that runs from the outskirts of Rosengård to Västra Hamnen by the sea (MalmöExpressen). Despite these changes, customer satisfaction surveys regarding bus service carried out in the spring of 2015 show no difference in overall scores between comparable main bus lines 4 and 5 (same score of 7.5 out of ten) and supplementary lines 33 and 34 (scores of 6.8 and 7.0, respectively) (Skånetrafiken). Any differences in the design or condition of buses were therefore not expected to influence the results of the survey.
To summarize, the districts of Rosengård and Limhamn were chosen as test areas for our study because of their contextual similarity in location, access to public transportation and measured accessibility and their contextual differences in demographics and socioeconomics. It is predicted that these contexts will help to elicit answers to our research questions.
3.3 Questionnaire design
In order to answer our research questions on the relationships between place of residence and attitudes and perceptions of bus travel, a questionnaire was designed. The final version of our questionnaire (see Appendix A) consisted of three categories of questions of various type. The first category consisting of eight single selection type questions, asked participants to select from a range of answers on the following: gender, age, place of residence (one of twelve districts of Malmö), completed education, employment status, monthly household income, ethnic background (Swedish or not) and car ownership. The structure and wording of some questions were inspired by statistical categories used by Statistics Sweden (Statistics Sweden). These questions were included in the survey for the purpose of distinguishing between the two study areas as it was theorized that socioeconomic differences between the two areas would be reflected in the portion of their populations that ride the bus. Additionally, economic standing (here measured through monthly income and car ownership) is often used to predict an individual’s travel flexibility, which in turn, has an effect on accessibility (Vilhelmson 1999). Gender was asked for due to disparities in accessibility between men and women that have been noted by authors such as Hine (2004) and Loukaitou-Sideris (2009) and it is possible that these disparities may be compounded by social factors associated with place (Haugen 2012). Employment status was included as it is an important
17 factor in determining the space-time geography and potential time-constraints of a given individual or group (Lucas 2012). Social desirability response bias is likely to have some effect on our results as people were asked questions that reflect their status in society (Robson 2002). Reporting monthly household income may also be difficult for younger people who live with their parents.
The second category of questions were designed to gauge bus users’ attitudes towards bus travel. These questions are included for the purpose of addressing our first research question, Is there a measurable relationship between place of residence and attitudes on bus travel? The nine questions consist of one numeric input question, one single selection type, five Likert scale type (Robson 2002) and two open-ended questions asking for one-word responses. Respondents were first asked to estimate their average wait time and whether or not that wait time is reasonable, and the degree to which they agree that the bus can get them to their destination in a timely manner. As discussed in the theory section, time plays an important role in accessibility and how people perceive it (Hägerstrand 1985, Lucas 2012, Vilhelmson 1999), so testing our populations, who have been shown to be different in socioeconomic character, in terms of their attitudes towards time is important to our study. The questions relating to the comfort of riding the bus and asking for the general positive or negative opinion of the bus-riding experience as a whole are included as they may reflect personal preference in the choice one has in transport mode (Anable 2005, Beirão, Cabral 2007). Bus riders’ attitude toward the cost of taking the bus is questioned because money, much like time, is a resource, the amount of which one has, varies from person to person and as such also places constraints on accessibility (Kulkarni, Stough et al. 2000). Due to Rosengårds higher reputation for crime (Ristilammi 1998), and the spatial difference in the bus stops in Rosengård and Limhamn (see section 3.4) we include the two questions relating to safety and the one on bus stop milieu, in order to test if differences in concerns for safety exist between our two study areas and thusly affect accessibility.
The third category of questions were five-point Likert scale statements asking participants the degree to which they agreed or disagreed on the level of accessibility that the bus provides them. These four questions were inspired by as of yet unpublished research on consumer behavior by Katrin Lättman at Karlstad University (Lättman 2015). The statements (all translated from Swedish) are as follows: It’s easy to do daily activities with the bus. If the bus was my only means of transport I could continue to live the life I want. I can reach all the activities I want to do with the help of the bus. Accessibility to everything I want to do is very good with the bus. The statements are designed in such a way as to measure to what degree people feel the bus provides them accessibility in a general way in their daily lives (including everything they need and want to do, whether fixed or flexible). Specific destinations or trip-purposes are not mentioned. The purpose of these questions is to test if place, as described by writers like Bourdieu (Grenfell 2014) and Wacquant (2007) not only affects one’s attitudes on bus travel but also one’s accessibility in general. These questions, thusly, address our second research question, Is there a measurable relationship between place of residence and perceptions of accessibility?
18
3.4 Pilot Tests
Before the final version of our questionnaire was administered, two rounds of pilot surveying were conducted with the aim of testing the design and administration method of our questionnaire. This testing was crucial for not only trialing our survey method, but also for ensuring that the data obtained through the questionnaire would address our research questions (Bryman 2012).
The first version of our questionnaire included questions, in addition to those asking for demographic information and perceptions of accessibility by bus, which asked respondents to estimate how far they thought Rosengård and Limhamn were from Malmö’s central station in kilometers and minutes of travel. This was tested as an additional method of gauging perceived accessibility based on the work of geographers like Canter (1975) who surmised that inaccuracies in distance estimation may be reflective of people’s place and the attitudes they held towards the end-point of their travel. After testing, it was decided to remove this portion of our questionnaire as analyzing the data obtained from it would require spatial analysis that was beyond the scope of our paper, especially considering the short timeframe for our research. Testing for this version of the questionnaire was carried out at a neutral location, (Malmö Central) to prevent the inclusion of members of our study populations, which can result in misrepresentation (Bryman 2012). A paper version and a touchscreen-phone application version, both self-administered and with identical wording and structure, were both tested. People were approached and asked to participate and if they agreed, were handed either the questionnaire on a clipboard or a mobile phone with a touchscreen. Respondents then answered the questions independently while an observer (author) recorded observations on the time required to complete the questionnaire and any visible difficulties in completing the questionnaire. The resulting observations led to the conclusion that both survey methods produced similar completion times and a lack of complications and that consequently both methods would be used according to the surveyor’s preference. Minor changes were made afterwards in terms of wording of the questionnaire to ensure proper phrasing of questions and formatting of answers to match the Swedish standard (Statistics Sweden), particularly in regard to the demographic questions. Wording of questions and statements on all versions of our questionnaire were proofread by several native-Swedish speakers, known by the authors, to confirm clarity and legibility.
The second version of our survey essentially replaced the previously mentioned distance-estimation and related questions with questions relating to attitudes on bus travel and a question asking respondents to estimate their average wait time. A question asking participants to indicate whether or not their household owns a car was also added. Pilot surveying this time was conducted at a transport hub in Malmö different from the one used for the first pilot survey. Again, this was to decrease the chances of sampling into our target populations. The focus of this pilot study was the
19 questionnaire itself, as the survey method had already been established. This round of testing resulted in only minor corrections of wording and a change in the question asking for income information. It was noticed by the surveyor that asking for household income for the year resulted in some confusion and long calculation time and so, the question was changed to ask for monthly household income, which in the final version proved to be less problematic. Overall, there was very little difference between the second and final versions of our questionnaire.
3.5 Surveying location and method
The Limhamn Centrum bus stop is located on a quiet street with small shops and provides time boards but no shelters for bus users (see pictures 1a, 2a). The Rosengård Centrum bus stop is located under a supermarket on a major road with high-speed traffic and provides shelters and time boards for bus users (see pictures 2a, 2b). This difference in bus stop milieu was expected to influence the responses to a question asking bus users to describe the area of the bus stop in one word.
Picture 1a – Limhamn bus stop Picture 2a – Rosengård bus stop
20 The target populations for surveying were bus users from Rosengård and Limhamn and surveying was conducted by the authors of the paper at the central bus stop locations (Rosengård Centrum and Limhamn Centrum) of the study areas. The surveying attempted to cover all types of bus users in both areas by surveying at different times of the day and week. As such, surveying was completed to capture morning commuters of both areas from 07.30 to 10.00, and the non-working crowd between 14.30 and 18.00. A Saturday and a holiday (May 1st) were also covered from 11.30 to 17.00. People waiting at a given bus stop were approached individually and asked to participate. The response rate, which was 56 percent positive (158/283), was tracked in order to account for non-response bias (Bryman 2012). This is a low non-response rate, but given that our samples are demographically representative of the general populations of Rosengård and Limhamn, this is not likely to be reflected in our data (see Table 2). Participants answered the questions written in both Swedish and English on the touchscreen of a smartphone or through paper and pen, both provided by the survey taker. Surveys took approximately 2-3 minutes to complete. This yielded 145 usable results, 78 of which came by paper questionnaire and 67 by touchscreen phone. Of the 13 failed attempts at response, 10 occurred due to the participants’ bus arriving before they could complete the survey and 3 occurred do to participants failing to understand questions or refusing to answer beyond a certain point. One of the authors does not speak the local language (Swedish) and this generated communication issues with respondents that negatively affected response rate and completion rate. This communication problem occurred most frequently with elderly participants and those with a foreign background. Response rate, failed questionnaires and the number of blank answers were also likely affected by the inherent time constraint when trying to survey people waiting to ride the bus. Bus riders’ wait times are unpredictable and although the surveyors (authors) became better at predicting the arrival of buses as they progressed in their work, a perfect completion rate was impossible.
3.6 Survey Data Analysis
This section presents the steps in which the survey data was analyzed. The survey results from the paper and mobile application were combined together and coded. This data was then uploaded onto IBM SPSS for analysis. The survey results were then summarized according to demographic responses and grouped into area of residence – Limhamn, Rosengård and the Rest of Malmö (used as the control group).
Independent T-Tests and Chi-square statistical tests were chosen for our analysis. The outputs from a T-Test reveals whether the differences in the mean of a sample has statistical significance. The benefits of using the T-Test is in its ease of calculation and robustness. In other instances where the mean of the answers cannot be calculated, a chi-square test was used instead. The Chi-square is used to examine the differences between the actual and expected results of the survey. Additionally, it gave us a level of confidence in accepting or rejecting the hypothesis. For this study, the level of
21 significance has been set at 0.05, which means, p-values greater than 0.05 would result in accepting the null hypothesis and deeming the relationship to be insignificant, that is independent of each other, while p-values less than 0.05 would mean there exists a significant relationship.
3.6.1 Demographics and Socio-Economic Status
To analyze the first section of our survey concerning demographic and socio-economic data, the results were summarized and recorded according to frequency. From here, comparisons were made from our sample to the official socio-economic statistics of Malmö to check if our sample was a fair representation of the respective areas. Additionally, chi-square tests were run to check for statistical significance between area of residence and socio-economic status as we expected residents of Rosengård to have lower income and education levels and a higher percentage of those with foreign backgrounds than Limhamn. These tests were aimed at revealing if there were any differences between the study areas.
3.6.2 Attitudes of bus travel experience
Next, we analyzed the second section of our questionnaire concerning the non-spatial factors of bus travel that were not part of the Likert scale questions. These questions pertain to bus wait times, how reasonable the wait time was, and open-ended one word descriptions.
First, to obtain a glimpse into how place could affect participants perception of time as well as timeliness of the bus service an analysis of the respondent’s estimated (therefore perceived) wait times of the bus, the mean was calculated and a T-Test was carried out in order to understand if there was a significant difference between perceived wait times of Limhamn and Rosengård. For the question concerning how reasonable the wait times were, a summary of the frequencies in answers were grouped together by area of residence.
To analyze the open-ended one word description responses concerning the perception of the bus ride experience and bus stop in the respective study areas, the words were first translated from Swedish to English (if necessary) and then grouped into positive, negative and neutral responses. For instance if the describing word given was “dirty” it would be labelled as a negative response, whereas “fun” was labelled as good and “okay” was considered to be a neutral response. The frequency of each group was summarized and compared between each area, and words that occurred most frequently were noted. For the answers concerning the study area bus stops, the frequencies were compared between residences and the control group. To elaborate, only answers from respondents that resided in the respective study areas whom were surveyed in that area were grouped together. For instance, if a respondent lived in Rosengård but was surveyed in Limhamn Centrum’s bus stop, their answer would be included in the control group for the Limhamn Centrum bus stop, whereas a resident of
22 Rosengård surveyed in Rosengård Centrum was grouped under the Rosengård Centrum bus stop. The purpose of this was to ensure the analysis was tied to the bus stop location.
3.6.3 Non-Spatial Factors and Perceived Accessibility Likert Scale Questions
To understand the differences between areas of residence in terms of attitudes towards bus travel and perceived accessibility of the bus, the differences between the averages were calculated and run through T-Tests.
The responses were given a value from 1-5. A value of 1 was given for responses of ‘Strongly Disagree’, 2 for ‘Disagree’, 3 for ‘Neutral’, and so on (see figure 2a), and an average from these values were calculated through SPSS and grouped by area of residence. The averages were then reviewed and measured against the following benchmark; an overall average of 0 - 2.5 was deemed as disagreement to the statement, 2.6 - 3.4 as neutral and 3.5 – 5.0 for agreed (see figure 2b). For instance, if the average of the values given to a question was 2.5 we would deem the group to have disagreed to that statement. Next, to test the level of significance for these differences between the average responses of the area groups, a standard T-Test was applied.
Additionally chi-square tests were conducted between area of residence and the non-spatial factor questions and again with the perceived accessibility questions to also test for levels of significance. For the chi-square test, the neutral responses were removed and answers of ‘Strongly Agree’ and ‘Agree’ were combined together as ‘Agreed’, the same was done for ‘Disagree’ and ‘Strongly Disagree’ answers, responses that were ‘Neutral’ were removed. The results of the chi-square tests will also check whether there is a statistically significant difference between the area respondents live in and their attitudes towards non-spatial factors and accessibility of the bus.
4. Survey Data Results
Figure 2a. Value Point System Value Answer 1 Strongly Disagree 2 Disagree 3 Neutral 4 Agree 5 Strongly Agree
Figure 2b. Benchmark of Averages Average Range Classification
0 - 2.5 Disagree 2.6 - 3.4 Neutral 3.5 - 5.0 Agree
23 In this section, we will present our data results from the survey after it was put through the data analysis method as described in the above section. The results will be presented in three sections. The first section describes the demographic and socio-economic results, the second section presents the results of the non-spatial factors and the third section presents results from the perceived accessibility questions.
4.1 Rosengård vs Limhamn bus users
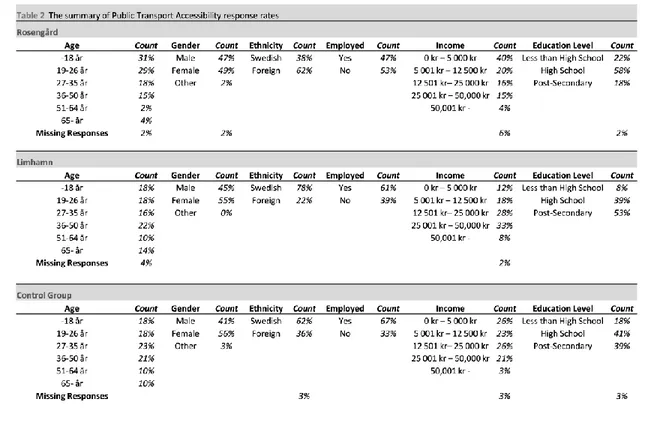
Table 2 shows the summary of the survey responses by area. The survey yielded a total of 145 responses. 51 of those were residents of Limhamn and 55 were from Rosengård. The remaining 39 were grouped and labelled as the control group. The control group consisted of bus users that took transit in the study areas but resided elsewhere in Malmö. The distribution of monthly household income, gender, ethnicity and education levels in the study populations coincides with the official socioeconomic statistics of Malmö. In terms of car ownership between the areas, 48 percent of respondents in Rosengård own a car compared with 55 percent of Limhamn and 54 percent from the control group.
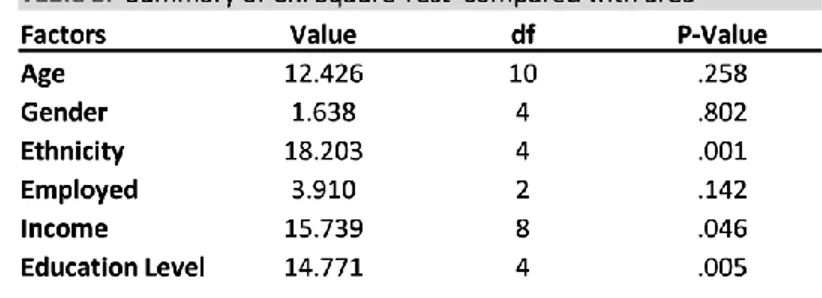
24 Additionally, chi-square testing conducted to compare participants’ demographics and socio-economic status with area of residence (see table 3) shows significant relationships between areas of residence to ethnicity, income and education level as the P-values are smaller than our level of significance of 0.05. As such, a respondent’s age, gender, and employment status were not related to their area of residence as the P-values were greater than our level of significance. Rosengård’s residents showed significance in likelihood to have lower income, to be foreign born, be unemployed and to have completed lower levels of education when compared to residents of Limhamn. The highest proportion of people with a foreign background was in Rosengård at 62 percent compared
to Limhamn (22 percent) and the control group (36 percent). The largest proportion of respondents with post-secondary education were residents of Limhamn. Most persons living in Rosengård had completed secondary education or less.
4.2 Overall Bus travel experience: Timeliness, Affordability, Safety and Comfort
When asked to estimate their average wait time for the bus, the results were similar between the two areas. Limhamn bus users estimated a higher average wait time (M= 10.43, SD = 10.722) than Rosengård bus users (M = 9.22, SD 6.436), where ‘M’ is the mean or average, and ‘SD’ is the standard deviation. The result from the TTest showed this difference to be insignificant, t(101) = -.700, p> .05, where t is the T-Test value and p is the p value which shows the level of significance. The follow-up question asked if the bus users felt that this wait time was reasonable and 27 percent of bus users in Rosengård felt that it was unreasonable, almost double that of Limhamn, in which 16 percent responded that the bus wait time was unreasonable.
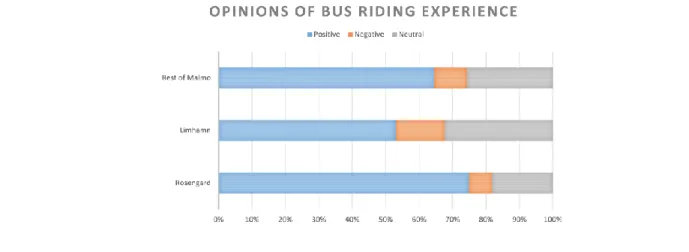
Figure 3 shows the responses in percentages to the question that asked participants to provide a one word description of the bus-riding experience. 75 percent of bus users in Rosengård used positive words compared with 53 percent of bus users in Limhamn, while 65 percent of the control group responded with positive words. A significant number of persons (not shown here) in Rosengård, 32 percent, described the bus-riding experience as ‘good’. Positive words such as ‘comfortable’ and ‘fun’ were also used, contrasting with negative words such as ‘stressful’ and ‘tough’. Limhamn’s
25 residents gave positive words such as ‘environmentally friendly’ (miljövänligt) and ‘enjoyable’ along with words labelling the bus experience as ‘stressful’ and ‘bad’. The number of negative
responses given was 7 percent among Rosengård residents compared with 15 percent among Limhamn residents and 10 percent among the control group.
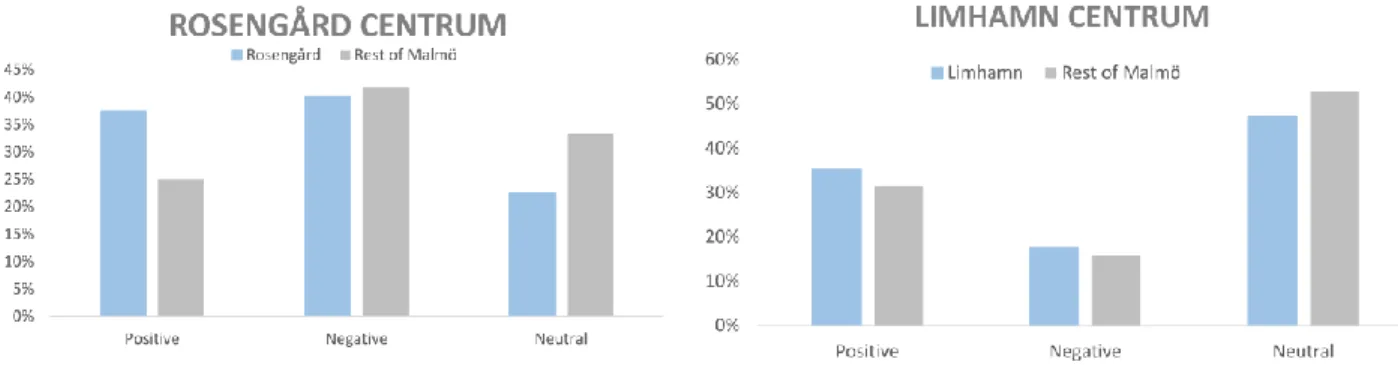
Figure 4 and figure 5 show the grouped responses pertaining to description of the relevant bus stop. The graphs compare area bus stops with the control group (labelled ‘Rest of Malmö’) who were surveyed in the respective areas. Rosengård Centrum bus stop received mixed results compared with Limhamn Centrum. In Rosengård Centrum, more negative words were used to describe the bus stop by its own residents, which was only 2 percent less than the control group’s total (see Figure 4). The top negative words in Rosengård pointed to the uncleanliness of the bus stop, with 15 percent describing the bus stop as ‘dirty’ or ‘unclean’. 5 percent described it as ‘clean’ (not shown). 38 percent of residents in Rosengård gave positive remarks concerning the Rosengård Centrum bus stop, with 25 percent describing it as ‘good’. This translates to a total of 15 positive responses including ‘good’, ‘clean’ and ‘nice’, 16 negative responses including ‘bad’, ‘dirty’ and ‘shitty’ and 9 neutral responses. Though, ‘dirty’ never came up in the list of describing words for Limhamn Centrum, the word stökig occurred twice, which is translated in English to mean ‘messy’. In Limhamn 18 percent of residents gave negative describing words such as ‘dreary’. This was echoed by the control group with 16 percent giving negative response. The number of neutral responses such as ‘okay’ exceeded the number of positive responses given by both Limhamn and the control group.
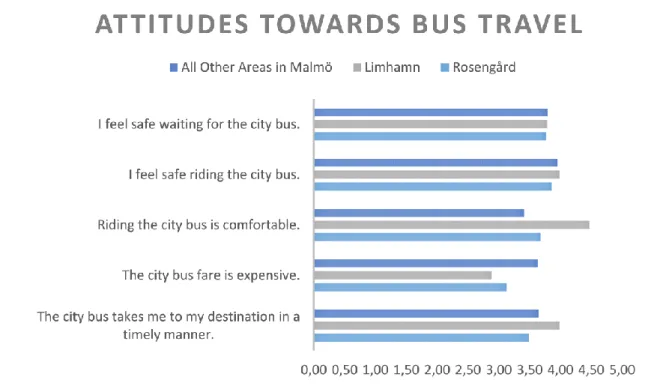
26 Figure 6 shows the responses to the Likert scale questions that were concerned with attitudes towards the non-spatial factors of the bus travel experience. The non-spatial factors were concerned with their attitudes towards factors such as safety, comfort, affordability and timeliness of bus transit. When comparing the averages with our benchmarks discussed in the methods section, Limhamn residents felt that the experience was safe, comfortable, inexpensive and timely (see table 4 for numeric averages). Figure 6 shows residents of Rosengård agreed that the bus ride was comfortable and safe however they were neutral on factors concerning affordability and timeliness. However, these differences between Rosengård and Limhamn were not significant (see table 4 for T-Test results). The results from the T-Test and Chi-square tests (chi-square not shown as they yielded the same results as the T-Tests) express that there were no significant differences between Limhamn and Rosengård as the p-values were larger than our level of significance of 0.05. The exception to this was the question concerning timeliness, which posed the statement The city bus takes me to my destination in a timely manner. There was a significant difference found in this question, t(100) = -.009, p < .05.
27
4.3 Perceived Accessibility
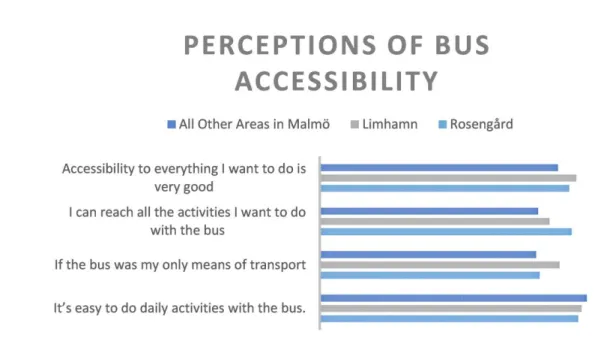
Figure 7 shows the calculated averages for each Likert question concerning perceived accessibility of the public bus. The averages are shown according to area of residence. From the figure we can see that all areas agreed that it is easy to perform their daily activities with the bus and were neutral on the statement, ‘If the bus was my only means of transport I could live the life I want’ (see table 4 for average numeric comparison). Residents in Limhamn tended to agree that accessibility to everything is very good with the city bus, and were neutral for, ‘I can reach all the activities I want to do with the city bus’, whereas, residents of Rosengård agreed that the bus enabled them to reach all the activities that they want to do. Nonetheless, there was no significant difference between study areas on perceptions of public bus accessibility according to our chi-square tests and T-Tests. As shown in table 4 the questions concerning accessibility by bus, ‘It’s easy to do daily activities with the bus’, ‘If the bus was my only means of transport I could continue to live the life I want’, ‘I can reach all the activities I want to do with the help of the bus’ and ‘Accessibility to everything I want to do is very good with the bus’ resulted in significance values greater than 0.05. These results indicate that area of residence does not affect how one perceives the accessibility of the bus.
28
4.4 Missing Data
As with all surveys there will be instances of missing data where respondents did not respond to certain questions and our survey results were no different. Out of the 145 responses there were some instances where questionnaires were not included in the analysis as they were incomplete. This was largely due to the participant’s bus arriving, leaving them no time to fill out the survey. However, when we look into the surveys that have been completed there are two questions that stand out with the highest number of non-response. The questions were #6, ‘What is your monthly household income before taxes’ and #9, ‘On average, how long do you wait for the bus?’. These two questions resulted in 5 (3.4 percent) and 6 (4.1 percent) missing responses respectively. There was an incident concerning question #6 where a respondent decided to abandon the survey completely as he felt the demographic questions were too personal. This could be a reason why question #6 resulted in 5 missing responses. Question #9 required a bit of thinking on the part of the respondent, and some indicated that it was a difficult question to answer due to fluctuations in the bus schedules and so on. Overall, the missing data had little effect on our analysis as most questions had a valid response rate of 97.9 percent and over.
29
5. Discussion
Revisiting our hypothesis, Factors of place and socioeconomics are reflected in attitudes towards
bus use that in turn shape bus user’s perceptions of accessibility, what can we say about its
validity?
As expected, our results show that bus users from Rosengård and Limhamn represent two very different social groups. Coming from different places, with different social identities did not, however, influence bus users’ attitudes and perceptions in a significantly measurable way. In other words, according to our study, people from all areas who ride the bus appear to have the same general feelings towards riding the bus and accessibility.
Interestingly it appears that theorized differences between social groups in terms of expectations of the level of service and accessibility that the bus can provide did not reveal themselves. As discussed above, one group (lower education, lower income, language barrier), who has traditionally been deprived of opportunities and therefore has a constrained cognitive environment (Kwan, Weber 2003, Scott, Evenson et al. 2007) will likely expect less of the bus in terms of accessibility than a group (higher education, higher income, no language barrier) who has a more encompassing cognitive environment.
There is a potential answer to this problem in the results of the final question on our questionnaire which asked people to describe their bus stop in one word. Results for the Rosengård Centrum bus stop were polarized and diverse, with 15 positive responses, 16 negative responses and 9 neutral responses. While these results cannot be said to be correlated to either attitudes on bus use nor perceived accessibility, they do demonstrate the influence of personal worldview on attitude. As Anable (2005) and Beirão (2007) suggest, personal circumstances and situational variables can scatter opinions across a group. In other words personal preference or choice is a powerful factor. So when studying perceived accessibility it may be that a more targeted approach at various user groups would provide more insight into how to improve perceptions of accessibility via the bus which could then work to promote this sustainable form of transport.
Looking at our first research question, Is there a measurable relationship between place of
30 As described in the previous section, our data revealed no statistically significant differences in responses between the places studied according to T-Test results. There were, however, a few trends in the data that proved interesting.
One of the ways in which attitudes on bus travel differed between the two study areas was in terms of time. Although estimated average wait times were the same, around 10 minutes, a greater number of residents from Rosengård deemed this wait time to be unreasonable than did bus users from other areas (27 percent in Rosengård compared with 16 percent in Limhamn). Another question, asking if respondents felt that they could reach their destination in a timely manner by bus also revealed a significant difference. Again residents of Rosengård had a lower opinion on the timeliness of the bus than did both residents of Limhamn and the control group. Lower reported incomes in Rosengård may indicate that of those who use the bus, more are ‘forced’ to do so rather than choosing to do so. They may be more critical of wait times and the timeliness of the bus, therefore, because of the burden it places on both their time and financial budgets.
When asked to describe the overall bus-riding experience, Rosengård riders were overwhelmingly positive with 75 percent using positive words, while Limhamn riders had just a 53 percent positive response rate. These numbers were independent of other factors, however, so explaining this difference is difficult. It could be influenced by the recent introduction of the previously mentioned BRT-style bus line that runs through Rosengård, as many respondents, while filling out their questionnaire remarked to the authors that they liked this ‘new’ bus. This information is anecdotal at best and is thus disregarded for the purposes of this study, but this expressed positivity towards bus travel does warrant further investigation, perhaps in a more qualitative-type study.
Did our second research question, Is there a measurable relationship between place of residence
and perceptions of accessibility?, reveal anything of significance?
The four questions related to perceived accessibility on our questionnaire did not result in any significant place-based differences (see section 4.3). All three groups had mostly middling opinions of the level of accessibility that the bus provided for them. This lack of difference may be due to the combination of three factors:
First, Malmö is a relatively small and compact city with a good distribution of bus lines, so travel times and distances, being mostly reasonable, and having being shown in the sustainable accessibility index (2014) to be mostly equal to given amenities for residents of both Rosengård and Limhamn, may have a low effect on perceived accessibility. Hägerstrand (1985), for one, would not have us ignore these space-time factors.