Master’ Thesis in Criminology Malmö University
90-120 credits Health and Society
COME RAIN OR SHINE, THERE
IS ALWAYS CRIME
EXAMINING THE RELATIONSHIP BETWEEN
TEMPERATURE, PRECIPITATION, AND DAILY
CRIME RATES IN MALMÖ, SWEDEN
COME RAIN OR SHINE, THERE
IS ALWAYS CRIME
EXAMINING THE RELATIONSHIP BETWEEN
TEMPERATURE, PRECIPITATION, AND DAILY
CRIME RATES IN MALMÖ, SWEDEN
JOSEFIN NILSSON
Nilsson, J. Come rain or shine, there is always crime: Examining the relationship between temperature, precipitation, and daily crime rates in Malmö, Sweden.
Degree project in Criminology 30 högskolepoäng. Malmö University: Faculty of
Health and Society, Department of Criminology, 2018.
Crime and weather are common topics of conversation, but rarely simultaneously. Criminological research has investigated the two and found that there is a
connection. However, this nature of the association varies depending on
geography and type of crime. The current study used official crime records and public weather data to investigate the relationship between weather, in the form of temperature and precipitation, and daily crime rates of seven crime types in Malmö, Sweden from 2010 to 2015. Negative binomial regression analyses were run and controlled for a range of temporal and seasonally recurring variables to find the unique contribution of weather. The results showed that rates of assault, bicycle theft, street robbery, and vandalism increased with increasing temperature, and that rates of assault, bicycle theft and arson decreased with the presence of precipitation. Implications for theory are that environmental factors should not be overlooked in explanations of criminal behavior. As for policy implications, the results can aid crime prevention agencies in understanding how crime patterns fluctuate which in turn informs their decision-making relating to prioritization of distribution of resources.
Table of Contents
Background
... 4Previous findings ... 4
Violent crime and weather... 4
Property crime and weather ... 5
Arson and weather ... 6
Theoretical background ... 6
The current study ... 6
Material and method
... 7Area of study ... 7 Crime variables ... 7 Weather variables ... 8 Temperature ... 8 Precipitation ... 8 Control variables ... 9 Season ... 9 Day of week ... 9 Statutory holidays ... 9 Soccer games ... 9 Malmöfestivalen ... 9 Ethical considerations ... 10
Results
... 10 Descriptive statistics ... 10 Regression analysis ... 14Weather and Crime ... 14
Control variables and crime ... 14
Sensitivity and robustness tests ... 17
Causality ... 17
Discussion
... 18Directions for future research ... 19
Study limitations ... 20
Conclusions
... 20References
... 22BACKGROUND
Crime and weather are two common topics in the Swedish news, yet rarely are they discussed together. Long-term crime trends are best explained by widescale policies and socio-demographic factors, whereas daily and hourly fluctuations in crime rates are better explained by more variable aspects of our immediate environment (Cohn, 1990). Weather is a prime contestant for such an environmental factor, due to its universal presence and constant variation. Previous research on weather and crime has been heterogenous in research methods, research setting, and results, and few clear universal trends have emerged.
The current study will examine the relationship between daily fluctuations in weather and crime rates in Malmö, Sweden, and will add value to the field of criminology in two ways. First, by using Malmö as a research setting, it will add information about another city to the growing literature base on weather and crime. Second, by comparing several individual crime types, it will indicate whether patterns relating to weather are unique or universal. The results could therefore be of use for the Police when gathering information about crime trends to prioritize in distribution of resources (Horrocks & Menclova, 2011).
Previous findings
The scientific study of weather, seasonality, and criminal behavior dates back at least to the mid-19th century with the work of Adolphe Quetelet (1842). His studies in France showed that the rates of violent crimes peaked in summer whereas property crimes peaked in winter. He explained this by claiming that on the one hand people’s reasoning abilities decreased with increasing heat, and on the other hand that higher temperatures meant that more people spent time outside increasing the probability of violent meetings.
The topic of weather and crime did however not fully take off until the mid-20th century, and since many study rationales are based on Quetelet’s early work, it is important to distinguish between key terminology. ‘Weather’ refers to specific atmospheric conditions at a specific moment in time and place, whereas ‘climate’ is an aggregated measure of a wider geographical area over the period of several years (Harries & Stadler, 1986). ‘Seasonality’ (which Quetelet’s research was focused on) refers to the temporal variation in seasons recurring annually. While related to weather (e.g. summer is warmer than winter, in Sweden), seasonality is also connected to other variables such as number of daylight hours and the
presence of school holidays, which in term could be connected to crime rates. The focus of this paper is weather.
For the literature review, a systematic search using EBSCOhost was conducted with the key words ‘weather’ and ‘crime’ and resulted in a literature base of peer-reviewed, English articles, published 1990 or later (work published before this date is summarized in Cohn (1990)). Additional literature was added through following citations of the papers, and conducting complementary searches with variations of the key words (including ‘temperature’ and ‘seasonality’).
Violent crime and weather
The most studied relationship, and the one with the most consistent results, is the one between temperature and violent crimes (Cohn, 1990; Horrocks & Menclova,
2011). Violent crimes, both measured as aggregated rates, and individual rates of assault and rape, show a linear positive relationship with temperature. This finding has been replicated across space (UK: Field, 1992; USA: Butke & Sheridan, 2010; Schinasi & Hamra, 2017; Canada: Linning, Andresen,
Ghasiminejad, & Brantingham, 2017; New Zealand: Horrocks & Menclova, 2011; China: Hu et al., 2017b) and level of analysis (daily: Horrocks & Menclova, 2011; monthly: Mares, 2013; annually: Rotton & Cohn, 2003). Homicide on the other hand, is generally not related to temperature (Ceccato, 2005; Cheatwood, 1995; Landau & Fridman, 1993; Mares, 2013; McDowall, Loftin, & Pate, 2012), however Hu et al. (2017b) found a weak significant positive linear relationship. Regarding precipitation, i.e. the amount of rain or snow reaching the ground within a specified period of time, the results are less clear-cut. Studies before 1990 showed that when the relationship with violent crimes was significant, it was negative, but most studies failed to reach a valid significance level (Cohn, 1990). Subsequent studies have shown that when measures are aggregated monthly, there is no significant relationship (Field, 1992; Mares, 2013), however in studies using daily levels of measurement, a significant negative relationship is often found (Horrocks & Menclova, 2011; Michel et al., 2016). It thus seems as though any effects relating to precipitation is more important short-term than long-term. Furthermore, it has been found that unusually high levels of precipitation, especially in places not used to heavy amount of rain and snow, have a deterrent effect on crime rates (Linning, Andresen, Ghaseminejad, & Brantingham, 2017).
Property crime and weather
Property crimes have more complex relationships with temperature than assault, for example. Cohn (1990) found some positive relationships between property crimes and temperature, but they were rather weak. Linning, Andresen and Brantingham (2017) found that property crimes had stronger relations to weather in Ottawa, with a temperate climate, compared to Vancouver, with a milder one. For example, all types of crime, except robbery, decreased with increasing precipitation. However, the study analyzed daily levels in Ottawa and monthly in Vancouver, which could account for some of the differences. Linning, Andresen, Ghaseminejad, and Brantingham (2017) used monthly levels of measurement for several cities and found that results varied both between cities and across types of property crime. Generally, break and enters increased with temperature, whereas robbery rates were unaffected (ibid.) Horrocks and Menclova (2011) used daily data from 43 police districts in New Zealand and found that the higher the temperature, the higher the rates of aggregated measures of theft and burglary. In contrast, Peng et al. (2011), also using daily measures, found that robbery and burglary were unaffected by all but the most extreme weather conditions (both temperature and precipitation), during which they decreased.
Hu et al. (2017a) examined the relationship between heat stress (a composite measure of temperature and humidity) and compared violent robbery with nonviolent robbery. The results showed that both types increased with heat stress in spring, whereas only the nonviolent robberies increased with temperature in summer (ibid.). Since the relationship between weather and property crimes differ across types and levels of measurement, the best way to find any potential
relationship is to examine daily rates and using disaggregated measures of crime types.
Arson and weather
Few studies examine how environment is related to fluctuations in arson rates, and fewer still have examined weather as a potential variable. Yiannakoulias and Kielasinska (2016) examined arson rates in Toronto and found that the rates increased when it was warmer, decreased when it rained or snowed, and increased when the Toronto Maple Leaves hockey team played a home game. Because soccer generally attracts greater interest compared to hockey in Sweden, especially in Malmö, the current study will use dates with home games of Malmö’s male soccer team MFF as a control variable.
Theoretical background
Quetelet’s two explanations for his findings can be seen as the predecessors to the temperature/aggression theory of crime (summarized by Hipp, Bauer, Curran, & Bollen, 2004) and Routine Activity Theory (RAT: Cohen & Felson, 1979). The temperature/aggression theory of crime states that as temperature increases, so does people’s frustration and therefore their aggressive behavior (Hipp et al., 2004). The theory is related to two psychological concepts. The first is Anderson and Anderson’s (1984) general affect (GA) model which states that there are different forms of aggression and people’s intention to harm others is the one most affected by temperature. The second is the negative affect escape model (NAE; Baron, 1972: Baron & Bell, 1976). This model demonstrates that aggression has an inverted-U relationship with temperature in that they both increase to a certain point, at which the heat becomes too much to handle, and aggression subsequently decreases as temperature continues to increase. NAE has found support in laboratory studies but has often failed to reach significant results in behavioral and field studies (Anderson et al., 2000; Anderson & Anderson, 1984; Cohn, 1990). One explanation is that temperatures in daily life rarely reach the extreme temperatures often enough for the relationship to become apparent. In the current study it is therefore more likely that any relationship found follows the linear prediction of the GA model.
RAT states that there needs to be three components present for a crime to be committed: a motivated offender, a suitable target, and lack of a capable guardian (Cohen & Felson, 1979). While initially developed to explain the occurrence of property crimes, it has widened in scope and is liberally applied to crimes of violence as well. Connecting it to weather it can be argued that when the weather is nice outside there are more people around (more suitable targets) which
increases the chance of crimes against person (assault, street robbery, etc.). Although it could be argued that the presence of more people indicates more capable guardians, research has shown that more people in a location generally leads to more violence (Gerell, 2018). In connection to crimes against property warmer and nicer weather would mean less capable guardians of homes, but more capable guardians on the streets.
The current study
Combining official records of daily crime rates with daily measures of
temperature and precipitation, this study will examine how the variation of seven different crimes are related to weather in Malmö, Sweden. The crime types are: public assault, bicycle theft, car burglary, street robbery, vandalism through graffiti, miscellaneous vandalism, and arson.
Effects of seasonality have previously been found in Sweden in the form of summer peaks of assault (Uittenbogaard & Ceccato, 2012; BRÅ, 2014). Thus, while not the focus of the analyses, seasons will be included as a control variable to isolate the effect of weather regardless of time of year.
Other temporal variables which are included are day of the week and statutory holidays. In addition to controlling for the presence of soccer games, the study will also control for the occurrence of Malmöfestivalen, which is a week-long festival annually recurring at the end of August. Both types of events attract large portions of the city’s population and outside visitors, which affect routine
activities.
Due to the varied results of previous studies, the current research is explorative in nature and aims to add information of the relationship between weather and crime in Malmö. The following general predictions are made:
• Hypothesis 1. Assault will have a significant positive relationship with temperature.
• Hypothesis 2. If any other crime type has a significant relationship with temperature, it will be positive in nature.
• Hypothesis 3. If any crime type is found to have a significant relationship with precipitation, it will be negative in nature.
MATERIAL AND METHOD
The study uses an archival approach with daily data of crime rates, temperature, and precipitation in the city of Malmö during the period 1 January 2010 and 31 December 2015.
Area of study
Malmö is the third largest city in Sweden with a population of 328 494 as of 2016 (Malmö Stad, 2017). The climate in Malmö is warm and temperate with a mean annual average temperature of 8.1 degrees centigrade, and high precipitation rates ranging between 33-65 mm per month (Climate-data, 2018). The mean annual crime rate1 is 14 029 incidents reported.
Crime variables
The crime data used was obtained from RAR, the case management system used by the Swedish Police to register offence report information (BRÅ, 2015). The data set included all crimes, of the aforementioned crime types, reported to the Malmö Police some time during the six study years. The information for each incident in the data set included criminal code, coordinates of where the crime took place, estimated start and end date, estimated start and end time, and the date and time it was reported to the Police.
To ensure that each incident was as closely matched with the prevailing weather conditions as possible, several cuts were made to the data set. All incidents reported to have started before January 1st, 2010 were removed. The number of days between estimated end date and start date was calculated, and all crimes with a time period larger than 1 day were excluded.
Several entries lacked coordinates of place of crime. These were retained in the data set under the assumption that they occurred in Malmö. However, to ensure robustness of results, analyses were run with these incidents excluded, and the results were mostly identical.
The arson category included a criminal code for ‘fires without suspicion of crime’. These incidents were removed to ensure only criminal events were studied.
Each crime type was grouped by estimated starting date, which created seven dependent variables with a count of 0 or greater for each of the days during the 6-year period. Table 1. summarizes the descriptive statistics for each crime type before and after the trimming.
Table 1. Comparison of total incidents and daily means before (‘total’) and after
(‘data’) trimming of the data set, for each crime type.
Total Mean SD Variance SE Max per day
Assaulttotal 8272 3.8 2.9 8.3 .06 26
Assaultdata 8090 3.7 2.8 8.0 .06 26
Bicycle thefttotal 25 549 13.5 6.7 44.9 .14 43
Bicycle theftdata 22 607 10.3 5.5 30.1 .12 33
Car burglarytotal 22 016 10.0 4.8 23.2 .10 47
Car burglarydata 18 714 8.5 4.4 19.2 .09 38
Robberytotal 4764 2.2 1.8 3.3 .04 12 Robberydata 4734 2.2 1.8 3.2 .04 12 Graffititotal 6031 2.8 3.0 9.1 .06 25 Graffitidata 5459 2.5 2.9 8.2 .06 25 Vandalismtotal 9513 4.3 4.5 19.9 .10 37 Vandalismdata 6759 3.1 3.1 9.9 .07 26 Arsontotal 3950 1.8 1.6 2.5 .03 15 Arsondata 3661 1.7 1.5 2.3 .03 15 Weather variables
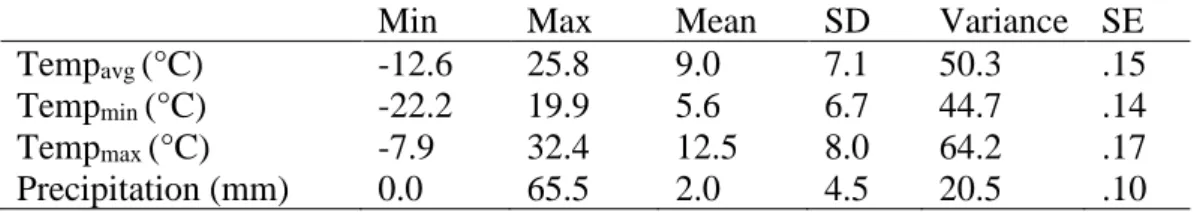
Weather data was obtained from Sweden’s Meteorological and Hydrological Institute’s open database (SMHI, 2018a). Malmö has one operation weather station (Malmö A) which is located east of the city center (long: 55.5714; lat: 13.0734), 20 meters above ocean level. Table 2. summarizes the range, mean, standard deviation, variance, and standard error for each of the below variables.
Temperature
The temperatures measurements gathered, all in degrees Celsius, were daily average temperature, daily minimum temperature, and daily maximum
temperature. Analyses were run with each of the three measurements, and average temperature was shown to have the best fit for most crime types. Few changes to strength and significance of relationship were found.
Precipitation
Precipitation is the collective name for all water falling from the sky: rain, snow, hail, etc. SMHI’s database provided daily total precipitation measured in
millimeters. The value entered for each day is a measurement of total precipitation starting at 6am running to 6am the following day. The precipitation measurement
does therefore not entirely overlap with the measurements of temperature and crime. To reduce the potential effect of this limitation, the precipitation variable was recoded into a dummy variable with 0 indicating no precipitation, and 1 indicating any at all ranging from 0.1 to 65.5 mm. This classification had a 50/50 distribution during the days included in the study.
Table 2. Descriptive statistics for each of the temperature measurements and the
continuous measure of precipitation.
Min Max Mean SD Variance SE
Tempavg (°C) -12.6 25.8 9.0 7.1 50.3 .15
Tempmin (°C) -22.2 19.9 5.6 6.7 44.7 .14
Tempmax (°C) -7.9 32.4 12.5 8.0 64.2 .17
Precipitation (mm) 0.0 65.5 2.0 4.5 20.5 .10
Control variables
The following variables were added as controls in all models to ensure that any effects relating to weather were not confounded by these changes to routine activities. See Table 3 for distribution of the dichotomously coded control variables.
Season
In Sweden winter runs from December to January, spring from March to May, summer from June to August, and fall from September to November according to the calendarial definition (SMHI, 2018b) and were input as such in the analyses. Seasons were dummy coded with summer as the baseline.
Day of week
Day of week was dummy coded with weekday as 0 and weekend (Saturday and Sunday) as 1. Robustness tests for each of the crime types were run with the days of the week dummy coded with Monday as the baseline. For assault and robbery, the effect of Friday was more similar to Saturday and Sunday than the other weekdays. For graffiti and vandalism no clear pattern was found, and for the rest of the crime types, Friday did not significantly differ from Monday. Thus, with interpretative caution, Friday remained classified as weekday.
Statutory holidays
A dummy variable with all statutory holidays (that were not on a Saturday or Sunday) coded as 1 was used. This variable also included Christmas Eve and Midsummer’s Eve since they are often informal holidays at work places.
Soccer games
Soccer games were dummy coded with 1 referring to official home games at the local arena (MFF, 2018). This included games in the national league, Champions league, as well as practice games.
Malmöfestivalen
Malmöfestivalen is a yearly week-long celebration at the end of August, including big open music events, street food booths, and a Tivoli. Due to its large number of visitors, it was included as a dichotomous variable where 1 signified the dates it took place.
Table 3. Distribution of days in control variables.
Type of day Total days (%)
Season Summer 552 (25.2)
Fall 546 (24.9)
Winter 541 (24.7)
Spring 552 (25.2)
Day of week Weekday 1565 (71.4) Weekend 626 (28.6) Statutory holiday Regular day 2132 (97.3)
Statutory holiday 59 (2.7) Soccer games No game 2064 (94.2)
Game day 127 (5.8) Malmöfestivalen No festival 2143 (97.8)
Festival 48 (2.2)
Ethical considerations
Since the data set in RAR contained both coordinates of where each crime was committed, and the time and day it occurred, it could potentially be used to identify the people involved, which in turn makes it sensitive data. The Ethics Council of the Faculty of Health and Society at Malmö University approved the research project once permission was obtained from the Malmö Police to use the data for the present purpose (HS2018 löp nr 10, see Appendix E). The data has been stored safely and not distributed to any outside person. The data set will be destroyed from the author’s possession once all aspects of the project are
concluded.
RESULTS
The results are divided into three parts. The first part of the results shows some general trends of the crime types. The second part of the results shows the findings from the main negative binomial regression model. The third part of the results summarizes the robustness and sensitivity tests that were run to ensure the reliability and validity of the findings.
Descriptive statistics
Crime rates are generally decreasing in Sweden (BRÅ, 2017), as is the case in Malmö specifically. During the current study period rates of bicycle theft and car burglaries clearly decrease, as do rates of arson, assault, and robbery but less steeply, whereas graffiti and vandalism rates appear to increase slightly (see Figure 1.).
Figure 2. presents the monthly variation of rates for each type of crime. Rates of bicycle theft and car burglary seem to peak in summer, and drop drastically in winter, which contrasts with Quetelet’s initial finding of property crimes peaking in winter (1842). Assault rates also peak in summer, with a spike in August, and vandalism rates reach their peak in early spring. The remaining crime types do not exhibit any clear seasonal variation.
Figure 1. General trends of the crime types over the years in the study.
Temperature shows an expected monthly variation with steady increase from January to August, and a steady decrease from August to December (Figure 4). Annually, there seems to be a constant increase in mean temperature (Figure 3).
Figure 3. Mean daily temperature per year.
Precipitation is more fluctuating both annually and monthly, with a peak precipitation season in August, low levels of precipitation in February through April, and remaining steadily around the average of 2.0 mm per day the rest of the months. (Figures 5 and 6).
Figure 5. Mean daily precipitation per year.
Regression analysis
All analyses were conducted using IBM SPSS Statistics 24. Negative binomial regressions with log link function and estimated values2, were conducted for each of the crime types. The model included main effects of average temperature, the dichotomous measure of precipitation, and all control variables. Output and significance is summarized in Tables 4a and 4b.
Weather and Crime
The results of the regression analysis showed that for each 1°C increase in daily average temperature there is a significant increase in rates of assault (2%), bicycle theft (3%), street robbery (1%), and vandalism (2%), all else held constant. Precipitation is significantly negatively associated with assault, bicycle theft, and arson. There is average 10-11% decrease in assault and arson rates, and 6% decrease in bicycle thefts on days when there is precipitation compared to days where there is not. Precipitation was non-significantly negatively associated with street robbery (p = .51). This relationship fluctuated the most in terms of
significance during robustness tests which indicates that there might be an association, however, it is a weak one.
Car burglary and graffiti showed no significant relationship with any of the weather variables.
Control variables and crime
With weather variables accounted for, none of the crime types reach a summer peak in rates. The rates of street robbery and burglary are significantly lower in summer compared to other seasons. Bicycle thefts, vandalism, and graffiti are instead significantly higher in spring, whereas assault rates are significantly higher in fall, compared to summer. Arson is the only crime type unaffected by seasonal variation.
Rates of assault, arson, and street robbery are significantly higher on weekends compared to weekdays. All other crime types instead decrease during the weekend. Rates of car burglary and bicycle theft decrease by 14 and 22 percent, respectively, whereas vandalism and graffiti drop by about 80 percent on weekends. The trends are nearly identical on statutory holidays. The exceptions are street robbery, which is unaffected on statutory holidays, and arson, which shows a large discrepancy. Arson rates increase 15% on weekends, whereas statutory holidays show an increase of 51%, compared to regular weekdays. The results indicate that the rates for car burglary are higher on days with soccer games, however, the relationship remains statistically non-significant at p =.70. No other crime types indicate any specific relationship with the presence of soccer games.
2 The dependent variables consisted of count data which usually indicates a Poisson regression as
the best analysis method. However, as the data exhibited signs of overdispersion, which is often the case with crime rates, using a negative binomial regression with a log link function was more suitable (Hilbe, 2008; Lawless, 1987). This analysis method is essentially a Poisson regression analysis, with the addition of a coefficient, estimated individually for each crime type, to account for the overdispersion and model the data as closely as possible. The closer the negative binomial coefficient is to 0, the closer the distribution resembles a Poisson distribution.
Table 4a. Output from the negative binomial regression model for assault, bicycle theft, car burglary, and street robbery.
Assault Bicycle theft Car burglary Street robbery
IRR LCI UCI NB coef.
IRR LCI UCI NB coef.
IRR LCI UCI NB coef.
IRR LCI UCI NB coef. Temperature 1.02** 1.01 1.03 .19 1.03** 1.03 1.04 .07 1.00 1.00 1.01 .12 1.01* 1.00 1.02 .17 No precipitation 1 1 1 1 Precipitation .89** .84 .94 .94** .91 .98 1.00 .95 1.03 .94b .87 1.00 Summer 1 1 1 1 Fall 1.11* 1.02 1.23 .97 .92 1.03 .91* .85 .97 1.34** 1.20 1.50 Winter .95 .83 1.10 .68** .62 .74 .86* .78 .95 1.35** 1.15 1.60 Spring 1.03 .93 1.15 1.07* 1.01 1.14 .98 .91 1.05 1.21* 1.07 1.37 Weekday 1 1 1 1 Weekend 1.59** 1.50 1.69 .78** .75 .81 .86** .82 .90 1.49** 1.39 1.60 Regular day 1 1 1 1 Statutory holiday 1.51** 1.27 1.80 .67** .59 .76 .81* .71 .92 1.00 .80 1.24 No soccer game 1 1 1 1 Game day 1.09 .97 1.23 1.04 .97 1.11 1.09a 1.00 1.18 1.09 .94 1.25 No festival 1 1 1 1 Malmöfestival 1.81** 1.52 2.15 1.07 .96 1.20 1.00 .87 1.15 1.61** 1.30 2.0 IRR = Incident rate ratio (exp(B)), LCI = lower confidence interval, UCI = upper confidence interval, NB coef. = negative binomial coefficient a) p = .060
Table 4b. Output from the negative binomial regression model for graffiti, vandalism, and arson.
IRR = Incident rate ratio (exp(B)), LCI = lower confidence interval, UCI = upper confidence interval, NB coef. = negative binomial coefficient
Parameter/Crime Graffiti Vandalism Arson
IRR LCI UCI NB coef. IRR LCI UCI NB coef. IRR LCI UCI NB coef. Temperature 1.00 .99 1.01 .51 1.02** 1.01 1.03 .40 1.00 .99 1.01 .19 No precipitation 1 1 1 Precipitation 1.00 .91 1.08 .98 .91 1.05 .90* .83 .97 Summer 1 1 1 Fall 1.02 .88 1.17 .86* .76 .97 1.03 .91 1.17 Winter .88 .71 1.08 .83* .69 1.00 .99 .83 1.19 Spring 1.20* 1.04 1.40 1.34** 1.17 1.52 1.01 .88 1.15 Weekday 1 1 1 Weekend .20** .18 .23 .21** .19 .24 1.15** 1.06 1.25 Regular day 1 1 1 Statutory holiday .16** .11 .25 .53** .42 .68 1.52** 1.23 1.87 No soccer game 1 1 1 Game day 1.09 .91 1.32 1.07 .91 1.26 1.09 .93 1.27 No festival 1 1 1 Malmöfestival .87 .65 1.17 .65* .50 .86 .80 .60 1.07
Assault and street robbery rates increase by 81% and 61%, respectively, during Malmöfestivalen. Vandalism on the other hand drops by 35%. No other crime types indicate any relationship with the presence of the festival.
Sensitivity and robustness tests
The robustness tests mentioned in Methods and Materials showed almost no change in significance or strength of relationships3. In addition to these tests, other
robustness tests were run as well. Checks of Cook’s distance and scatter plots of predicted means against standardized residuals indicated that no data points exert undue influence on the results. Tests of standardized Pearson residuals indicate that there are between 80 and 95 outliers for each crime type (except street robbery which had 2 outliers). Manual scans of these outliers indicate no clear clusters that could add explanatory value. Therefore, they are retained in the analyses.
To account for the general decrease in crime rates of the years a Generalized Linear Mixed Model (GLMM) with a negative binomial distribution and log link, was run with all the variables in the main model as fixed variables, and year of measurement as a random variable. The output can be found in Appendices A and B. The results for the relationships between the weather variables and crime rates generally do not differ in significance, strength, or direction. The exception is rates of car burglary which are positively significant with temperature when year is controlled for. Rates of car burglary are also shown to significantly increase by 10% during soccer games in this model.
Causality
Most studies have examined the associative nature of weather and crime, but some have suggested that there is a causal pathway (e.g. Hsiang & Burke, 2014). In order to examine whether or not weather causes the changes in crime rates, explorative tests using narrower levels of analyses were run. Using the estimated start time for each incident, and hourly data from SMHI, variables for 6-hour intervals of each day were created for all weather and crime variables. The results from the following analyses are considered preliminary and a degree of caution is applied in any interpretations made. These new variables consisted of smaller samples since all crimes without an estimated start time were excluded. Furthermore, the degree of uncertainty in the matching with weather is higher since the difference between estimated start time and estimated end time varied between 1 and 48 hours. Furthermore, the hourly data in temperature and
precipitation was incomplete, meaning that some days lacked data for one or more measurement intervals, and other days had completely missing data. All dates without 24 data points were thus excluded from the analysis.
Negative binomial regressions, with the same model setup as the main analysis, were run for each of the four 6-hour intervals for each crime type. A selection of significant relationships are reported below (see Appendix C and D for full output).
3 The two exceptions were both related to street robbery. In the model with minimum temperature
and the model without incidents that lacked coordinates, street robbery had a negative significant relationship with precipitation.
Assault. Temperature was positively related to assault rates between 18:00 and
midnight, whereas precipitation had a negative relationship in the same period. The positive relationship with days of the Malmöfestival retained significance between 18:00-06:00.
Bicycle theft. Temperature and rates of bicycle theft were positively related all
four intervals, whereas the relationship with precipitation did not retain its significance.
Car burglary. No significant relationships with temperature or precipitation were
found, however there was a significant positive relationship between game day and car burglaries for the 18:00 to midnight interval.
Street robbery. Street robbery had a positive significant relationship with
temperature between 12:00-18:00. The crime type also retained its significant increase during Malmöfestivalen between midnight and 06:00, and noon and midnight.
Graffiti. Temperature was positively related with graffiti rates between 6:00 and
12:00, and negatively(!) related between 18:00 and midnight. A negative relationship with precipitation between 6:00 and noon was also found.
Vandalism. Temperature and vandalism had a positive relationship between
18:00 and midnight. Vandalism significantly decreased during Malmöfestivalen between 12:00 and midnight.
Arson. Arson rates significantly decreased during nights of Malmöfestivalen
(18:00 to midnight). No significant relationship with temperature or precipitation was found.
DISCUSSION
The current study used archival data sets and generalized linear modelling to test the relationship between weather and crime rates in Malmö, while accounting for time of year, and recurring events that are likely to affect the routine activities of large amounts of people. Three main hypotheses were tested. The first hypothesis stated that assault and temperature would have a significantly positive
relationship. The results support this hypothesis. The estimated 2% increase in assault rates, all else held constant, means that an increase of two standard
deviations in temperature (e.g. a day with 24.2°C compared to 10°C) corresponds to 1.05 more assaults. The second hypothesis stated that any other significant relationship between temperature and crime type would be positive in nature. The results of bicycle thefts, street robberies, and vandalism supported this prediction4. In their cases, an increase of two standard deviations in temperature would be associated with 4.39 more bicycles stolen, 0.31 more street robberies, and 0.88 more incidents of vandalism, all else held constant. The third hypothesis was related to precipitation and stated that any association between crime rate and
4 One result contradicted the prediction, namely graffiti rates decreasing with increasing
temperature between 18 and midnight. There is no obvious explanation for this and could be a result of the study limitations. However, it warrants further examination, should the result be replicated.
precipitation would be negative in nature. This relationship was found for assault, bicycle theft, and arson.
These findings replicated some previous ones such as the positive linear relationship between temperature and assault (e.g. Cohn, 1990; Mares, 2013); temperature and bicycle theft (a type of property crime) (Horrocks & Menclova, 2011); and the negative relationship between precipitation and the crime types assault, bicycle theft, and arson (Linning, Andresen, Ghaseminejad, &
Brantingham, 2017; Michel et al., 2016; Yiannakoulias & Kielasinska, 2016). However, contrary to some findings (e.g. Linning Andresen, Ghaseminejad, & Brantingham, 2017; Peng et al., 2011), street robberies were shown to increase with temperature in the Malmö data set. Previous results showing that arson rates increased with temperature and the presence of important sporting events
(Yiannakoulias & Kielasinska, 2016) were not replicated.
The results can be interpreted in lines with temperature/aggression theory and RAT which both claim that ‘nicer’ weather (warm with a lack of precipitation) is more likely to take people out of their homes, and with more people on the street and therefore higher likelihood of violent interactions (Gerell, 2018; Cohen & Felson, 1979), and the increase in aggression due to heat (Anderson & Anderson, 1984), assault rates increase. In relation to bicycle thefts it can be interpreted that when it is ‘nice’ weather, people are more likely to cycle somewhere that puts the bikes in a public place which increases the likelihood of the interaction between motivated offender and lack of capable guardian. In relation to car burglary, which is unrelated to weather, it is that people are just as likely to use their cars regardless of weather.
In terms of causality, the results of the 6-hour interval regressions indicate that some, but not all, relationships with weather is found when looking at more immediate connections. Taking into account that the previously clear summer peak for assault (e.g. Uittenbogaard & Ceccato, 2012) disappears when temperature is taken into consideration, it could be that the hotter weather of summer is the cause of this finding. Future studies, comparing crime rates on days with seasonally anomalous weather conditions, could shed some light on the validity of this interpretation.
Directions for future research
In addition to detailed examination of the seasonality results, there are several other interesting findings that warrant further exploration which are beyond the scope of this paper. One such finding is the variation between regular weekdays compared to weekends and statutory holidays. For example, while assault showed high increased rates during weekends, this result varied depending on time of day (see Appendix C) with significant increase during nighttime, but significant decrease during daytime. Investigating why such effects occur, for both assault and other crime types, could be useful. For example, it is unclear why vandalism and graffiti would show and increase during regular weekdays. It could be an artefact of reporting bias, in that companies report the act of vandalism to have taken place sometime between office closing on Friday and opening again on Monday. However, the current study excluded all cases with longer periods of uncertainty, so the results are more likely due to something else.
Another interesting finding is that there was a significant increase in car burglaries on days with soccer games during the time when they game occurred. Although potentially a spurious finding, due to the limitations of the study, it could indicate a higher vulnerability of cars during this time. Further investigation should examine the locations of the car burglaries, especially in relation to the soccer arena, in order to draw any decisive conclusions. This type of research would also be an extension of studies looking into weather effects on spatial patterns of crime in cities (e.g. Brundson et al., 2009; Linning, 2015).
Additionally, while the connection between weather and crime exists, the explanatory mechanisms are uncertain and need further examination, preferable interdisciplinary. There are studies on how weather is related to other types of behavior, which might be related to criminality. Liu, Kostakos, and Li (2015) found that humans increase their planning behavior in warm climates, and decrease in cold climates, which indicates that heat may be related to impulse control. This is further supported by Gailliot (2014) who showed that self-control decreases with rise in temperature.
Study limitations
To fully interpret the results a few limitations must be considered. First, the results are based on official statistics of crime data, which are known to be limited in their scope since not all crimes are reported (Linning, Andresen, &
Brantingham, 2017). Furthermore, the uncertainty of when a crime took place is rather high if not reported immediately, which makes it difficult to accurately match with the weather at the time.
Second, no information on the perpetrator is victim was accessible. If the motive of each crime was known, one could test the theory that aggressive motives are related to weather, whereas calculating ones are not, which in turn could account for some of the variability and settle uncertainties (e.g. the fickle nature of significance between robbery and precipitation). This also means that there is no information about alcohol consumption which could have added explanatory value due to its relation to weather and to certain crime types (Gailliot, 2014; Lemon et al. 2017).
Third, only a limited number of weather variables were used. Conditions such as wind speed and daylight hours have been shown to be related to some crime types in some places (e.g. Cohn, 1990). However, the explorative nature of the study resulted in early decisions to only include a limited number of weather variables, ones that were both supported in previous research, and which had accessible reliable data. Future studies should include more aspect of daily weather variation, as well as interaction effects of current variables.
CONCLUSIONS
This analysis of official crime records and weather measurements in Malmö found that rates of assault, bicycle theft, street robberies, and vandalism increase with increasing temperature, and rates of assault, bicycle theft, and arson decrease during precipitation, all else held constant. While the results are generally in line with previous research, the variation in specific patterns highlights the importance of tailoring policies and predictions to each crime type and city (McDowall, Loftin, & Pate, 2012).
Since the results remain stable when accounting for the general decrease in crime rates over time, the findings can be assumed to be generalizable during longer time periods in Malmö. Thus, the study adds valuable information to the knowledge base that helps the Police and other crime prevention agencies
understand crime trends, in order to help them make priorities in their distribution of resources. However, it is important to keep in mind that the results are limited to the crime types included in the study and should therefore be regarded in relation to other knowledge about situational and temporal patterns of crime in the city (Tompson & Bowers, 2015) as well as information on other crime types (Sorg & Taylor, 2011).
Despite limitations, the strengths of the study allow the results to add value to the growing literature base on weather and crime. It builds on previously successful study methods, uses official data sets from a specific geographic location, over a large span of time, and accounts for several potentially confounding variables to find the unique contribution of temperature and precipitation on daily fluctuations of crime rates. The clear existing relationship between weather and crime justifies the continued exploration of the interaction between environmental factors and crime rates. Furthermore, understanding the small-scale impacts of changing weather could hopefully aid our understanding of how and why climate change impacts crime rates on larger scales (Hsiang & Burke, 2014).
Acknowledgements. The author would like to thank Zoran Markovic for offering
his expertise on the Swedish Police. Many thanks also go to Manne Gerell for his constant support during this process, and to Diana Deaconu for her helpful comments.
REFERENCES
Anderson C A, Anderson D C, (1984) Ambient temperature and violent crime: Test of the linear and curvilinear hypotheses. Journal of Personality and Social
Psychology, 46, 91-97.
Anderson C A, Anderson K B, Dorr N, DeNeve K M, Flanagan M, (2000) Temperature and aggression. Advances in Experimental Social Psychology, 32, 63-133.
Baron R A, (1972) Aggression as a function of ambient temperature and prior anger arousal. Journal of Personality and Social Psychology, 21, 183-189. Baron R A, Bell P A, (1976) Aggression and heat: The influence of ambient temperature, negative affect, and a cooling drink on physical aggression. Journal
of Personality and Social Psychology, 33, 245-255.
Brottsförebyggande rådet, Brå (2014) Kortanalys: tid för brott. Rapport 2014:04. Stockholm: Brottsförebyggande rådet.
Brottsförebyggande rådet, Brå, (2015) Avrapportering i
Ingripandeverksam-heten: En tidsstudie. Rapport 2015:10. Stockholm: Brottsförebyggande rådet.
Brottsförebyggande rådet, Brå, (2017) Brottsutvecklingen i Sverige fram till år
2015. Rapport 2017:5. Stockholm: Brottsförebyggande rådet.
Brunsdon C, Corcoran J, Higgs G, Ware A, (2009). The influence of weather on local geographical patterns of police calls for service. Environment and Planning
B: Planning and Design, 36, 906-926.
Butke P, Sheridan S C, (2010). An analysis of the relationship between weather and aggressive crime in Cleveland, Ohio. Weather, Climate, and Society, 2, 127-139.
Ceccato V, (2005) Homicide in São Paulo, Brazil: Assessing spatial-temporal and weather variations. Journal of Environmental Psychology, 25(3), 307-321.
Cheatwood D, (1995) The effects of weather on homicide. Journal of Quantitative
Criminology, 11(1), 51-70.
Climate-data, (2018) Klimat: Malmö. >climate-data.org< HTML (30 Mar 2018). Cohn E G, (1990) Weather and crime. British Journal of Criminology, 30(1), 51-64.
Cohen L E, Felson M, (1979). Social change and crime rate trends: a routine activity approach. American Sociological Review, 44(4), 588-608.
Field S, (1992) The effect of temperature on crime. The British Journal of
Gailliot M T, (2014). An assessment of the relationship between self-control and ambient temperature: a reasonable conclusion is that both heat and cold reduce self-control. International Review of Social Sciences and Humanities, 8(1), 149-193.
Gerell M, (2018) Bus stops and violence: are risky places really risky? European
Journal on Criminal Policy and Research, 1-21.
Harries K D, Stadler S J, (1986) Aggravated assault and the urban system: Dallas.
Journal of Environmental Systems, 15, 243-253.
Hilbe J M, (2008) Negative binomial regression. Cambridge: Cambridge University Press.
Hipp J R, Bauer D J, Curran P J, Bollen K A, (2004) Crimes of opportunity or crimes of emotion? Testing two explanations of seasonal change in crime. Social
Forces, 82(4), 1333-1372.
Horrocks J, Menclova A K, (2011) The effects of weather on crime. New Zealand
Economic Papers, 45(3), 231-254.
Hsiang S M, Burke M, (2014) Climate, conflict, and social stability: what does the evidence say? Climate Change, 123, 39-55.
Hu X, Chen P, Huang H, Sun T, Li D, (2017a) Contrasting impacts of heat stress on violent and nonviolent robbery in Beijing, China. Natural Hazards, 87, 961-972.
Hu X, Wu J, Chen P, Sun T, Li D, (2017b) Impact of climate variability and change on crime rates in Tangshan, China. Science of The Total Environment,
609, 1041-1048.
Landau S F, Fridman D, (1993) The seasonality of violent crime: the case of robbery and homicide. Journal of Research in Crime and Delinquency, 30(2), 163-191.
Lawless J F, (1987). Negative binomial and mixed Poisson regression. The
Canadian Journal of Statistics, 15(3), 209-225.
Lemon D J, Partridge R, Pan-Dorsett Cardiff Model Team, (2017) Is weather related to the number of assaults seen at emergency departments? Injury, 48(11), 2438-2442.
Linning S J, (2015) Crime seasonality and the micro-spatial patterns of property crime in Vancouver, BC and Ottawa, ON. Journal of Criminal Justice, 43, 544-555.
Linning S J, Andresen M A, Brantingham P J, (2017) Crime seasonality: examining the temporal fluctuations of property crime in cities with varying climates. International Journal of Offender Therapy and Comparative
Linning S J, Andresen M A, Ghaseminejad A H, Brantingham P J, (2017) Crime seasonality across multiple jurisdictions in British Columbia, Canada. Canadian
Journal of Criminology and Criminal Justice, 59(2), 251-280.
Liu Y, Kostakos V, Li H, (2015) Climatic effects on planning behavior. PLoS
ONE, 10(5).
Malmö FF, MFF, (2018) Spelade matcher. >mff.se< HTML (28 Apr 2018). Malmö Stad, (2017) Malmö i Korta Drag. >malmo.se< PDF (28 Apr 2018). Mares D, (2013) Climate change and crime: monthly temperature and
precipitation anomalies and crime rates in St. Louis, MO 1990-2009. Crime, Law,
and Social Change, 59(2), 85-208.
McDowall D, Loftin C, Pate M, (2012) Seasonal cycles in crime, and their variability. Journal of Quantitative Criminology, 28, 389-410.
Michel S K, Wang H, Selvarajah S, Canner J K, Murrill M, Chi A, Efron D T, Schneider E B, (2016) Investigating the relationship between weather and violence in Baltimore, Maryland, USA. Injury, 47(1), 272-276.
Peng C, Xueming S, Hongyong Y, Dengsheng L, (2011) Assessing temporal and weather influences on property crime in Beijing, China. Crime, Law, and Social
Change, 55(1), 1-13.
Quetelet A, (1842) A Treatise on Man and the Development of His Faculties. Edinburgh: W. and R. Chambers. Retrieved from:
http://hdl.handle.net/2027/uc2.ark:/13960/t78s51j9z.
Schinasi L H, Hamra G B, (2017) A time series analysis of associations between daily temperature and crime events in Philadelphia, Pennsylvania. Journal of
Urban Health, 94(6), 892-900.
Sorg E T, Taylor R B, (2011) Community-level impacts of temperature on urban street robbery. Journal of Criminal Justice, 39, 463-470.
Sveriges meteorologiska och hydrologiska institut, SMHI, (2018a) Öppna data:
Meteorologiska observationer. >smhi.se< XLSX (2 Mar 2018).
Sveriges meteorologiska och hydrologiska institut, SMHI, (2018b) Årstider. >smhi.se< HTML (30 Mar 2018).
Tompson L A, Bowers K J, (2015) Testing time-sensitive influences of weather on street robbery. Crime Science, 4(8),
Uittenbogaard A, Ceccato V, (2012) Space-time clusters of crime in Stockholm, Sweden. Review of European Studies, 4(5), 148-156.
Yiannakoulias N, Kielasinska E, (2016) The effect of temperature on arson incidence in Toronto, Ontario, Canada. International Journal of Biometeorology,
APPENDICES
Appendix A. Output from GLMM with year as random variable for assault, bicycle theft, car burglary, and street robbery.
Assault Bicycle theft Car burglary Street robbery
IRR LCI UCI NB coef.
IRR LCI UCI NB coef.
IRR LCI UCI NB coef.
IRR LCI UCI NB coef. Temperature 1.02** 1.02 1.03 .19 1.04** 1.03 1.04 .07 1.01** 1.01 1.02 .12 1.02** 1.01 1.03 .17 No precipitation 1 1 1 1 Precipitation .90** .85 .96 .95* .92 .99 1.00 .96 1.05 .95 .88 1.01 Summer 1 1 1 1 Fall 1.14* 1.03 1.25 .99 .94 1.05 .96 .90 1.03 1.38** 1.23 1.55 Winter .99 .85 1.14 .72** .66 .78 .97 .88 1.08 1.46** 1.24 1.73 Spring 1.06 .95 1.17 1.10* 1.04 1.17 1.05 .97 1.13 1.27** 1.12 1.44 Weekday 1 1 1 1 Weekend 1.59** 1.49 1.69 .78** .75 .81 .86** .82 .90 1.48** 1.38 1.59 Regular day 1 1 1 1 Statutory holiday 1.54** 1.29 1.83 .67** .59 .76 .81* .71 .93 1.02 .81 1.27 No soccer game 1 1 1 1 Game day 1.09 .97 1.23 1.03 .96 1.11 1.10* 1.01 1.20 1.08 .94 1.24 No festival 1 1 1 1 Malmöfestival 1.81** 1.52 2.15 1.07 .96 1.20 1.00 .87 1.15 1.59** 1.28 1.96
Appendix B. Output from GLMM with year as random variable for graffiti, vandalism, and arson.
Graffiti Vandalism Arson
IRR LCI UCI NB coef. IRR LCI UCI NB coef. IRR LCI UCI NB coef. Temperature 1.00 .99 1.01 .51 1.02** 1.01 1.03 .40 1.00 1.00 1.02 .19 No precipitation 1 1 1 Precipitation .98 .90 1.07 .98 .91 1.05 .91* .85 .98 Summer 1 1 1 Fall 1.03 .89 1.19 .86* .76 .97 1.05 .92 1.21 Winter .90 .73 1.11 .87 .71 1.04 1.09 .90 1.31 Spring 1.21* 1.04 1.41 1.36** 1.19 1.55 1.05 .92 1.21 Weekday 1 1 1 Weekend .20** .18 .23 .21** .19 .23 1.15** 1.06 1.25 Regular day 1 1 1 Statutory holiday .17** .12 .25 .52** .40 .66 1.53** 1.24 1.89 No soccer game 1 1 1 Game day 1.08 .89 1.30 1.07 .91 1.26 1.08 .92 1.26 No festival 1 1 1 Malmöfestival .86 .64 1.16 .65* .50 .86 .80 .60 1.07
Appendix C. Incident rate ratios from negative binomial regression for each 6-hour interval of the day, for assault, bicycle theft, car burglary, and street
robbery.
Assault Bicycle theft Car burglary Street robbery
00-06 06-12 12-18 18-00 00-06 06-12 12-18 18-00 00-06 06-12 12-18 18-00 00-06 06-12 12-18 18-00 Temperature 1.02 1.01 1.03 1.03** 1.05** 1.03** 1.03** 1.03** 1.01 1.01 1.00 1.01 1.01 1.02 1.02* 1.01 No precipitation 1 1 1 1 1 1 1 1 1 1 1 1 1 1 1 1 Precipitation .83 .73 .91 .70** .94 .90 1.00 .92 .96 .98 1.02 .99 .99 .74 1.09 .89 Summer 1 1 1 1 1 1 1 1 1 1 1 1 1 1 1 1 Fall .86 1.69** 1.43** .86 .66** 1.12* 1.04 .87** .68** 1.00 .99 .86* 1.12 1.17 1.34* 1.52** Winter .84 1.11 1.16 .76* .74 .83* .69** .55** .73* .99 .90 .82* 1.00 1.12 1.33 1.64** Spring .70* 1.36 1.34** .96 1.03 1.17* 1.05 1.04 .88 1.04 .97 .98 1.00 1.17 1.27 1.39** Weekday 1 1 1 1 1 1 1 1 1 1 1 1 1 1 1 1 Weekend 7.42** .44** .76** 1.13* 2.00** .41** .84** .87** 1.22** .57** .89** .85** 5.43** .52** .72** 1.10 Regular day 1 1 1 1 1 1 1 1 1 1 1 1 1 1 1 1 Statutory holiday 5.08** .81 .50 1.17* .67 .44** .72 .83* 1.83** .39** .71** .82* 2.97* .72 .72** .74 No soccer game 1 1 1 1 1 1 1 1 1 1 1 1 1 1 1 1 Game day 1.08 1.09 1.18 1.12 1.13 1.01 .99 1.07 1.07 1.08 1.04 1.13* 1.19 .93 1.08 1.07 No festival 1 1 1 1 1 1 1 1 1 1 1 1 1 1 1 1 Malmöfestival 1.61* 1.33 1.28 2.46** 1.02 1.16 .91 1.15 1.11 .88 .99 1.01 1.72* 1.01 1.58* 1.67*
Appendix D. Incident rate ratios from negative binomial regression for each 6-hour interval of the day, for graffiti, vandalism, and arson
Graffiti Vandalism Arson
00-06 06-12 12-18 18-00 00-06 06-12 12-18 18-00 00-06 06-12 12-18 18-00 Temperature 1.00 1.03* 1.02 .97* 1.03 1.01 1.00 1.02** 1.01 .98 .99 1.00 No precipitation 1 1 1 1 1 1 1 1 1 1 1 1 Precipitation .85 1.07* 1.07 .93 .64 .74 .99 1.01 .82 .66 1.07 .87 Summer 1 1 1 1 1 1 1 1 1 1 1 1 Fall .54* 1.75** 1.54* 1.18 .60* .89 1.04 .76** .77* 1.01 1.37* 1.12 Winter 1.16 1.34 1.37 .84 1.11 1.59* .85 .60** .73* .76 1.31 1.13 Spring 1.58* 1.54* 1.22 1.19 1.15 1.40* .97 1.34** .81 .76 1.38* 1.07 Weekday 1 1 1 1 1 1 1 1 1 1 1 1 Weekend .47** .08** .10** .61** 1.44* .16** .21** .16** 1.49** .75* .95 1.15* Regular day 1 1 1 1 1 1 1 1 1 1 1 1 Statutory holiday .18** .02** .20** .48 .81 .20** .27** .61* 1.84* .77 1.69* 1.58* No soccer game 1 1 1 1 1 1 1 1 1 1 1 1 Game day 1.46 .89 1.04 1.19 1.02 1.32 1.03 1.07 1.19 1.51 .69 1.14 No festival 1 1 1 1 1 1 1 1 1 1 1 1 Malmöfestival .80 .91 1.31 .81 .15 .85 .50* .59* .83 1.19 .97 .54*
Appendix E. Statement from Malmö University Ethics Council, Faculty of Health