Improvement of Automotive Article Placement
and Workload Distribution in Warehousing
Erik Berggren
Final thesis 2016
Industrial Engineering and Management,
Logistics Management
Post adress: Adress: Telephon:
This bachelor thesis is executed at the School of Engineering at Jönköping University within Industrial Engineering and Management with focus on Logistics Management. The stated opinions, conclusions and results are those of the authors only.
Examiner: Hamid Jafari
Supervisor: Roy Andersson
Scope: 15 hp (Basic level)
Abstract
Abstract
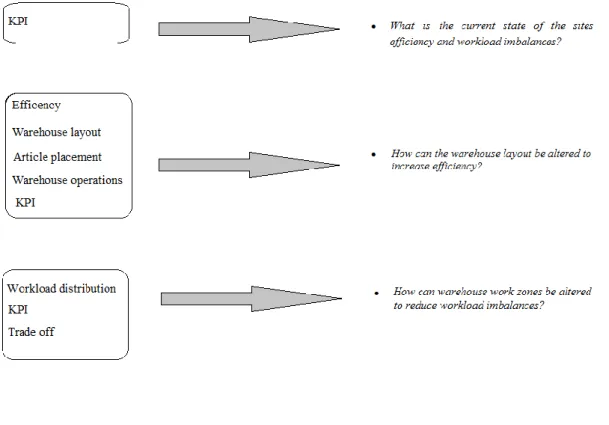
Purpose – The purpose is to: Improve the efficiency of warehouses operations as well as reduce its workload imbalances by altering the warehouse layout and work zones at a storage area. This was done by answering the following research questions:
What is the current state of the sites efficiency and workload imbalances?
How can the warehouse layout be designed to increase the efficiency?
How can warehouse work zones be altered to reduce workload imbalances?
Method – The purpose was achieved through a case study at a vehicle manufacturing
facility. By studying established methods of efficiency, layout designs and workload imbalances, ways of improving the operations was discovered. The effects of these methods were then tested through the case.
Findings –There are two categories improving efficiency, namely increasing output
or decreasing input. The study also provides examples of ways to do both, and verifies them at the case company. The focus of both methods is a decrease in travel distance which proved to be a reliable way of increasing efficiency.
Workload imbalances can be decreased by sharing workload between the resources. The case shows the result of two different resources with unequal workload and discusses the trade-off between efficiency and workload equality.
Implications – The practical implications of the study is guidelines for how
efficiency can be increased and how workload imbalances can be decreased. The academic implications are verifications of the used theories.
Limitations – This study focuses on a restricted part of the storage process, namely traveling. There are more processes which could be included to further benefit the overall efficiency, these have however been excluded to limit the scope. The study also uses a heuristic approach based on prior research which means that the optimal solution might still be unknown.
Table of Content
Table of content
1
Introduction ... 4
1. BACKGROUND ... 4
1.1 PROBLEM DESCRIPTION ... 5
1.2 PURPOSE & RESEARCH QUESTIONS ... 6
1.3 DELIMITATIONS ... 6 1.4 DISPOSITION ... 7
2
Method ... 8
2.1 STUDY DESIGN ... 8 2.2 CASE STUDY ... 8 2.3 APPROACH ... 9 2.4 DATA COLLECTION ... 10 2.5 QUALITY OF RESEARCH ... 11 2.6 WORK PROCESS ... 123
Theoretical framework ... 13
3.1 CONNECTIONS BETWEEN THEORY AND RESEARCH QUESTIONS... 13
3.2 KPI ... 14 3.3 EFFICIENCY ... 15 3.4 WAREHOUSE LAYOUT ... 15 3.5 ARTICLE PLACEMENT ... 16 3.6 WAREHOUSE OPERATIONS ... 16 3.7 WORKLOAD DISTRIBUTION ... 16 3.8 TRADE-OFF ... 17
4
Empirical study ... 18
4.1 CASE DESCRIPTION ... 184.2 THE CURRENT PROCESS ... 18
4.3 CURRENT PERFORMANCE ... 18
5
Analysis ... 20
Table of Content
5.2 RESEARCH QUESTION 2 ... 20
5.3 RESEARCH QUESTION 3 ... 23
6
Conclusion and Discussion ... 25
6.1 RESULT ... 25
6.2 IMPLICATIONS ... 26
6.3 LIMITATIONS ... 26
6.4 CONCLUSIONS AND RECOMMENDATIONS ... 27
6.5 FUTURE RESEARCH ... 28
7
References ... 29
8
Appendix ... 33
List of figures FIGURE 1- THE CURRENT MATERIAL FLOW. ... 7
FIGURE 2- METHODS AND THEIR CONNECTION TO THE RESEARCH QUESTIONS. ... 8
FIGURE 3- THE STUDIES APPROACH. ... 9
FIGURE 4- TIME SCHEDULE FOR THE WORK PROCESS. ... 12
FIGURE 5- THEORY AND RESEARCH QUESTIONS. ... 13
FIGURE 6- WORK ZONES ... 23
FIGURE 7- WORKLOAD IMBALANCES ... 24
List of tables TABLE 1 - QUALITY PRECAUTIONS IN THE STUDY ... 12
TABLE 2 - REPLENISHMENT PROCESS TIME FOR OPERATORS. ... 19
TABLE 3 - REPLENISHMENT SITUATIONS ... 37
TABLE 4 - ITERMIDIATE DISTANCE ZONE 1 ... 38
Introduction
1 Introduction
In the following chapter the background and purpose of this bachelor paper will be presented. The study was performed through a case study which is presented to allow the reader to comprehend the bachelor paper limitations of the material flow and operations.
1. Background
In the beginning of 20th century the Japanese car industry was underdeveloped compared to the U.S industry. This relation between the markets was true for many categories of the production included production management techniques as well as business management (Ohno, 1988). Despite Japan´s attempts to copy the superior industry, they could never catch up due to different preconditions, in domestic market
and economy (Womack, Jones, & Roos, 1990). In the middle of the 20th century the
industry was so strained that the president of Toyoda stated that it might lead to a total collapse in a few years’ time (Ohno, 1988).
In 1940 it was recognized by Taiichi Ohino that an American operator out produced a Japanese operator by a ratio 9-1. With this background Ohno developed a new production system with the aim to improve efficiency in the Japanese industry. This system would later be known as lean manufacturing. The system was proven to have a great effect after 1940s oil crash which was devastating for Japans industry. Despite the industry’s difficulties, Toyota, who used lean, remained profitable (Ohno, 1988). The validity of this production system was also proven in recent time by Naga & Rambabu (2014), who found that Indian companys who does not work after the principles of lean production have a hard time surviving.
Bernolak (1997) describes the concept off efficiency as a relation between inputs and outputs. He also argues for the importance of efficiency. Not only for a company or a specific operation but also for the entire global prosperity which is a product of the industries productivity. In this paper output is assessed through customer value. According to Law (2009) customer value can be defined as: “A consumer's
assessment of the overall capacity of a product to satisfy his or her needs.”
Ohono (1988) argues the same point as Bernolack (1997). Ohono´s (1988) idea is to reduce waste. By definition does not add any value it must be eliminated (Ohno, 1988). This would reduce the input while maintaining the output of customer value which would lead to a more favorable ratio between the two (Bernolack, 1997). Ohono (1988) defined seven wastes that any manager should seek to reduce in order to increase efficiency. On average 50-70% of a company’s operations can be considered to be waste. Even the best practices can be considered to have up to 30% waste. This does not only lead to less efficiency but also capacity restriction since it limits the overall throughput (Taj & Lismar, 2006).
Two out of the seven wastes are excessive motion and excessive transportation. Both of them can be reduce by optimizing the warehouse layout (Jonsson & Mattson, 2011). Warehouse layout is a well-studied field. Despite this it is commonly accepted that the current approaches contains some weaknesses since every approach contains certain assumptions and can therefore not be described as generic (Castillo & Peters, 2010).
Introduction
1.1 Problem description
The growth of global trade has been one of the most remarkable trends during the last 40 years. Despite the prominent growth, there are no signs of stagnation (Waters, 2010). This brings opportunities for global actors, such as exploitation cheap labor to increases their competitiveness, but also threats in global competition (Scully & Fawcett, 1993). The effects of failure to adapt to the new competition was shown by General motors who went form billions in market Capitalization to bankrupt in just a few month, due to failing logistics (SupplyChainDigest, 2006). This point is also documented by Fredholm (2006) and Lundsen (2012) who seconds that an efficient supply chain is a key component when a business is trying to out preform their competitors.
It is reported that logistics cost, depending on the definition, can be accountable for around 17% of GDP (The International Bank for Reconstruction and Development & The World Bank, 2011). These 17% consists of different categories including warehousing which is highly important to the overall costs (Olayinka, 2010). 55% of the total warehousing cost is considered to derive from order picking, where traveling in most cases is the biggest contributor (de Koster, Le-Duc, & Roodbergen, 2007). However the waste in the picking operation can be reduced in different ways, one way is by improving the warehouse layout (Persson, Johansson, Borman, Blücher, & Alsterman, 2009). Warehouse performance can also be increased by eliminating or decreasing workload imbalances (Kim, Baek, & Jun, 2005). Workload imbalance can lead to unnecessary strain on one operator while another co-worker remains idle (Pyung-Hoi, 2008). This is also one type of waste, namely waste of time on hand or waiting (Ohno, 1988). Workload imbalances can also cause long lead times and lower through put rate (Pyung-Hoi, 2008).
Higher competitiveness in an increasingly global market and the case of General motors, it stands clear that an efficient supply chain is immensely important for any company. This in combination with lacking theories in the subject of workload imbalances (Pyung-Hoi, 2008) and the complex nature of warehouse layout and lack of generic model (Rouwenhorst, Reuter, Stockrahm, van Houtum, Mantel, & Zijm, 1999) makes academic research on waste reduction in these areas an important for the industry as well as fulfilling from an academic perspective.
There are two important concepts that are used in the study. First one is efficiency which according to Law (2009) is “A measure of the ability of an organization to produce the maximum output of acceptable quality with the minimum of time, effort, and other inputs”. The second concept is workload imbalances. Workload is the “Amount of work or number of work units assigned to a particular resource over a given period” (businessdictionary.com). Deriving from this definition, workload imbalance is for the purpose of this paper be defines as: differences in the amount of work or number of work units assigned to a particular resource over a given period.
Introduction
1.2 Purpose & Research questions
The following bachelor papers treat the problem of improving the industry from a scientifically perspective. The study focuses on workload imbalances as well as efficiency. This was done through a case study in the vehicle manufacturing industry. Hence the study’s purpose is to:
Improve the efficiency of warehouse operations as well as to reduce its workload imbalances by altering the warehouse layout and work zones at a storage area.
To fulfill the purpose, the current state has to be investigated. This was used as a baseline for the remaining research questions which concerns improvements.
The first research question aims to set up initial parameters for the study by describing the current process in terms of efficiency and workload imbalances. This was used as a baseline for the coming research questions which concerns improvements. This has led to the first research question which is:
RQ1: What is the current state of the sites efficiency and workload imbalances?
After which improvements were designed and evaluated. The study focuses on efficiency and workload imbalances. This means that the next two research questions deal with both of these aspects. The second research question deals with the first aspect, to find ways of improving the efficiency in warehouse operations by altering the warehouse layout. This has led to a research question which is:
RQ2: How can the warehouse layout be altered to increase efficiency?
The third research question is dealing with the remaining parts of the purpose, namely reduction of workload imbalances, which led to the last and third research question.
RQ3: How can warehouse work zones be altered to reduce workload imbalances?
By addressing one research to finding a baseline and the remaining two to find ways of improving the two areas which was stated in the purpose as efficiency and workload imbalance, the purpose can be fulfilled.
1.3 Delimitations
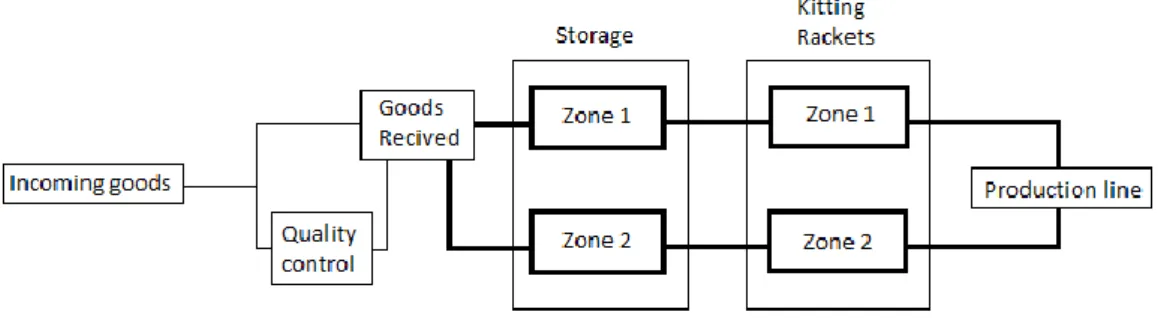
This bachelor paper only treats a restricted part of the sites operations, namely storing and moving goods. The sites material flow is shown in figure 1. The thick lines represent the areas which the bachelor paper intends to treat. As illustrated in Figure 1 the bachelor paper treat processes after goods received with the aspiration of limiting the scope and thereby increasing the focus to the purpose. The material flow is studied until it reaches the production line. The last part of the operations of which the bachelor paper aims to treat, where goods are moved from kitting rackets to production line is only studied with the purpose of evaluating the value produced by the focal process. Hence that part of the process gets a highly limited coverage. The bachelor paper also neglects infrequent material flows and instead focus on the main process.
Introduction
Figure 1- The current material flow.
1.4 Disposition
The bachelor paper begins with an introduction, through a background problem description and purpose. In chapter two the research process is presented in regards to the methods that were used as well which measures were taken to increase the study´s validity as well as reliability. Chapter three is presenting relevant theories used for the study. Chapter four presents the study’s empiricisms and as well as the current stated and processes in the case company. The data is later analyzed in the following chapter to evaluate the potential effects as well as provide a connection to the theory. Last and final chapter is the conclusions and discussion which summarizes the result according to the research questions which fulfill the purpose. Furthermore the report also contains some appendixes to compliment the work and a bibliography.
Method
2 Method
In this chapter the methods is discussed and explained. The overall research process is alsoe presented along with a discussion about the research quality.
2.1 Study design
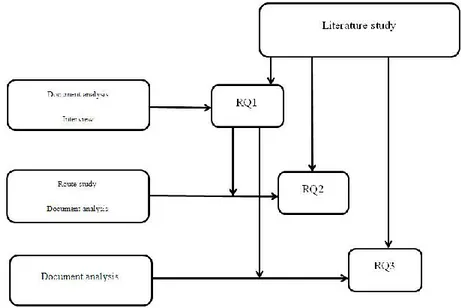
When deciding the method for approaching the subject, the nature of the research question should be considered. Questions related to how something can be done, can be approached by a case study or studying historical data (Yin, 2007). Figure 2 shows the methods used and which research question the address. The literature study was used to answer all the research questions. Figure 2 also shows the connection s between research question 1 and the remaining research questions. To show an improvement a benchmark has to be established. Furthermore the figure shows how unique sets of methods are combined to answer each research question. For the first research question this set consisted of document analysis and interview, for the second route study and document analysis and for the third document analysis.
Figure 2- Methods and their connection to the research questions.
2.2 Case study
The purpose is fulfilled through a descriptive case study. By using this approach the expectation is that the result provides an up-to-date review of the current process. The usage of case study as a methodology is further motivated by the structure of the purpose and research questions. Since the questions are related to how something can be done case description is an excellent fit (Yin, 2007) it also allows a relative deep analysis into the addressed subjects (Bell, 2005). This paper is single case study. This choice was made since there are some established researches in the field which puts the study into context, so that existing theories can be tested verified and developed. All of the previously mentioned aspirations can be fulfilled by a single case study this however, risks the extern reliability of the study (Yin, 2007) . This is further discussed in the coming chapter.
To fulfill the entire purpose the case study needs multiple analytic units, namely one unit of workload imbalances and the second one in warehouse layout and article
Method
placement. This was an important factor in the choice of case company. The company had to be big enough to include the all of the aspects of the research purpose and research questions, furthermore the company had to work with lean manufacturing (or equivalent) as their production system to allow that aspect into the report.
2.3 Approach
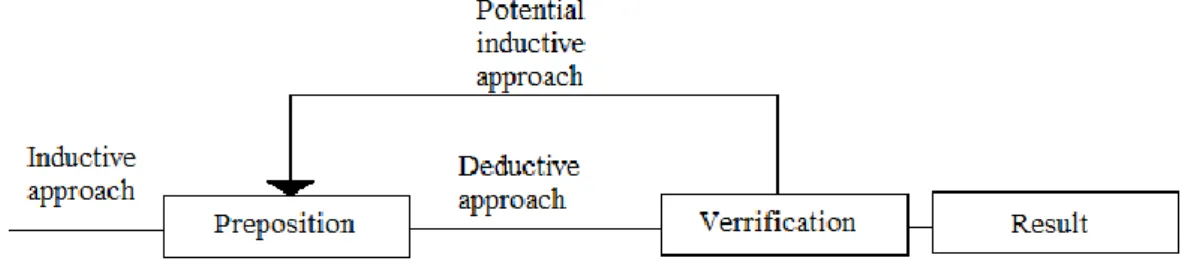
The bachelor paper contains approaches that can be considered to be inductive as well as deductive. The investigation of the current process as well as exploring ways of improving it had the characteristics of an inductive approach. This approach can be seen as inductive since the aim was to find ways of using theories. However the theories are undecided. The results were then used in combination with deductive methods to verify the improvements. This means that the study is adjunctive. If the deductive approach is contradicting the inductive approach, the case would once again be approached in an inductive manner to investigate why the result was not as expected. This would once again lead to a preposition which would be verified by a deductive approach. This process would be repeated until satisfying results are reached. This process is illustrated in Figure 3. Figure 3- The studies approach
Figure 3- The studies approach.
Inductive approach
The initial approach aims to map the current material flow. This was done through an interview to access basic as well as deeper knowledge of the process. This information treats perceived problems and some history of the site and company. The interview had a low degree of standard (Patel & Davidson 2011).
To allow the documentation of change the current state has to be documented. This is done through interviews and document analysis. The current state is described through the material flow and through key performance indicators (KPI). These KPIs is chosen to ensure that differences between the current and future state of production can be documented.
The literature study provided different ways to organize a warehouse. One category of such is the heuristic methods (Wenrong, McFarlane, Giannikas, & Zhang, 2015) which, thanks to their simplicity are the most common in today’s industry (de Koster, Le-Duc, & Roodbergen, 2007). Its popularity is the reason for using the same method in the current case. In this category there are a number of principles that can be used. This means that the most appropriate ones have to be singled out.
The framework is later be analyzed and used as a guideline for the heuristic method, thereby provide some core principles for the proposed layout. This is also provided
Method
the bachelor paper with a connection to the academic field. Next step was to apply the principles in the case. This created the new warehouse layout.
Deductive approach
The new layout was evaluated through comparison of KPI with the present situation to analyze the effects of the changes. This analysis documents the success rate of the new layout. Thereby verify the principles which it is built upon. The effects were also evaluated by key personal at the focal company. The first research question was answered by establishing and measure KPIs. The KPIs was later used in compression between current state as well as improved state. The KPIs was then be complimented with qualitative data from interviews. The data was used for the analysis and lead to conclusions.
2.4 Data collection
The study consisted of a number of different methods related to data collection. These methods were used in collaboration through source triangulation to improve the study’s quality. The remaining section of chapter 2.4 is devoted to presenting these methods and their role in the data collection.
Document analysis
The needed information regarding the case in question is mainly extracted from documents provided through the case company. This information is article information, their usage and their demand. This information was used to create the improved warehouse layout. Information regarding workload in the different work queues was also provided. Naturally the main purpose of this information is to nullify the workload imbalances. There is also information regarding the current processes which was extracted though the document analysis.
Literature study
Due to the relative broad scope of the purpose a number of different fields have to be accounted for to provide a sufficient grasp of the subjects at hand. This information was mainly found through articles, journals and books. The gathered framework was later used for developing the new the warehouse system and reorganizing the warehouse by providing guidelines. The literature framework was also used for analyzes of the new changes. Articles were sourced from Primo and Google scholar. The breadth prohibits the naming of every key word but some of them was: KPI, efficiency, warehouse layout, article placement, family grouping, workload imbalances and more.
Interview
There were two types of interviews in the study. First type was only performed once. It was performed for the inductive approach. The focus was mapping the process. These interviews were performed throughout the process.
The purpose of the interviews was to evaluate the effects of the improvement measures and was conducted with responsible personal for the focal process. The interviews had high structure to minimize the risk of implicating questions from the interviewer. The standard was low to allowed the interweave to answer more freely (Patel & Davidson 2011).
Method
Route study
There was also a study of routing in the picking area to provide data on the output increase of customer value. The samples were gathered through stratified sampling. There was one sample from each usage point which created a representative sample (Patel & Davidsson, 2011). The orders was then be used to compare the present layout and the proposed layout through a routing study.
2.5 Quality of research
Quality may have different meanings depending on the nature of the work. In a mainly quantitative study such as this, the difference between reliability and validity tend to be less than in a qualitative study (Patel & Davidsson, 2011). Hence, for further discussion of the quantitative parts of the study validity and reliability from now on be referred to as authenticity. The authenticity of a quantitative study is often highly depended on the quality of the data (Patel & Davidsson, 2011). The data is dependent on its origin. In this case origin is a single case study, this can lead to a focus on the specific case instead of the general phenomenon (Yin, 2007). This means that there is risk that the data may not become reliable. The data is extracted from the case. The data on assignments have been extracted from the IT system of the case company. The data on time was however extracted from a time study and does not include the same sized sample size.
There is also a qualitative part of the process. In these parts reliability and validity is separate (Patel & Davidsson, 2011) and is treated as such. Continuous interviews bias may become a factor since both the interviewer and the interviewee have roles that may benefit from the result. To combat this interview material was scanned for leading question which decreases the reliability. There was an independent interviewer present to prevent bias.
Figure 3- The studies approachFigure 3 shows the approach. This approach has a build in reliability control. By using the deductive approach after the inductive approach there was a verification of the recommendation to increase the functionality of the process. By using the theories and analyze them through the case it is expected that the reliability would increase. Table 1 summarizes the most important actions taken to provide higher quality. The literature has in every case possible been chosen from recent studies. This increase the validity of the study which is important since low validity is a risk when performing a single case study (Yin, 2007). Achieving high validity to a general case is however not possible through a case study, no matter the sample size or depth of the analysis. Instead a researcher should focus on relating the result to the theory (Yin, 2007). To increase the reliability of the interviews an independent observer participated in the interviews regarding the expected results of the changes. By performing an analysis of the process statistics acquired by the document analysis and combining this result with the result of the interview a source triangulation occurs. This increased the reliability of the study (Patel & Davidsson, 2011).
Method
Table 1-Quality precautions in the study
Quality precaution Explanation
Literature study Using up to date theories Presents of independent
interviewer
The interviews include the presents of an independent interviewer to avoid leading questions.
Deductive approach The result found in literature study gets verified by the analysis Triangle sourcing Using different methods of to reach the result
2.6 Work process
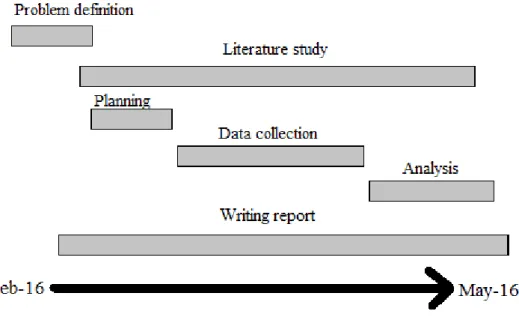
The work was performed during the spring of 2016 in a production facility in Bangkok, Thailand. The process can be split in sex different categories: problem definition, literature study, planning, data collection, analysis and writing report spanned between February and May. Problem definition was what was previously mentioned as an inductive approach. It includes finding problem in the production in the case. To solve the problem a literature study began and it proceeded during the majority of the remaining work to continuously adapt and elaborate the search after the findings. A planning stage was initiated shortly after the literature study, the result of which can be read previously in this chapter. Next phase was data collection which does not need much further introduction. Following this the analysis began. It was used to connect theory and the data to conclude the bachelor paper. Parallel to the previous processes writing of this report took place. This work process is illustrated in Figure 4.
Theoretical framework
3 Theoretical framework
In the following chapter the relevant theories are presented according to their intended research question. The theories are related to efficiency, workload imbalance, warehousing as well as theories to accurate measure performance.
3.1 Connections between theory and research questions
In the coming chapter the theoretical framework is presented. The theories regarding KPI are used in all of the research questions to provide an accurate picture of the current state as well as the state after the improvements. For the second and third research questions KPI is used to evaluate the state after the proposed changes.
In order to address the second and third research question relevant theories is presented for each aspect of the previously stated questions. The theories are used to direct and manage the changes. This is illustrated in Figure 5 where theories are paired together with the research questions.
To improve efficiency it is important to first provide the reader with the concept about efficiency, which is applied to the following three categorize warehouse, layout article placement and warehouse operation. These three categorize is used to provide accurate ways of improving the efficiency in the case company.
Workload distribution is used in order to accurately evaluate the demand placed on the company’s resources. Trade-off is then used to accurately dimension the actions taken to even out the workload between the resources.
Empirical study
To evaluate the current performance, quantitative KPIs can be used, these are easily comparable and they should be formulated in such a way that they correspond with the overall goals of the operations.
Increasing efficiency can be done by changing the ratio between input and output. Input can be reduced through minimizing the labor requirement of a task through transportation reduction. Output can be increased by providing additional value to the customer.
Workload distribution is often described through the bell curve. The workload varies which is a core constituent to workload imbalances which leads to waste in the form of waiting but also longer lead times and less assignment speed. By changing an attribute of the operations another might be affected. When there is a negative correlation between two attributes, a trade-off appears. By combining the parameters so that they correspond with company´s requirements an optimal level can be reached within the current method of production.
3.2 KPI
KPIs are quantifiable measurements of critical success factors for a company. KPI should be designed to measure success according to the company’s overall goals (Nimalathasan, 2009) so that employees cause them to make well informed and better decisions. The usage of KPI is so great that many companies are required by law to report their performance through KPIs (Cavalluzzo & Ittner, 1999). When designing KPIs it is important that a company define success so that the KPIs can be defined thereafter. The KPI should not be designed dependent on available data, but rather dependent on the intended result. So to develop the right measurement the impact of the performance should be studied. There are also qualitative KPIs, however they have the downside that they are harder to compare over time since they cannot be quantified (Mangan, Lalwani, & Buther, 2008).
Another thing that interferes with measuring progress is the implementation dip which is a dip in productivity after a positive change is performed. This dip is however not permanent and after some time the organization can benefit from the change through higher productivity (Fullan, 2007).
Eckerson (2007) explains the difference between a metric and KPI through strategic value. The idea is that KPIs always have to have a strategic value. He also posed ten characteristics of a good KPI. These are:
KPIs Reflect Strategic Value Drivers
KPIs Are Defined by “Executives”
KPIs Cascade throughout an Organization
KPIs Are Based on Valid Data
KPIs Are Always Relevant
KPIs Must Be Easy to Comprehend
KPIs Are Always Relevant
KPIs Provide Context
KPIs Empower Users
Empirical study
Eckerson (2007) concludes that the importance of the KPI is the usage. KPI should be a support for the user. It should therefore be designed to allow good support so that the users can direct their effort in line with the overall company goal.
3.3 Efficiency
The core concept of efficiency is the ratio between input and output. This means that a decrease in input with same output can be seen as a gain in efficiency (Bernolack, 1997). Input can be seen as a combination between work and waste. Waste is work that does not add any value to the customer. Therefore it should be reduced to increase efficiency (Ohno, 1988). Another definition of waste is: anything other than minimum amount of equipment, materials, parts, and working time that are absolutely essential to production” (Taj & Lismar, 2006). There are seven different main categories of waste including (Ohno, 1988).
• Waste of overproduction
• Waste of time on hand or waiting • Waste in transportation
• Waste of processing itself • Waste of stock on hand • Waste of movement
• Waste of making defective products
The waste of transport is explained by Persson, Johansson, Borman, Blücher, & Alsterman (2009) who claims that it is not necessarily all transports that should be included in this category. Some transport, the ones that the customers are willing to pay for should instead be considered to be work, this is also strengthened by Tai and Berro (2006) Johansson, Blücher, & Alsterman, (2009) also claims that in most cases waste through transportation is attributed to internal transportation which often times is a product of poor layout. On average 50-70% of a company’s operations can be considered to be waste. Even the best practices can be considered to have up to 30% waste (Taj & Lismar, 2006). Commonly a storage facility layout problem focuses on the minimizing the material transport as a way of evaluate the facility’s efficiency (Castillo & Peters, 2010).
Efficiency can also be increased by increasing output while maintaining the same input (Bernolack, 1997). This this also derives from Law´s (2009) definition of efficiency which is used in this bachelor paper.
Customer value is the core constituent of business (Ulaga, 2011). Customer value assessment has traditionally been focused on quality and functionality of the product (Payne and Holt, 2001). Evaluating the customer value has three main problems. These are evaluating value in complex products, keeping the measurement relevant and often fail in keeping a long-term focus. Furthermore a company that wishes to use customer value should be aware that are both qualitative and quantitative parameters that influence the customers perceived value (Keränen & Jalkala, 2014).
3.4 Warehouse layout
Picking area layout is a set of decisions that impacts the overall performance of the warehouse (Hwang, Oh, & Lee, 2004). Finding the right layout is important for
order-Empirical study
2014). Despite the large impact of warehouse layout no systematic approach can be argued as superior in a general case due to the complexity and many trade-offs of warehouse layout (Rouwenhorst, Reuter, Stockrahm, van Houtum, Mantel, & Zijm, 1999). An example of this trade-off is the relation between replenishment efficiency, which is generally increased by organising the warehouse to a greater extent however this typically leads to decreased storage capacity (Malmborg, 1996).
3.5 Article placement
In managing article placement the articles need to be categorized. By using Pateros principle a small number of parts can be assigned to a high number of parts which in turn allows these products to be placed in favourable locations, this is known as sorting through frequency and is commonly done by a ABC classification (Mattson, 2003a) (Lundsen, 2012). Articles can also be sorted by:
Family-grouping
Product similarities
Product size (Lundsen, 2012)
Family grouping is when products that are frequently ordered together are grouped together in the warehouse (Brynzér & Johansson, 1996). This can also be combined with other systems of organizing products including ABC classification (de Koster, Le-Duc, & Roodbergen, 2007). Family grouping can significantly improve the efficiency of the material flow. However, splitting all products into family groups may prove to be impractical (Castillo & Peters, 2010).
3.6 Warehouse operations
Warehousing activates can mean many different things, some typical tings are reviving, storing, sorting goods, picking orders and more. Of these, picking orders should be in focus. The reasoning behind this is that it typically is responsible for a high portion of the total warehouse expenses. This means that ineffective pick would have severe consequences. As much as an average 55% of total warehouse expenses are estimated to be attributed by picking. For an order picker half the time is generally attributed to traveling which directly correlates with travel distance (de Koster, Le-Duc, & Roodbergen, 2007).
3.7 Workload distribution
When there is different work zones which operators are bound to, human factors and day to day differences are going to lead to workload imbalances (Pyung-Hoi, 2008). Workload imbalances lead to long assignment queues for the strained unit. By reducing workload imbalances the overall capacity and performance can be increased. One way of reducing the workload is to allow units to share some of the workload, distributing assignments to the unit with the lesser workload (Kim, Baek, & Jun, 2005) (Bard, Shtub, & Joshi, 1994). Pyung-Hoi (2008) discusses how shared workload leads to shorter lead times even though assignment speed increases. As a disadvantage he mentions that the operator have to act in a bigger area. This means that the operators need more knowledge of the articles (Pyung-Hoi, 2008).
Empirical study
normal distribution in a case one can study the distribution of data. If the data follows normal deviation about 68% of all the values should be within one standard deviation of the average value. Similar ratios are true for two and three standard deviation as well. The shares for these are 95% respective 99%. If these critters are fulfilled assumptions can be made that the population can be described through the bell curve (Mattson, 2003b).
Even if the data does not follow normal distribution the set of data tend to approach standard deviation. This however demands the pre-condition that the elements of data should be independent. This phenomenon is known as central limit thorem (Nicholson, 2014).
3.8 Trade-off
According to Black, Hashimzade & Myles (2013) trade-off is: “the requirement that some of one good or one objective has to be given up to obtain more of another.” This situation is common in warehousing were different performance objectives are conflicting with each other over a broad range of feasible warehouse designs (Rouwenhorst, Reuter, Stockrahm, van Houtum, Mantel, & Zijm, 1999). Even though there are some schools that are trying to divert from this type of thinking they cannot fully explain some parameters interdependence. However two performance indicators can be increased by using new methods to perform a task, thus breaking the circle. However it does not change the interdependent nature of the objectives only expand the barrier of possible performances. By choosing an appropriate position on the barrier a company can change the nature of their operations and thereby give different characteristics to the finished product and thereby optimize their business (Slack & Lewis, 2011).
Empirical study
4 Empirical study
The following chapter presents the case company in regards to its process and relevant empirics.
4.1 Case description
The site has recently been rebuilt due to a change in production from producing cars to trucks and buses. It is a part of a cooperation that uses Volvo production system (VPS). This system is closely related to lean production with a different approach to the formality of the organization structure (Sandberg, 1995). The site manufactures trucks and buses the studied flow is restricted to trucks. The site manufactures an average of twelve trucks a day. The trucks are manufactured with the basis in two different models, which is adapted to the customer’s specific requirements.
4.2 The current process
The current process begins with 90% of the pallets being unloaded to the goods receiving area (GR) while the remaining pallets are moved to a separate area for quality control. After the quality control the pallets re-join the main flow at GR. The pallets are later moved to storage where they are divided in two zones. This is where the case area begins. In the storage the pallets are sorted after their height and width after which they are assigned a random location in their respective zone. Next station for the pallets is the kitting rackets. Pallets are moved there whenever the quantity at a kitting rackets runs low. When the quantity runs low, an assignment is given to the replenishment operator. There are two assignment types. First and most frequent type is a normal assignment which signifies a future need of replenishment. Second assignment type is urgent assignment. This type signifies an immediate need for an article.
The kitting rackets contains designated spots for every part number which is specific for every article type. In the kitting rackets each part is picked individually and moved to the assembly line. The study process end when the parts reaches the assembly line, thereby limiting the case study to two operations, store pallets and move them to kitting rack. This is where the focal of the bachelor paper ends. However the picking process is also studied in an attempt to avoid sub optimizations and increase efficiency through a higher output.
Figure 1 show the flow as described in the previously paragraph.
4.3 Current performance
Average travel distance for kitting operators was collected to study how customer value from replenishment can be increased by placing pallets at optimal positions to reduce travel distance for operators further down in the material flow. The travel distance can be found in Appendix 2 where one choice random order from each usage point have been studied and added together.
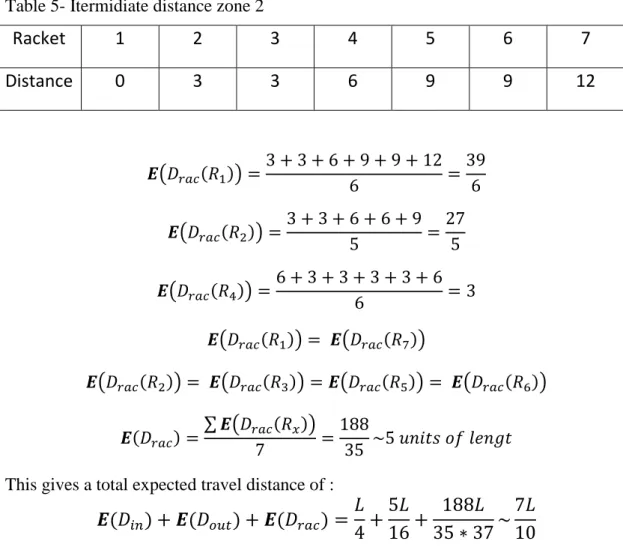
Average travel distance for replenishment operators was collected through a mathematical analysis of the case. The analysis is available in appendix 4. Even though most transportation can be seen as waste some is still be necessary in the current system. Average travel distance is a KPI that helps with waste reduction regarding traveling. The mathematical analysis is based on equal demand of pallets.
Empirical study
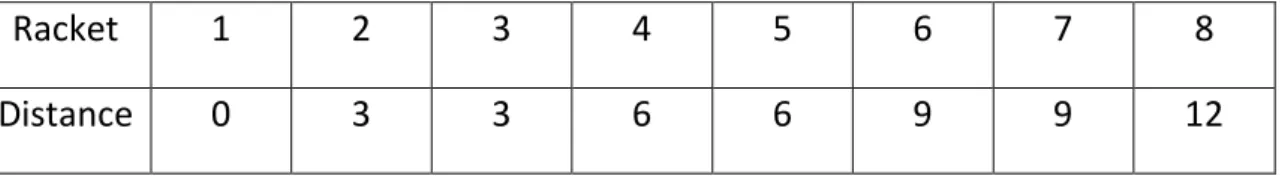
In the case there are work zones two zones. Both of these Zones can be approximated as square. The zones contain eight parallel rackets each which was used in the analysis to calculate theoretical travel distance. The work zones split the storage area in two. The replenishment assignments that are generated in the storage are split into the work zones according to the location of the position in need of replenishment.
To illustrate case also revealed how much time a replenishment operator spends on average to complete the assignments. The average time of traveling between storage location and kitting location is about four minutes out of the total eleven minutes which is the standard time for each assignment. A quick glance of Table 2 – Replenishment process time for operators.Table 2 and appendix 3 might reveal the problems of the current situation to an attentive reader. The problem is that the demand is higher than the capacity of the two operators. This is met by helping the replenishment operators with “clean to kitting location” by assigning additional resources. For clarification, this study focuses on average travel time “Fill part to kitting location” which gives the operator more time to complete a bigger portion of the task without help of additional resources.
Table 2 illustrates the time spent on performing one assignment for an operator. The time is first divided into two categories. Part to kitting location is the process of receiving an assignment and getting the pallet to its kitting location. Kitting location to clean is removing the empty pallet from the kitting location to an area where pallets and other used handling material are placed. The standard time for these processes is STD time, which can be seen in the table. The process which the intended improvements effect is travel time of “part to kitting location”. For that reason the standard time for this category is split into average travel time and average non travel time.
Table 2 – Replenishment process time for operators.
To find the frequency of workload imbalances information on the workloads in the respective zones were used. This statistic is available in Appendix 3 shows the demand extracted from one week of working.
Part to kitting location
Round Time (Min)
AVG travel time 4
AVG non travel time 0.4
STD time 4.40
Kitting location to clean
STD time 6.6
Analysis
5 Analysis
In the following chapter the empirics is combined with the theoretical framework in an analysis in respect to the research questions.
5.1 Research question 1
In chapter Error! Reference source not found.Error! Reference source not found. it is described how a KPI should be chosen. It is stated that the KPI should be designed to measure the intended result and overall goals. In this case: improved efficiency. Since efficiency depends on both input and output (Bernolack, 1997) both of these was measured. Chosen KPIs for input is theoretical capacity for replenishment operators. The number of operators remains the same during the case which means that improved capacity leads to less input for each assignment and thereby higher efficiency. A number of different aspects are studied. These are theoretical number of urgent orders, theoretical workload imbalance and a route study for kitting operators. Analysis of workload imbalances and measures the stability of the process which leads to higher customer value and output. Route study for kitting operators shows the effects replenishment has on the downstream efficiency. Increased downstream efficiency means a higher output and thereby higher efficiency in the focal area. For time being there are five operators in Zone 1 and six operators in Zone 2. In the same zones there are two replenishment operators.
The effects are measured through the following KPI:
Average travel distance for kitting operators.
Average travel distance for replenishment operators.
Frequency of workload imbalances.
The outcome of these KPIs is documented in chapter 184.3 and was therefore not be further evaluated in this chapter.
5.2 Research question 2
Efficiency can be increased by either increase of output or a decrease of input. Chapter 5.2 is dedicated to discuss these separately.
5.2.1 Increase output
Customer value can be increase through adapting the focal process to the next process in the production chain. By providing savings in the downstream process customer value is increased by the same amount.
The bulk of the work is put into picking operation (de Koster, Le-Duc, & Roodbergen, 2007), which in this case is made up by kitting the bachelor paper focuses on how the studied area can benefit the kitting operations. By increasing the customer value generated to kitting operations, the warehouse efficiency can increase. This means that the efficiency in the study is improved by increasing the output.
The efficiency of the kitting operations was increased by improving the picking routes which reduces the travel distance and thereby the waste. It was done by dividing the articles in different families and locate the them in proximity to each other. Every part has one or multiple usage point in the production line, although most articles only
Analysis
have one. Every assignment was generated from usage points which make the product families relative clear cut. This limit the problems discusses by Castillo & Peters (2010). In the cases where some articles have multiple usage points, and therefore belong to two different families, these product families get linked together in the final layout. Another way of solving multiple usage point is to assign two kitting locations to the article.
Even though the products have slightly different destinations they will for the sake of this project have a theoretical common destination. Due to the process relative small difference in physical destination this approximation was considered to be insignificant to the overall result. Since the usage points have a different number of articles and therefore occupy different amount of space it was beneficial for the kitting operator´s overall travel distance to locate the smaller product families closer to the common destination, thus allowing a bigger number of orders to be carried out with lesser travel distance. This rests on the same basic as ABC classification namely providing favorable locations for frequently picked articles. However because of different pallet frames and the preexisting warehouse layout the possibilities of doing this were limited. Therefore the smaller product families are only be placed close to the destination whenever it was possible. The complete layout is available in
Appendix 1-Kitting layout
where family groups are allocated in the kittingrackets.
The new kitting layout was compared with the old kitting layout. This was done by comparing the travel distances in the kitting layouts. This comparison can be seen in Appendix 2 and shows that the average travel distance was reduced by 21% in Zone 1 and 41% in Zone 2 making the average benefit of 31%.
Kitting locations can be organized through family grouping (Lundsen, 2012) according to Appendix 1-Kitting layout. In the current case it was found that the travel distance for the kitting operator could be cut by approximately 31% which correlates with the findings of Castillo & Peters (2010) who states that family grouping can increase the efficiency of the flow. Bernolack (1997) argues for efficiency as a ratio between input and output. In this case the input is labor. Labor input is measured by combined time spent for the operators. Since generally half the time spent can be attributed to traveling (de Koster, Le-Duc, & Roodbergen, 2007) . By limiting traveling the amount of waste can be reduced so that the operator can spend a higher portion of the time with value adding activities. This means that the produced work can be affected by the family grouping. Since travel distance and travel time is proportionate (de Koster, Le-Duc, & Roodbergen, 2007) reducing travel distance by a set proportion is likely to reduce the travel time to by the same proportion. Combining this logic with “Appendix 2” kitting operators can spend 21% less time traveling in Zone 1 and 41% less time in Zone 2. This gives an average of time saving of 31% in traveling. Half the total time is traveling which means that the time savings is 15.5% of the total time.
There are five kitting operators in Zone 1 and six in Zone 2. In the same zones there are two replenishment operators, one in each zone which were the same findings as de Koster, Le-Duc & Roodbergen (2007), that picking is the most labor intense process in warehousing. This means that adapting the replenishment process to the kitting
Analysis
There were eleven operators in kitting and two in replenishment. This meant that customer value generated by the less labor intense process is amplified by its impact on every operator in the next process. Saving a fixed number of work hours is more prominent in a process with fewer wok hours than in one with more work hours. Since then input is the same in both process, namely work hours, the waste reduction can be compared directly by calculate the overall impact on the organization.
This meant that the customer value from replenishment can be increased by 85% by adapting the process to kitting operations and thereby increasing the efficiency by the same amount.
5.2.2 Decreased input
The distance between kitting locations and warehouse location can also be reduced. This was done by changing the current system of random warehouse location in the zones to a system where pallets are placed at the closest possible position possible to their intended kitting location. If the right area was unavailable for the pallets from GR, the pallets can be transported to another area in proximity the one that was initially intended.
From the document analysis it was found that the standard time for a replenishment operator was eleven minute per pallet. Out of these four minutes was reserved for kitting operator to travel between storage kitting location and kitting location. The complete distribution of time is described in Table 2 – Replenishment process time for operators.
Appendix 4 show that organizing the pallets in storage according to their future kitting location, significantly reduce the travel distance. The current or old system leads to an expected travel distance between pallets of 0,63L compared to the 0,33L of the new system. This leads to a decreased travel distance of
. The travel
distance that was reduced can be seen as waste in the current system Ohno´s (1988) deffenition. This however begs the question why the waste cannot be reduced more. Even the storage is 100% waste according to Ohno (1988). The necessity of storage is intuitive in the case as described in chapter Error! Reference source not found. due to deviations in the process such as demand and delivery deviations. There is however a case to be made that only kitting locations should be enough. This would however demand a big storage area which is not only expensive but also leads to impractical kitting layout and long travel distances for kitting operators. This reasoning justifies the use of storage to counteract the deviations in the process.
Travel distance in the new system could be shortened further by split the alleys in the smaller sections and limit the storage to each of these regions in respect to the pallets in kitting. Even though this could lead to decreased travel distance it would also lead to lower capacity of storage. The storage would decrease in capacity since the zones would make the storage less versatile. This creates a trade-off situation.
There is also an idea that that storage locations could be prioritized to be as close to the kitting location as possible. This would not create the same trade-off as previously
Analysis
mentioned. Instead it would break the correlation which according to Slack & Lewis (2011) is possible by changing the method of the process. The usage of this method is however not possible in the case without changing the technology system.
The travel distance was reduced by 48% in the new replenishment setup. As previously discussed there is a direct correlation between travel distance and travel time. Table 2 – illustrates the time distribution of replenishment operators. It shows that 4/11 minutes is attributed to the travel which is affected by the new replenishment
setup. It means that
of the input labor was reduced in the new
system.
5.3 Research question 3
The current process generated assignments to two different zones as illustrated in Figure 1. The layout of these zones is presented from a top view in Error! Not a
valid bookmark self-reference.. The operators work exclusively in either of two
zones. Day to day variations creates workload imbalances in these zones (Pyung-Hoi, 2008). The workloads followed the bell curve according to the parameters set by Mattson (2003b). To even out the workload a third zone was created which generates assignments to both Zone 1 and Zone 2. In Error! Not a valid bookmark
self-reference. this third zone illustrated with a circle. This limits each operators work
area while nullify workload imbalances. The zone was sized and located so that the effect on the workload gets maximized while limiting the impact from longer transports in derived from extending the work zones.
From the data collection it was however found that one of the zones had a significant higher amount of workload, for future reference this zone will be called “zone 2” while the less stressed zone will be called zone 1. The buffer zone will be referenced as Zone B. This means that the highest amount of workload was found in the same zone throughout the data. Sharing assignments from zone 1 will therefore be rendered useless. Through an analysis of the workload data it was concluded that the zones followed the characteristics of standard deviation (Mattson, 2003b). The analysis also shows that the standard deviation was proportional to the average amount of assignments. To document the theoretical results and decided the size of zone B the effects of the system is calculated. The effects are documented by studying the proportion of the successful attempts. Result was generated by studying the workload Figure 6- Work zones
Conclusion and Discussion
Equality is achieved when:
( ) ( ) ( ) ( )
X represents the size of zone B while P is the probability that the statement is true.
The character of the subscript represents the work zone. For example is the average
number of assignments in zone 1 while is the standard deviation in zone 2.
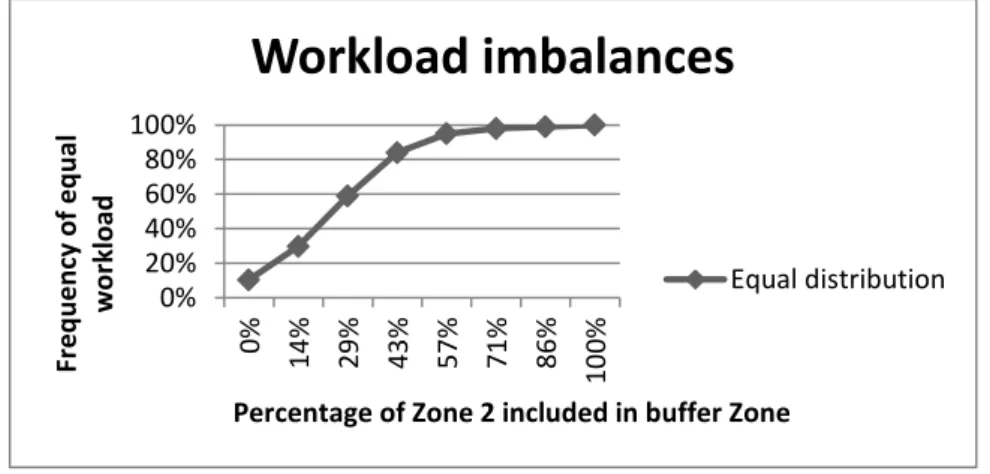
Zone 2, currently consists of seven different rackets, which all includes about 40 kitting rackets with a warring number of split numbers of split rackets for small pallets as well as some combined rackets for larger pallets. By increasing the size of zone B by one racket at a time and calculate the proportion of successful attempts the effects of the buffer zones are documented. The proportion is illustrated in Figure 7. The Y-axis shows the proportion of successful attempts while the X-axis the percentage of zone two that is included in zone B.
Figure 7- Workload imbalances
Workload imbalances can be decreased by increasing the workload buffer. However workload buffer also leads to longer traveling distances. This creates a trade-off. To achieve the best possible result with the current resources it is imperative to choose the right number off rackets to reduce the workload imbalances to the greatest possible extent while increasing the travel distances as little as possible. This because both of these can be considered as two different types of waste and should therefore be eliminated (Ohno, 1988). According to Figure 7 the increasing effects of the buffer zone plateaus after about 50% which means three to four rackets in the case, rendering a bigger buffer zone inefficient since it still increase the travel distance while not contributing to lesser workload imbalance in the same amount. The correlation between increasing travel distance and bigger work zone is proven in chapter Error!
Reference source not found.. A relation like the one between travel distance and
reduced workload imbalances is known as a trade-off situation where is important for the overall performance to find a solution where a balance between the two parameters find the optimal solution (Slack & Lewis, 2011).
It is also imperative to point out that the workload imbalances is less in the cases where workload imbalances are smaller when they occur. This further stresses the positive effects of a buffer zone but it also lessens the need for a high number of
0% 20% 40% 60% 80% 100% 0% 14% 29% 43% 57% 71% 86% 10 0% Fr eq u en cy of e q u al wo rkl o ad
Percentage of Zone 2 included in buffer Zone
Workload imbalances
Conclusion and Discussion
rackets in the buffer zone. This makes three rackets a sufficient number for the work zones.
6 Conclusion and Discussion
In this final chapter the results is presented and discussed. This also leads to the answering of the research questions presented in the first chapter. The author also provides proposals for future research.
6.1 Result
The study aimed to increase efficiency and decrease workload distribution in a warehouse situation. The result in respect to efficacy is presented through aspects of input and output. The aspects can be combined without interfering with each other in the specific case. This might not be possible in the generic case due to different circumstances. Furthermore customer value can have a different implication which means that a generic situation might deviate from the case. The case gives a result of 17% decrease in input and 85% increased output. Both of these efficiency parameters are achieved by family grouping. This is the dominant tool to improve efficiency used in the case. Even grouping pallets in storage, as described in chapter 5.2 can be argued as a sort of family grouping. The families being parts that are used in the aisle.
The high increase of output might appear unrealistic. Therefore a discussion on the suitability of customer value under the present pretenses as an output is appropriate. In the case it could be argued that savings due to kitting location configurations should be attributed to input decrease in kitting process rather than an increase in customer value for the previous process. This would lead to a result which would not be amplified to the same degree as the current result displays. However the amplified result gives a couple of interesting implications, such as the importance of optimize the right processes at the company hence avoiding sub optimizations. By focusing on the processes with high input and adapting other processes after it a company can make big overall gains instead of focusing on each process as a separate unit. This is demonstrated in the case and chapter 205.2.1.
When studding waste in the production on average 50-70% of a company’s operations can be considered to be waste (Taj & Lismar, 2006). This means that reducing the waste by 17% is more than possible. It even begs the question why the layout could not reduce the overall labor more significantly. Of course the process contains other activities than traveling which could also be improved. Since it is hard to evaluate what is waste in the current process it also becomes harder to evaluate the effects of waste reduction. There can be no optimal process due to human error and continuous improvement in methods of production. This means that the importance of waste is relative improves rather than avoiding waste all together which is not be possible in an ever changing world.
Workload imbalances can be reduced in several ways. This case has focused on of sharing workload between two resources. Figure 7 shows how the frequency of workload imbalances can be reduced progressively b sharing a portion of the workload. However it does not show the magnitudes of the imbalances. This is also
Conclusion and Discussion
on the improvement itself. Still the trends are clear and concur with the expected result.
6.2 Implications
The implications of the bachelor paper are suggestions for how a production can be improved in regards to efficiency or workload imbalances. It presents the effects of family grouping in a way that can be replicated at any similar company, even though the effects cannot be guaranteed, it also shows how the effects can be evaluated which can be used at any company in a similar situation. The bachelor paper also illustrates an example on how products can be grouped through Appendix 1.
The bachelor paper also provides a basis for how workload between two resources with similar capabilities can be distributed by sharing workload. It also demonstrates the effect over time. It also includes a discussion about trade-off which can be useful for anyone trying to balance the effects of workload imbalance and efficiency.
6.3 Limitations
The usage of this method of developing a buffer zone based on the precondition that the workload is equally distributed throughout the rackets. If this is not the case the actual result can be skewed with the workload. However, the layout is design without consideration to workload and the independency of each pallet derives from their individual quantity and individual demand. This means that the demand can be approximated through the central limit theorem (Nicholson, 2014) and presumed to approximately equal. Despite the basis of central limit theorem it is still approximations and the theoretical is therefore deviant from the practical result.
The he biggest problem related to the study’s quality which is its lack of testing in real world situations. However testing might be lead to a misleading result due to the implementation dip (Fullan, 2007). It might still be useful as source triangulation. Time limitations hindered testing, which is the reason the study mainly focuses on the theoretical approach. Instead data related to time have been approximated through literature and provided by the case company. This lowers the overall reliability of the study. The reliability of the waste reduction is however not dependent on the data related to time, it is instead dependent of the mathematical analysis based on travel distance and routing study. This means that even though complete effects of the recommendation might deviate from the calculations the fact that the results give positive effects rest on a more solid foundation.
Another limitation of the study is its design. A single case study cannot be presumed to apply in a generic case. In the case family grouping was used as a means of decreasing travel distance. The success of this method is depended on grouping of the articles. Since the kitting process allowed clear families the results can be argued to be greater in a generic case. This reasoning is in line with Castillo & Peters (2010) how agrues that this method might prove to be impractical. This is one example limitations due to the design. Others might be size of flow, number of euniqe parts or warehouse layout.
The methods used are based on the literature study, after which the methods of improvement was choocen. The literature study revealed that family grouping was an appropriate way of organizing the warehouse. This metod was used for both