Improved dose response modeling
for normal tissue damage
and therapy optimization
Magdalena Adamus-Górka
Division of Medical Radiation Physics Department of Oncology-Pathology Stockholm University & Karolinska Institutet
On the cover: An ”ancient Roman sigmoid curve” – architeconic detail of the Roman city ruins. Jerash, Jordan. c° Bartosz Górka, 2005
c
° Magdalena Adamus-Górka, Stockholm 2008 ISBN 987-91-7155-584-7
Printed in Sweden by Universitetsservice US-AB, Stockholm 2008
Abstract
The present thesis is focused on the development and application of dose response models for radiation therapy. Radiobiological models of tissue response to radiation are an integral part of the radiotherapeutic process and a powerful tool to optimize tumor control and minimize damage to healthy tissues for use in clinical trials. Ideally, the models could work as a historical control arm of a clinical trial eliminating the need to randomize patents to suboptimal therapies. In the thesis overview part, some of the basic properties of the dose response relation are reviewed and the most common radiobiological dose-response models are compared with regard to their ability to describe experimental dose response data for rat spinal cord using the maximum likelihood method. For vascular damage the relative seriality model was clearly superior to the other models, whereas for white matter necrosis all models were quite good except possibly the inverse tumor and critical element models. The radiation sensitivity, seriality and steepness of the dose-response relation of the spinal cord is found to vary considerably along its length. The cervical region is more radiation sensitive, more parallel, expressing much steeper dose-response relation and more volume dependent probability of inducing radiation myelitis than the thoracic part. The higher number of functional subunits (FSUs) consistent with a higher amount of white matter close to the brain may be responsible for these phenomena. With strongly heterogeneous dose delivery and due to the random location of FSUs, the effective size of the FSU and the mean dose deposited in it are of key importance and the radiation sensitivity distribution of the FSU may be an even better descriptor for the response of the organ. An individual optimization of a radiation treatment has the potential to increase the therapeutic window and improve cure for a subgroup of patients.
Keywords:
Normal tissue complications, radiobiological models, dose-response, volume effect, spinal cord, effective FSU size
List of Papers
This thesis is based on the following papers, which are referred to in the text by their Roman numerals.
I Adamus-Górka, M., Brahme, A., Mavroidis, P. and Lind, B. K. (2008) Variation in radiation sensitivity and repair kinetics in different parts of spinal cord. Acta Oncologica, 1-9
II Adamus-Górka, M., Mavroidis, P., Brahme, A. and Lind, B. K. (2008) The dose response relation for rat spinal cord paralysis analyzed in terms of the effective size of the functional subunit. Manuscript
III Mavroidis, P., Plataniotis, G., Adamus-Górka, M. and Lind, B. K. (2006) Comments on ’Reconsidering the definition of a dose-volume histogram’-dose-mass histogram (DMH) versus dose-volume histogram (DVH) for predicting radiation-induced pneumonitis. Physics in Medicine and Biology 51:L43-L50
IV Costa Ferreira, B., Mavroidis, P., Adamus-Górka, M., Svensson, R. and Lind, B. (2008) Impact of different dose-response parameters on biologically optimized IMRT in breast cancer. Submitted to Physics in Medicine and Biology
List of abbreviations
BIO-ART Biologically optimized 3-dimensional in vivo predictive assay-based radiation therapy CNS Central nervous system
CT Computed tomography DMH Dose-mass histogram DNA Deoxyribonucleic acid DSB Double-strand break DVH Dose-volume histogram EUD Equivalent uniform dose FSU Functional subunit
IGRT Image-guided radiation therapy IMRT Intensity-modulated radiation therapy LQ Linear-quadratic model
MRI Magnetic resonance imaging
NTCP Normal tissue complication probability PET Positron emission tomography
PET-CT Positron emission tomography – Computed tomography RCR Repairable-conditionally repairable model
RNA Ribonucleic acid SSB Single-strand break
CONTENTS
Contents
Abstract . . . iv
List of papers . . . v
List of abbreviations . . . vi
Table of contents . . . viii
1 Introduction . . . 1
2 Cellular response to radiation . . . 4
2.1 Intrinsic radiation sensitivity . . . 4
2.2 Normal and malignant cells . . . 4
2.3 Time scale of radiation effects . . . 5
2.4 Cellular targets of radiation . . . 5
2.5 Modeling of cell survival . . . 6
3 Tissue response to radiation . . . 9
3.1 Radiation tolerance . . . 9
3.2 Volume effect . . . 9
3.2.1 Reduced tolerance due to more intense complications . . . 10
3.2.2 Increased probability of complications . . . 10
3.2.3 Increased heterogeneity of dose . . . 11
3.2.4 Reduction in organ ”reserve” . . . 11
3.3 Functional organization of normal tissues . . . 11
3.3.1 Serially arranged FSUs . . . 12
3.3.2 FSUs arranged in parallel . . . 12
3.4 Probability of tissue damage . . . 13
4 Dose response models . . . 17
4.1 Distributions describing the shape of dose response . . . 18
4.1.1 The binomial distribution, . . . 23
4.1.2 The Poisson distribution . . . 24
4.1.3 The normal probability (probit) distribution . . . 25
4.1.4 The logit distribution . . . 26
4.1.5 The Weibull distribution . . . 27
4.2 Example of models fitting to experimental data . . . 27
4.2.1 Results of comparison using the likelihood function . . . 29
4.2.2 Results of comparison using the F test . . . 29
4.2.3 Conclusions from the model comparison . . . 29
4.3 Possible future extensions . . . 32
5 Maximum likelihood method . . . 33
CONTENTS
5.2 The Maximum Likelihood Estimate . . . 33
5.2.1 Example: Throwing a coin . . . 34
5.2.2 Example: Fitting of response data . . . 34
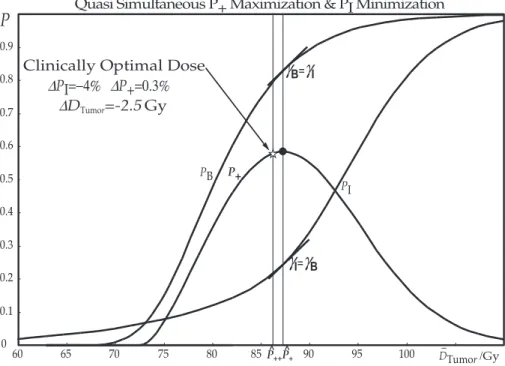
6 Treatment optimization with biological objectives . . . 35
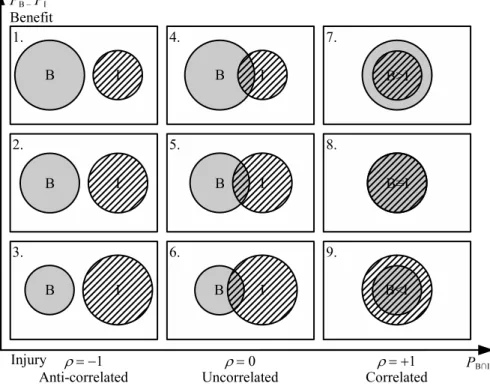
6.1 P+andP++ . . . 35
6.2 Predictive assays . . . 38
6.2.1 Predictive assays for normal tissues . . . 39
6.2.2 Predictive assays for tumors . . . 39
6.2.3 Future perspective . . . 40
7 Conclusions . . . 41
Acknowledgements . . . 43
1. Introduction
The total number of cancer patients in Sweden, both those who are receiving their treatment as well as those who are already succesfully treated, exceeds at present 300 000. Every year almost 50 000 new cancer cases are reported to the National Cancer Registry throughout the whole country with a population of 9 million. Worldwide, there are ten million new cancer cases diagnosed every year. Projecting the present trends, one can expect every third individual in Sweden, and of the young generation about every second will develop cancer at some point during their lifetime, usually at late age (Cancerfonden, 2005; SBU, 2003). Up to the age of 65-70 years the most common cause of death is cancer, only after that age vascular and heart diseases become more common. The high incidence is a really global problem, therefore prevention strategies that could decrease the cancer incidence, together with improvements in early detection through screening programs and accurate molecular diagnostics should be followed by innovative treatments and medical care and regular follow up programs (Ringborg, 2008).
The main goal of radiation therapy is to eradicate the tumor, while at the same time sparing the surrounding healthy tissue as much as possible. Starting with the discovery of X-rays and radioactivity in the mid 1890s and the following rapid progress of improved treatment techniques this goal has increasingly been achieved throughout the years. The treatment techniques have evolved, driven by discoveries that are considered to be the milestones in radiation therapy development. Intensity-modulated radiotherapy (IMRT) is widely considered the most important and exciting advance in radiation oncology, since the introduction of computed tomography-based treatment planning in 1970s (Bentzen, 2005; Bortfeld, 2006; Webb, 2003). The first paper on the conceptual basis of IMRT was published by Brahme et al. (1982) and was followed by a landmark work in inverse planning six years later (Brahme, 1988). Two decades after its invention, IMRT is a widely accepted treatment technique, clinically proven to reduce the side effects in normal tissues while achieving excellent long-term tumor control outcomes (Zelefsky et al., 2006). Due to the necessity of delivering very precise dose distributions to an exact localization of the target volume, as well as close checking of the treatment dose delivery, reliable imaging techniques for both diagnostics and treatment
1 Introduction
verification had to be developed. Initiated with computed tomography to delineate gross tumor growth as well as organs at risk using diagnostic X-rays and followed by magnetic resonance imaging (MRI) with even more accuracy to distinguish between tumor and normal tissues, cancer imaging experienced revolutionary developments. Image-guided radiation therapy (IGRT) became a tool that aids to control the tumor location, both before and during the treatment (Verellen et al., 2008). The new approaches in this area include the concept of biologically optimized 3-dimensional in vivo predictive assay-based radiation therapy (BIO-ART) where the fusion of images from positron emission and X-ray computed tomography within one diagnostic unit allows to achieve significant improvements in distinguishing between the tumor and normal tissue (Brahme, 2003). In the near future, the combined PET-CT into a treatment unit will be possible to monitor the metabolic response of the target, together with dose deposition during the treatment (Janek et al., 2006).
In parallel to the rapid development in radiation therapy techniques, further progress in providing the best possible tumor control while sparing the healthy tissue is driven by better knowledge and the utilization of biological basis for radiation oncology (Fowler, 2006). In clinical practice, the meaning of all the improvements in radiaion therapy planning and delivery translates into improvements in the treatment outcome. With availability of clinical and experimental data facilitating ”the con-scientious, explicit, and judicious use of current best evidence in making decisions about the care of individual patients” (according to the definition of evidence-based medicine by Sackett et al. (1996)) there are opinions that radiation oncology is becoming increasingly an evidence-based science (Bentzen, 2004). Further improvements in the therapy of cancer depend however on constant incorporation of the newly-available biological knowledge into clinical practice. This aim is being realized using the chain of translational research that consists of several steps including in vitro studies, animal experiments, mathematical modeling or, finally, clinical trials. Simultaneous development in all the areas constituting the translational research chain is a prerequisite for that multidirectional process to wok successfully (Baumann et al., 2001). Mathematical modeling of the tissue response to radiation, as an integral part of that chain, constitutes a significant improvement to the dogma of evidence-based medicine and is a prerequisite for the effectiveness of the whole treatment optimization system, bringing a clear cut scientific approach to the historical trial and error process of medical care.
The prinicpal aim of this thesis is to improve the modeling of the dose response used for normal tissue complications and optimization of radiation therapy. In order to achieve this goal, the thesis provides a thorough
analysis of the normal tissue complication probability (NTCP) models that are nowadays most commonly used and demonstrates the models ability to predict the experimentally or clinically observed complication rates. The thesis is based on four papers, where the requirements for a good and reliable NTCP model are defined and their use in a wide range of applications is demonstrated.
In Paper I the model describing normal tissue complication probability is fitted to two different sets of clinical data for radiation myelopathy to compare the sensitivity between the cervical and thoracic regions of the human spinal cord. There is a large differene in radiation response between the two regions. Thoracic spinal cord is characterized by a highly serial dose-response, while cervical myelopathy seems to be of medium seriality. The possible reason for much steeper dose-response curve for cervical spinal cord myelopathy can be a higher number of functional subunits consistent with a higher amount of white matter close to the brain.. In Paper II one of the NTCP models is used to explain the induction of white matter necrosis observed in rat spinal cord irradiated with proton beams, both with homogeneous and bath and shower dose distributions. Two new concepts are introduced: the effective size of the functional subunit (FSU) as well as the effective FSU dose and thereby describing the observed volume effect quite well.
In Paper III radiobiological measures are employed to compare the two concepts: dose-volume histogram (DVH) and dose-mass histogram (DMH). Arguments for a better description of effectiveness of the dose distribution delivered to the patient and its associated radiation effects using the DMH concept are discussed in some detail.
Paper IV indicates the necessity and advantages of truly individualized biological optimization of radiation treatment and highlights the possible benefits obtained by increasing the therapeutic window and switching from generalized into individualized radiation therapy. The significance of collecting the increasingly available information relating radiation dose to tissue response is discussed and development of methods to categorize the individual patient’s sensitivity is described.
Together these papers indicate improvements in dose response modeling, par-ticularly with strongly heterogeneous dose delivery such as IMRT, and its use when describing the efficacy of a treatment and biologically opimizing its out-come.
2 Cellular response to radiation
2. Cellular response to radiation
2.1 Intrinsic radiation sensitivity
In 1906, following their experiments on rat testis, Bergonie and Tribondeau formulated a law that relates radiation sensitivity to the reproductive capacity of cells. Their law can be expressed as follows: The ionizing radiation is more effective on cells and tissues that have a higher
reproductive activity. In practice this means that radiation will rather
destroy cells that have a less specified morphology and functions and, due to the high reproductive activity with more cell cycle division during their lifetime. The law explains one of the reasons why radiation therapy treatments are expected to destroy tumor cells more efficiently than healthy tissue (Perez and Brady, 1992). The other and more important reason has been understood better during the last decade, since the genetic instability of all tumor is really challenged by inducing large amounts of DNA damage during fractionated radiation therapy. The normal tissues are well organized and repair most of the damage from treatment to treatment, whereas the tumors most often have an impaired cell cycle reg-ulation and therefore accumulate more DNA damage from fraction to fraction.
2.2 Normal and malignant cells
There is no major difference between the radiation response of normal and ma-lignant cells if it was not for the differences in the cell cycle regulation, cell population kinetics and the functional organization of malignant cell popu-lations. The same radiation sensitivity of normal and malignant cell popula-tions in vitro is often obtained. Cells, however, do not exist in such artificial state, but instead they are part of livimg tissues and they do express different histopathological features and cell population kinetics. The factors responsible for the difference in radiation response between normal and malignant tissues are actually the same properties that constitute the nature of their normal-ity and malignancy (Nias, 1998). For tumor cells, the essence of malignancy may be manifested through alterations in the following six functional capa-bilities (Hanahan and Weinberg, 2000), even if the processes and strategies for acquiring them may vary:
2.3 Time scale of radiation effects
2. resistance to antigrowth signals,
3. resistance to apoptosis,
4. infinite capacity to replicate,
5. ability to produce new blood vessels,
6. ability to invade other tissues.
From a treatment and radiation response point of view, the abnormal vascularization of the tumor is a crucial problem, since many tumors express reduced radiation sensitivity when a large portion of their cells is hypoxic and hypoxic environment is often essential in aggravating the development of tumor malignancy.
2.3 Time scale of radiation effects
The consequence of irradiation in mammalian cell system is manifested by a cascade of successive physical, chemical and biological events extending from picoseconds when ionizations and excitations caused by a traversing high-speed particle take place up to even many years, with the occurence of late radiation effects. The absorbed dose of 1 Gy causes 105 ionizations
within a diameter of 10 µm which corresponds roughly to the volume of a cell. The physical radiation effects such as ionizations and excitations in turn give raise to DNA strand breaks and rapid chemical reactions including interactions of free radicals causing radiation chemical damage. The following phase of biological effects is the response of the biological system to the damage. Most of the direct DNA breaks and chemical damage gets quickly and efficiently repaired, but not always with high fidelity. However, unrepaired radiation damage and misrepair may lead to cell death and if there are fast proliferating cells that cannot be renewed due to damage to their stem cells, an early radiation response may occur. Skin and mucosa are examples of the early reacting tissues. Late effects in normal tissues take place after longer time following irradiation and they include fibrosis or telangiectasia, as well as damage to spinal cord or blood vessels. They occur when the slowly proliferating cells and vasculature cannot be renewed. The time scale of radiation effects could be extended up to many years, when radiation-induced carcinogenesis may occur (Steel, 2002).
2.4 Cellular targets of radiation
The correlation between the radiosensitivity of the cells and their DNA content in a wide range of cellular species (from viruses to mammals) suggests that the DNA is the radiation target in the cell (Tubiana et al.,
2 Cellular response to radiation
1990). For single-stranded DNA and RNA viruses the correlation is observed between the radiosensitivity and the amount of DNA or RNA, suggesting that breakage of strands leads to inactvation of the virus. The DNA or RNA molecule is then the cellular target for radiation and the larger amount of the target in the cell, the more radiosensitive the cell is. Experiments with viruses with double-stranded DNA show 10 times greater radiosensitivity than for the single-stranded nucleic acids. These results show that a double-strand break (DSB) is required for inactivation of the virus, while a single-strand break (SSB) can be repaired based on the other strand as a template (Kaplan and Moses, 1964). Other experiments suggest that there might be other targets responsible for cellular radiosensitivity (Schmidt-Ullrich, 2003).
2.5 Modeling of cell survival
Many cell survival models have been used through the years (Zimmer, 1961; Hug and Kellerer, 1966; Tobias, 1985; Curtis, 1986; Sontag, 1997), most of which have one shortcoming or another. To really describe the low, intermediate and high dose region well neither the simple exponential:
S = e−D/D0 (2.1)
nor the linear-quadratic (LQ) model (Sinclair, 1966):
S = e−αD−βD2 (2.2)
is sufficient. A recent development is the repairable-conditionally repairable (RCR) damage model:
S = e−aD+ bDe−cD, (2.3)
cf. Figure 2.1, which fulfills most classical needs over the entire dose range (Lind et al., 2003). It handles the low dose hypersensitivity well, the sublethal damage repair and the shoulder of the survival curve is handled well by the second term and the closely exponential shape at very high doses is defined by the last term. Interestingly this model is based on the two main repair systems in mammalian cells: non-homologous end joining (NHEJ) and homologous recombination (HR). The NHEJ is fast repairing most double strand breaks (DSBs). However, it is not doing it with a high degree of fidelity so the HR process is often needed in the G2-M phase to proof read all the repair done by NHEJ. In the RCR model it is assumed that most of the potentially lethal damage is rapidly repaired and if this happens also the conditionally repairable damage may be correctly repaired. Thus the first term describes the exponentially surviving cells due to unhit cells,
2.5 Modeling of cell survival
whereas the last linear exponential term describes the correct repair (e−cD)
of sublethal damage to the first approximation induced linear to the dose (bD).
0 2 4 6 8 D /Gy10 N 7 + :J N 7 + :K 0.001 0.01 0.1 1 S(D) Undamaged
PotentiallyRepairable & Conditionally Repairable Damage
Total Survival bDe-aD bD(e-cD-e-aD) bDe-cD e-aD+ bDe-cD e-aD Total Sublethal 1 .35 Potentially Repaired Conditionally Repaired 60Co: J (DNA PK-/-)
Figure 2.1: Different types of cellular events associated with sublethal, potentially
and conditionally repairable damage, as shown by the Venn diagrams and the as-sociated survival curves. Interestingly the RCR model can be interpreted in terms of the two major repair systems for double-strand breaks: NHEJ and HR for potentially and conditionally repaired damage, respectively. Adapted from Brahme and Lind
(2008).
Interestingly, the second term can be derived from the experimental data in Figure 2.1 (gray dots) since it pertains to two cell lines M059K and M059J, of which the latter is mutated in DNA PK and thus not capable of repairing DSBs by the NHEJ process. The repair proficient cell line has a nice normal shoulder with a small amount of low dose hypersensitivity for60Co whereas
the DNA PK mutant line has a purely linear and exponential survival curve without repair of sublethal damage. The difference expresses thus the sublethal repair and is well described by the second term in equation (2.3), as seen in the Figure 2.1. Also seen in the figure is that60Co and nitrogen
ions have almost identical survival curves for the mutant cells, whereas the repair proficient cell line has no possibility to repair any of the damage produced by the nitrogen ions. This experiment thus also illustrates the small difference between the cellular response of different cell lines with high LET ions, but not between the same cell lines with low LET radiation where the difference can be very large. At low doses without low dose
2 Cellular response to radiation
hypersensitivity the LQ model agrees very well with the new expression and it is possible to derive a, b and c from knownα and β values (Lind et al., 2003). The new expression is also shown to handle the interaction of low, intermediate and high LET damage and hypoxia quite well (Persson, 2002; Lind et al., 2003).
3. Tissue response to radiation
Radiation response of a tissue is investigated using sigmoidal dose-response curves where position on the dose scale shows the sensitivity to radiation and the steepness of the curve gives an estimate of change in the response that will be a consequence of change in dose. Examples of dose-response curves are shown in Figures 3.3 and 4.1.
3.1 Radiation tolerance
In clinical radiotherapy it is easy to notice that the dose distribution that can be tolerated is dependent on the volume irradiated and structural organization of the irradiated tissue. The definition of the tolerance dose is based on the acceptable probability of a mild type treatment complicaton that it may produce. However, there is no such thing as a single tolerance dose for any tissue or patient. A better approach is to determine the normal tissue dose response which requires a good understanding of its biology and dose response relationship (Hall and Giaccia, 2006; Withers, 1992). For this reason a serious therapy optimization approach needs to take the gradual increase with dose, both of normal tissue side effects and the probability of tumor cure.
3.2 Volume effect
The risk of acute or late normal tissue reactions increases with increasing dose (Rubin and Casarett, 1972) and avoidance of severe radiation injuries is particularly important. To be able to effectively spare the healthy normal tissue during radiation therapy it is essential to understand the underlying phenomena which are responsible for the response of those tissues and whether a high local dose or the mean dose is most deleterious.
The volume effect is defined as the dependence of radiation damage to normal tissues on the volume of the tissue irradiated (Hall and Giaccia, 2006; Steel, 2002) or as the relationship between the radiaton doses causing the same probability of normal tissue complication and the irradiated volume of the investigated tissue (Hopewell and Trott, 2000). The volume effect phenomenon has been widely studied to improve the understanding
3 Tissue response to radiation
of doses that can be delivered to normal issues during radiation therapy and particularly the understanding of partial organ irradiation (Ten Haken, 2001).
The concept of this phenomenon was based on skin reactions of patients observed in clinical practice. It has been demonstrated in many experimental settings, abundance of which concentrate on the spinal cord as an organ that is especially important to be spared during radiation therapy of patients. Experimental results on irradiating rat spinal cord have been published by Hopewell et al. (1987), Hopewell and Trott (2000) and a group from the Netherlands (Bijl et al., 2002, 2003, 2006; Philippens et al., 2004, 2007; van der Kogel, 1993). Experiments performed on cervical spinal cord of pigs do not show signficant field size-related difference in response to single doses of clinically relevant level (Schultheiss et al., 1994), but results from rhesus monkies which is the animal model most similar to that of humans regarding radiation myelopathy, indicate the existence of volume effects (van den Aardweg et al., 1995). Reports of clinical data are also available, describing the existence of dose-volume dependence in human spinal cord (cf. Schultheiss et al. (1995) and references therein) as well as in other organs, e.g. brain (Levegrün, 2001), heart (Gagliardi et al., 2001), liver (Dawson et al., 2001), lung (Seppenwoolde and Lebesque, 2001), parotid gland (Eisbruch et al., 2001) and rectum (Jackson, 2001). According to Withers (1992) there are several types of volume effects exis-ting in clinical practice, depending on the type of tissue and the endpoint under consideration. The factors contributing to the effect are the following: reduced tolerance to equally severe injury with increasing volume irradiated, increased probability of a complication from the same severity of injury, increased hete-rogeneity of the dose distribution in the tissue and reduction of organ progen-itor cell ”reserve”.
3.2.1 Reduced tolerance due to more intense complications
A patient can tolerate injury in a small volume better than the same damage in a larger volume, where consequences are more dangerous and healing is slower. Therefore, increasing the volume is a reason of making the injury more incapacitating to the host, even if the radiosensitivity of the target cells or FSUs is unchanged and so is the severity of radiation response per unit volume, being independent on the treated volume.
3.2.2 Increased probability of complications
In a normal tissue where FSUs are arranged in series (for example spinal cord, cf. Figures 3.3 and 4.2), the loss of one subunit results in organ injury
3.3 Functional organization of normal tissues
regardless on the state of the other subunits in the series. This way, the proba-bility of complication increases with increase in the number of exposed FSUs. The relationship between number of irradiated functional subunits (n) and probability of complications (P) can be described by the formula:
P = 1 − (1 − p)n (3.1)
where p is the probability of losing one FSU, see also equation (3.2).
3.2.3 Increased heterogeneity of dose
When a large volume is treated there are large gradients in dose distribu-tion. Such a situation may lead to serious consequences including producing a marked change in incidence of complication when the dose-response curve is steep. The so called double trouble effect implies that an increased dose in part of the volume will receive an increased total dose and an increased dose per fraction and also often an increased dose rate.
3.2.4 Reduction in organ ”reserve”
A volume effect relates to decreasing of the organ’s functional reserve in direct proportion to the irradiated volume. In such a tissue (for example lung) the to-tal dose required to cure most local tumors would be sufficient to eliminate the functional integrity in the treatment volume (Withers, 1992).
3.3 Functional organization of normal tissues
The fundamental effect of ionizing radiation on a tissue is caused by the slowing down secondary electrons that induce DNA damage responsible for the associated cell kill. But the tolerance of a tissue to radiation is dependent on the clonogenic cells’ ability to maintain organ functions. The function of an organ depends upon the way the cells are organized into functional subunits (FSUs). Concerning the tolerance doses, there are two types of functional subunits:
1. Structurally defined FSU, where survival of an organ depends upon the survival of at least one clonogenic cell within it. An example of such an organ is kidney, consisting of a large number of relatively small nephrons. Each of the FSUs is generally assumed to be independent of its neighbors. Since the FSU is relatively small, it can be easily damaged by relatively low doses, which explains the low radiation tolerance of the kidney.
3 Tissue response to radiation
2. Structurally undefined FSU, where cells are not aggregated into a structurally defined FSUs, like the skin in which the cells are organized in wide sheets. The maximum area or volume that can be repopulated by one clonogenic stem cell to maintain organ function, defines the size of structurally-undefined FSU (Källman et al., 1992; Withers, 1992). For the radiation response of tissue the functional organization of its FSUs is critical. There are two extreme cases of tissue organization: serial and parallel. A number of intermediate, mixed or cross-linked tissues with combined serial-parallel organization are more common (cf. Figure 3.3). The probability of the tissue response depends on its respective organization, cf.Källman et al. (1992), according to the following equations:
Pserial= 1 − m
∏
i=1 (1 − Pi), (3.2) Pparallel= n∏
j=1 Pj, (3.3) Pmixed= n∏
j=1 " 1 − m∏
i=1 (1 − Pi j) # , (3.4) and Pcrosslinked= 1 −∏
m i=1 Ã 1 −∏
n i= j Pi j ! . (3.5)These four different FSU arrangements are schematically visualized in the up-per part of the Figure 3.3.
3.3.1 Serially arranged FSUs
In serial organs FSUs are arranged like links of the chain (for example in spinal cord). In such a case each of the FSUs is critical to the functions of the organ and its elimination results in a measurable complication probability. In the spinal cord specific functions are controlled by different units that are linearly arranged, such as the myelin sheaths and associated oligodendrocyte progenitor cells. Death of criti-cal cells in any of the organ’s units will result in the failure of the whole organ.
3.3.2 FSUs arranged in parallel
The opposite cases are tissues where the FSUs are organized in parallel, like for example liver. This means that there is a redundancy so that many
3.4 Probability of tissue damage
of the FSs have to be destroyed in order to damage the function of the organ and thus creating a pronounced volume effect.
3.4 Probability of tissue damage
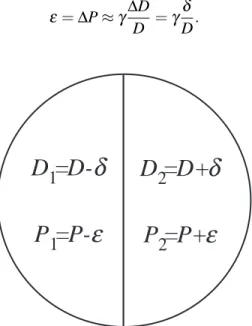
Since the response of an irradiated organ depends on the organization of its in-ternal structures, i.e. the way the functional subunits constituting the organ are arranged, two opposite cases of tissue arrangement are considered: parallel and serial organization of functional subunits. The organ presented schema-tically in Figure 3.1 is irradiated with the doses D1= D −δ and D2= D +δ
in the left and right half, respectively. This results in the probabilities P1
and P2 for damage of the left and right part, respectively. The relation be-tween the small dose difference,δ , and corresponding change in the probabil-ity of injury,ε, can be estimated using the γ-value (Brahme, 1984):
ε = ∆P ≈ γ∆D D =γ δ D. (3.6)
D
1
=D-
δ
P
1
=P-
ε
D
2
=D+
δ
P
2
=P+
ε
Figure 3.1: Schematic drawing showing an organ irradiated with different doses D1
and D2, resulting in the probability of damage P1and P2, respectively.
The probability of damage to the whole organ, assuming parallel organization of its functional subunits, can be calculated as:
Pparallel= (P −ε)(P + ε) = P2−ε2, (3.7)
where P is the probability of injuring of half the organ when irradiated with dose D. For a serial organ the probability of damage is given by the following expression:
3 Tissue response to radiation
Pserial = 1 − (1 − (P −ε))(1 − (P + ε)) =
= 1 − (1 − P)2+ε2 (3.8)
cf.Equations 3.1 and 3.2. When P is small, Equation 3.8 shows that the prob-ability of response is almost doubled in the serial case:
Pserial= P(2 − P) +ε2. (3.9)
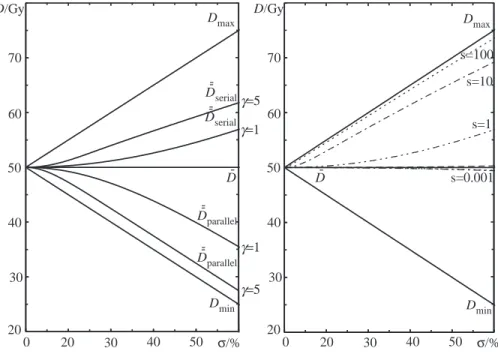
The different behavior due to the tissue architecture is here clearly seen for nonuniform dose delivery. The probability of injury of the parallel organ will decrease, whereas the probability of injury will increase if the organ is of a serial type with increasing non-uniform dose delivery. This implies that if a certain amount of mean energy imparted (integral dose) has to be delivered in an organ at risk which is of serial type then the dose should be distributed as uniformly as possible in order to minimize the complication probability. For parallel organs it is bet-ter to concentrate the high dose region as much as possible into small volumes. The biologically effective uniform dose, ¯¯D, is the uniform dose that causes exactly the same tumor control or normal tissue complication probability as a given nonuniform dose distribution, as calculated with a given model. The way of denoting this dose indicates that it has been averaged over both dosimetric (dose distribution) and biological (dose response relationship) information about the patient. The dose ¯¯D has been calculated with the Poisson model (cf. 4.1.2) for the two extreme cases of organ structure, parallel and serial, and is shown in the left panel of the Figure 3.2. It is clearly seen, especially for largeγ-values, that ¯¯D for parallel structures is close to the minimum dose since tumors have parallel structure and the coldest spot determines the level of tumor eradication.
The right panel of the Figure 3.2 is illustrating the same as the left panel, but for the relative seriality model (Källman et al., 1992). The dose ¯¯D is minimal for organs with parallel structure (like tumors, for example) at large dose vari-ations. For serially organized organs (that is more relevant to normal tissue) the dose is more close to the maximum one (Mavroidis et al., 2000, 2001). It is interesting to note that for ¯¯D to approach Dmax, the s value (cf. Figure 3.3) has to be À 1, implying the ”super-seriality”.
3.4 Probability of tissue damage D/Gy 50 40 30 20 60 70 0 20 30 40 50 σ/% D/Gy 50 40 30 20 60 70 0 20 30 40 50 σ/% Dmax Dmax Dmin Dmin D--parallel D--parallel D--serial D--serial D -D -γ=5 γ=1 γ=1 γ=5 s=100 s=10 s=1 s=0.001
Figure 3.2: The variation of ¯¯D as a function of the nonuniformity of the dose for
dif-ferent tissue architectures. The dose in the left panel has been calculated with Pois-son model for parallel and serial organ strcture. The right panel is a demonstration of the relative seriality model, adapted fromMavroidis et al.(2001).
3 Tissue response to radiation = F u n ct io n al S u b U n it D 5 0= 39 .2 1.5 Gy γ = 4.2 0.6 s = 0.0003 0.0002 V re f= 500 cm 3 D 50 = 49. 2 G y γ = 3. 0 s = 0. 2 H ear t P er ic ar d it is E m am i et al . 1991 V re f= Wh o le h ear t 1. 0 0. 67 0. 33 V = 500 cm 3 re f F igur e 3.3: The functional or ganization of the most simple tissues ha ve a strong influence on the observ ed dose response relation. The relati ve seriality is expressend by the parameter s = m n∗ m = 1 n .Adapted from Brahme ( 1999 ).
4. Dose response models
Modeling of normal tissue response to radiation has become an important domain of modern radiation therapy. Numerous models have been developed during the years to help in determining the optimal treatment. The process of creating such models usually involves many simplifying assumptions. The damage induction is considered stochastic, so the survival of cells is following basically either binomial or Poisson statistics. The organ response is either assumed to depend on the response of individual cells and/or the response of the FSU. All cells as well as all FSUs are assumed to respond identically. The isoeffect relationships do not depend on the level of response and equal dose fractions are assumed to cause equal effects, provided the time separation is sufficient. Two connected levels of radiation response are generally modelled, namely survival of cells and response of an organ. Many models originate from an expression for cell survival and they incorporate this expression in the formula for the organ function. However, other models are purely phenomenological, where no explicit formula for cell survival is included. A radiobiological model, to be considered reliable, has to fulfill certain requirements. It should appropriately predict the shape of the dose-response curve, it should duely handle the volume and fractionation effect and it should accurately describe the probability of a specified response for arbitrary non-uniform dose delivery as accurately as possible.
Numerical quantitative comparisons of existing dose-response models have been done by many authors, for example van der Kogel (1993); Baltas and Grassman (1997); Philippens et al. (2004); Tucker et al. (2004); van Luijk et al. (2005) and references therein. However, despite the great interest in this subject an important issue has not been taken into account in these studies, namely the separation of the volume effect from the dose-response of the whole organ. Being able to separate these two different phenomena should not only allow estimation of the accuracy and clinical validity of the models, but also make it possible to investigate the diversity of the models and emphasize the differences between them. A model combining accurate dose response description together with precise volume effect handling is required for accurate optimization of the treatment outcome.
4 Dose response models
4.1 Distributions describing the shape of dose
response
The study of the dose response relations in radiation therapy is important for improving quantification and knowledge about mechanisms influencing the response of organs and tissues to radiation therapy. It is important to know the expected response level in normal tissues when irradiating a patient, since the aim of radiation therapy is to eradicate the tumor while sparing healthy normal tissues as far as possible. This is particularly important when using radiobiologically optimized radiation therapy where both the therapeutic effect and adverse normal tissue damage need to be accurately quantified to maximize the treatment outcome. Most often the dose to the tumor is limited by the tolerance of surrounding normal tissues. Understanding the underlying biological processes is essential for selecting the model for describing the normal tissue response and determining tissue tolerance in different situations. Even more important is to be able to quantify the quality of life after the treatment, that is to estimate the probability of a truely successful treatment such as having a high probability of tumor cure or local control and negligable risk of treatment related morbidity. There exist several types of volume effects, defined by the decrease in tissue function or the probability of a specific endpoint with increasing irradiated volume, as described in Section 3.2. The FSUs can for example be functionally arranged in series, paralell or have a mixed serial-parallel or crosslinked organisation. Serially arranged FSUs are organized like links of a chain, such as the insulating myelin cells of the axons in the spinal cord. In such a case the function of each FSU is critical for the function of the organ and elimination of any one of them may result in a measurable loss of function or an increased complication endpoint. Therefore in serial tissues the maximum dose is largely determining the therapeutic response. However, when the FSUs are organized functionally in paralel, there is a redundancy where neighbouring FSU can take over function. In such tissues the volume dependence of the dose-response relation is very significant since the response in a small high-dose volume can be almost fully compensated by surrounding FSUs. For paralell tissues the mean dose is therefore the most important factor determining the clinical effect. Mixed serial-parallel tissue organizations are the most common and the most general way of tissue organization, combining the structure and function of the two basic arrangements (Källman et al., 1992). The relative seriality model is designed to describe the gradual change in response from a closely serial tissue to one which is largely parallel. Spinal cord is a critical normal tissue that almost at all cost should be spared during radiation therapy. It is an example of an organ with a highly
4.1 Distributions describing the shape of dose response
serial arrangement of its functional subunits. It is built of nerve cells -neurons, the axons of which are arranged in bundles along the organ. The characteristic H-shaped pattern on the spinal column cross section is a result of the arrangement of the nerve cell bodies and axons within the cord. The inner part, creating the H-letter shape consists of gray matter, while the white matter creates a more lipid-rich, pale surrounding. It is well known that the material building the gray matter is mainly nerve cell bodies, while axons and the associated myelin cells are the ones constituting the white matter. In mammalian nerve tissue, the axons (e.g. motor neurons or sensory neurons) are equipped with a special layer of insulation, namely the myelin sheath. The myelin sheath is created by oligoendrocytes surrounding the axons of a neuron, increasing the integrity, speed and information content of the transmitted signal (Bunge, 1968; Baumann and Pham-Dinh, 2001). There are often very serious consequences of exceeding the tolerance dose of normal tissues. As far as the latency period is concerned, the radiation response can be divided into an early and a late occuring damage. There is a close correlation between the time of appearance of radiation-induced damage and the normal proliferative activity of the considered tissue. The higher the rate of normal cell turnover, the faster the onset of the damage. In slowly proliferating tissues, such as spinal cord, the induction of radiation damage is considerably delayed in time. The late types of radiation-induced damage, in case of spinal cord myelopathy and paralysis, consist of two main endpoints: white matter necrosis and demyelination, occuring usually between six to eighteen months after irradiation, followed by vascular damage with the onset of between one to four years.
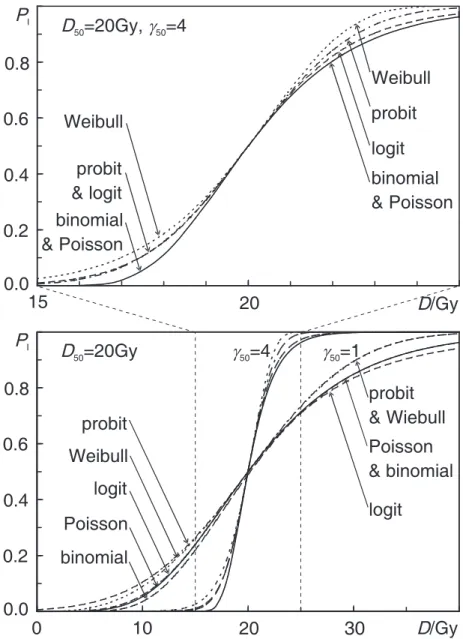
Dose-response models can be categorized into several groups based on the statistical distribution they use for describing the sigmoid shape of the dose-response curve (see Figure 4.1). The five distributions used in the models investigated in the present study are: binomial, Poisson, probit, logit and Weibull distributions. They constitute a basis for the following seven radiobiological models for normal tissue complication probability: the critical volume model (Niemierko and Goitein, 1992) based on the binomial distribution for the dose-response curve shape, the relative seriality (Källman et al., 1992), the inverse tumor (Källman et al., 1992) and the critical element (Schultheiss et al., 1983) models, all of which are based on Poisson statistics, the Gaussian model (Lyman, 1985) based on the normal distribution or probit function, the parallel architecture model (Jackson et al., 1995) using logit expression and the Weibull distribution model (Klepper, 2001) based on Weibull distribution. The four first models are using cell-survival-based response (Poisson and binomial distribution for the shape of the dose-response curve), while the other three are more phenomenologi-cal. To rationalize the comparison in this work, the expressions for the normal
4 Dose response models
tissue complication probability (NTCP) of all the models have been rewrit-ten in terms of D50andγ50(see Table 4.1), explanation of symbols will follow.
0
0.2
0.4
0.6
0.8
1
0
40
0.8
0.0
0.2
0.4
0.6
P
I20
D/Gy
15
D
50=20Gy, g
50=4
binomial
& Poisson
Weibull
probit
logit
Weibull
probit
& logit
binomial
& Poisson
logit
binomial
probit
Weibull
Poisson
0.8
0.0
0.2
0.4
0.6
P
I20
D/Gy
0
10
30
D
50=20Gy
g
50=1
logit
Poisson
& binomial
probit
& Wiebull
g
50=4
Figure 4.1: Comparison of the shape of the dose-response curve for different
statisti-cal distributions used to describe the cell kill. The two figures differ only inγ value and the different horizontal scales.
4.1 Distributions describing the shape of dose response
Figure 4.2: Volume and dose-response curves for white matter necrosis of different
lengths of rat cervical spinal cord, data fromHopewell et al.(1987). The dashed lines give the combined best fitting. The solid lines have been fitted for each of the irradiated spinal cord segment lengths separately, i.e. without any volume effect.
4 Dose response models Table 4.1: Ov ervie w of the dose response models. statistics model dose response, P (D ) dose-v olume response, P (D ,V ) D 50 /Gy γ 50 binomial critical volume ¡ 1 − e − D /D 0 ¢ N 0 1 − ∑ N M + 1 ¡ N M ¢ P M + 1 (1 − P ) N − M − 1 a − D 0ln ¡ 1 − ( M N ) 1/ N 0 ¢ implicit Poisson relati ve seriality e − N 0e − (D /D 0 ) h 1 − (1 − P I(D ) s ) V V ref i 1 s D 0 (ln N 0− ln ln 2) ln 2 2 ln ¡ N 0 ln 2 ¢ critical element " 1 − (1 − P I(D )) V V ref " " in verse tumor " e − N 0e − (D /D 0) + k ln (V /V ref ) " " probit Gaussian distrb ution γ 50 D 50 R D 0 e − 1 π ³ γ x− D 50 D 50 ´ 2 dx 1 √ 2 π R t − ∞ e − τ2 2 dτ b D 50 1 m √ π logit parallel architecture 1 1+ µ D FSU 50 D ¶ k 1 √ 2 π σ 2 R f 0 exp h − (v − v 50 )2 2 σ 2 i dv D F SU 50 ( 1 v50 − 1) 1/ k implicit W eib ull W eib ull distrib ution 1 − e − (D /A 1) A 2 1 − exp − Ã D ³ V V ref ´ B A 1 ! A 2 A 1 (ln 2) 1/ A 2 A 2 ln 2 2 a P = P (D ) ³ V V ref ´ b the upper limit, t, of the normal distrib ution probability function is gi ven by equation ( 4.20 )
4.1 Distributions describing the shape of dose response
4.1.1 The binomial distribution,
The binomial distribution, assuming N0functional subunits and a probability of FSU survival, S(D), at a dose D, gives the following probability of response:
P(D) = (1 − S(D))N0. (4.1)
The following simple equation for exponential cell survival is used, cf.Brahme et al. (2001):
S(D) = e−nd/D0, (4.2)
where D = nd is the total dose, d is the dose per fraction, n is the number of fractions and D0 is the dose giving on the average one lethal hit per FSU.
Together with the binomial model, equation (4.1), for response, the dose giv-ing 50% response probability, D50, and the maximum value of the normalized
dose-response gradient, eγ (Lind et al., 2001), become:
D50= −D0ln µ 1 − 1 21/N0 ¶ (4.3) and e γ = ln N0 µ 1 − 1 N0 ¶N0−1 (4.4) respectively. eγ is defined by e γ ≡ eDP0( eD) (4.5) where P0( eD) = max D µ ∂ P(D) ∂ D ¶ (4.6)
(Lind et al., 2001). For large N0, the expressions for D50 and eγ for the bino-mial model become identical to the expressions for the Poisson model (see Figure 4.1).
The critical volume model
This model has been developed by Niemierko and Goitein (1992). The proba-bility P that more than M of the N FSUs are killed is given by the cumulative binomial probability: P = N
∑
t=M+1 Pt = N∑
t=M+1 µ N t ¶ PFSUt (1 − PFSU)N−t (4.7)where Pt is the probability that t of the N FSUs are killed,
¡N
t
¢
is the bino-mial coefficient, PFSUt is the complication probability for t functional sub-units, while PFSU is the complication probability for one FSU. The NTCP
4 Dose response models
for the entire inhomogeneously irradiated organ can be calculated using equa-tion (4.7) with the PFSU being replaced by the effective complication proba-bility for one FSU:
PFSUeff = 1 Np Np
∑
i=1 PFSUi (Di) (4.8)where Np is the number of calculational points inside the organ of interest, PFSUi is the complication probability for the ithFSU and D
iis the
correspond-ing dose received. Due to the difficulties in calculatcorrespond-ing the cumulative bino-mial distribution a normal distribution approximation suitable for numerical calculations is often used.
P = N
∑
t=M+1 µ N t ¶ PFSUt (1−PFSU)N−t≈ 1 σFSU √ 2π Z M −∞exp µ −(x − NPFSU)2 2σ2 FSU ¶ dx (4.9) where: σFSU= p NPFSU(1 − PFSU). (4.10)Such an approximation is more accurate for large NPFSU(1 − PFSU)values.
4.1.2 The Poisson distribution
This distribution is the limiting case of the binomial distribution when N0
is large and presents the probability of complications in normal tissue by:
P(D) = e−N0S(D) (4.11)
where N0S(D)becomes the average number of FSUs surviving a dose D.
Us-ing the exponential cell survival equation (4.2) for clonogenic cell survival, together with the Poisson model, equation (4.11), for response, D50, and eγ,
become: D50= D0(ln N0− ln ln 2) (4.12) and e γ = ln N0 e (4.13)
respectively, where e is the base of the natural logarithm. For models based on Poisson statistics the maximum slope of the dose response relation is at the dose giving 37% probability of response. For that reason eγ is sometimes denotedγ37. In order to facilitate comparison between different
models, also those usingγ50the following transformation can be used:
4.1 Distributions describing the shape of dose response
The relative seriality model
This model was developed to better account for the functional organization of FSUs, cf. Källman et al. (1992). An arbitrary combination of serial and parallel organized of FSUs can be considered. For this model, normal tissue complication probability PIis mathematically expressed by:
P(D,V ) = h
1 − (1 − P(D)s)V /Vref
i1/s
(4.15)
where P(D) is given e.g. by the Binomial or Poisson expression (4.11), s is the parameter which expresses the degree of seriality (the value varies from s close to zero for nearly parallel organs and upwards for increasing seriality) and V /Vrefis the volume fraction being irradiated to dose D.
The critical element model
This model was proposed by Schultheiss et al. (1983) and it is a sim-plified case of the relative seriality model, obtained by putting s=1 into equation (4.15). The expression for NTCP is given by:
P(D,V ) = 1 − (1 − P(D))V /Vref (4.16)
where P(D) is given by equation (4.11).
The inverse tumor model
This model was developed by Källman et al. (1992) based on a simplistic in-verse tumor response. It has been derived for uniform tumors and then adapted to model the volume dependence of normal tissues by introducing a constant kwhich for uniform tumors equals to unity, but for normal tissues generally has a negative value. The NTCP may then be approximated in the following way:
P(D,V ) = e−N0e−(D/D0)+k ln(V /Vref) (4.17)
where the free parameter k takes into account the importance of the volume effect in the tissue.
4.1.3 The normal probability (probit) distribution
This distribution for the response results in the following expression:
P(D) = 1 2 µ 1 − Erf · γ50√π µ 1 − D D50 ¶¸¶ . (4.18)
The Gaussian model
This model was developed by Lyman (1985) based on the error or probit func-tion form. In this case, the normal tissue complicafunc-tion probability is given by the following expression:
P(D,V ) = √1
2π
Z t
−∞exp(−τ
4 Dose response models
where the upper limit, t, of the normal distribution probability function is de-fined as follows: t(D,V ) =D − D50(V /Vref) mD50(V /Vref) (4.20) and D50(V /Vref) = D50(1) µ V Vref ¶−n . (4.21)
The model contains four free parameters: D50, n, m and Vref. D50 and Vref
were defined above, while D50(1)is the tolerance dose for 50 % complications for uniform whole organ irradiation, D50(V /Vref)is the 50 % tolerance dose
for uniform partial organ irradiation. The volume dependence of the compli-cation probability is determined by the parameter n, which quantifies the sen-sitivity of P to the irradiated volume of the organ. The slope of the dose re-sponse curve is governed by the value of the parameter m. The slope parameter mis inversly proportional toγ50through the relation m = γ501√π.
4.1.4 The logit distribution
This distribution is an analytical sigmoidal shaped curve commonly used in biology defined the following way:
P(D) = 1 1 + ³ DFSU 50 D ´k. (4.22)
The parallel architecture model
This model (Schultheiss et al., 1983; Yorke et al., 1993; Jackson et al., 1995) presents NTCP as an increasing function of the number of FSUs inactivated by radiation. The probability p that a dose D inactivates an FSU is given by the logit expression (4.22) where the slope parameter k = 4γ50. The above
sigmoid dose response function, P(D), is assumed to describe the probability of damaging a subunit at a given biologically equivalent dose. Apart from the assumption that biologically equivalent doses can be calculated from the linear quadratic formula no connections of this probability with any underlying vascular mechanism of radiation injury or identification of the subunits involved has been attempted. Instead it has been chosen to describe the subunit response phenomenologically, using a logistic function of dose parametrized in terms of the dose DFSU
50 at which 50%
of the subunits are damaged, and the slope parameter k, that determines the rate at which the probability of damaging a subunit increases with dose. For a given dose matrix the total fraction of FSUs, being inactivated is given by the sum over all the individual contributions:
4.2 Example of models fitting to experimental data
where Di and vi are the dose and the volume fraction of the ith voxel
and f is the fractional damage. To fit the parallel architecture model to clinical data, expressions for both P(D) and the statistical distribution of functional reserves over the patient population are required. Normal tissue complication probability PI for a general DVH is calculated from the equation: PI=√ 1 2πσ2 Z f 0 exp · −(v − v50)2 2σ2 ¸ dv (4.24)
in which it is assumed that the cumulative functional reserve distribution can be described as a displaced error function and quantified by the mean value of the functional reserve v50, and the width of the functional reserve
distributionσ . In this equation v is the partial organ volume being irradiated (Jackson et al., 1993, 1995; Yorke et al., 1999).
4.1.5 The Weibull distribution The Weibull distribution model
In this model the mathematical expression for the NTCP PIis based on a
mod-ified Weibull function (Johnson et al., 1994): PI= 1 − exp " − µ DVb A1 ¶A2# (4.25)
where A1, b and A2 are three model parameters, which are determined
from the clinical data (Klepper, 2001). This can be rewritten in terms of D50
andγ50as: P(D) = 1 − exp " − ln 2 µ D D50 ¶ 2 ln 2γ50 # . (4.26)
4.2 Example of models fitting to experimental data
The models were fitted to experimental data for paralysis after irradiation of spinal cord of rats (Hopewell et al., 1987). They show development of two differenf endpoints: white matter related spinal cord paralysis (white matter necrosis) within 30 weeks and paralysis or histological evidence of vascular leasions (vascular damage) after a latent interval of 30 weeks following single dose irradiation of rat spinal cord. Three different lengths of irradiatied spinal cord were used, 4, 8 and 16 mm.For all the models the reference volume Vre f was defined by the reference
spinal cord length of L0=16 mm corresponding to a relative volume v = 1,
cf. Baltas and Grassman (1997); Cronqvist et al. (1995). Even if the size of the dataset is limited, it was sufficient to apply the statistical method
4 Dose response models
we have chosen. Using these data, different parameters of the models were calculated for each of the endpoints using all the irradiated spinal cord lengths. The results were used to make an intercomparison between the predictions of the different models.
Two aspects of this study should be emphasized: the shape of the dose-response curve and the volume effect. To be able to judge each of the above phenomena individually we tried to separate them by removing the volume effect. The removal of the ¨volume effect was achieved through making a sep-arate fit of the models for each of the irradiated volumes or lengths of spinal cord separately, assuming that each partially irradiated length is a separate unity. Each of the models had a total of six free parameters due to the can-celling of the parameters describing the volume dependence. The model intercomparison was made for fitting both with and without the volume effect. We used the maximum likelihood method in our study to both compare the overall (i.e. including the volume effect) fitting results of all investigated models as well as to compare the fitting results of the models where the volume effect has been removed, as described above.
After fitting the models to the clinical data, the goodness of fit of the models and their parameters was evaluated by Pearson’sχ2-test, which was applied
as suggested by (Baltas and Grassman, 1997). The χ2 value, although
referred to as a measure of goodness of fit, actually represents a measure of lack of fit and it should thus be as low as possible. This means that the smaller theχ2 or the reducedχ2values (taking into account the number
of degrees of freedom, DF, that is the number of datapoints in the particular dataset reduced by the number of parameters in the respective model), the better the overall fit of the model or the better the dose-response curve agrees with the experimental data, when the volume effect has been removed. An intercomparison of the fitting of the models to the experimental data was done using the F-test method. The main principle of this method is to per-form a comparison between a given model and a reference model by com-paring their fitted results to the experimental data. The Pχ value is a
prob-ability distribution calculated for the χ2 value for the reference model
di-vided by the χ2 value for the model it is being compared to. The smaller
the Pχ value, the better the compared model is in comparison to the reference
model. The value of Pχ = 0.5means that the compared model and the
refer-ence one are identical; for Pχ< 0.5the compared model is better than the
ref-erence one, while for Pχ> 0.5the reference model is better. For
intercompari-son of the overall fits of the models, the commonly used Gaussian distribution model was chosen as reference. In order to compare fits of the models with-out volume effect, their overall fits were compared with the corresponding fits
4.2 Example of models fitting to experimental data
without the volume effect for each individual model separately. For a more thorough discussion of the mentioned methods, see Collett (1991).
4.2.1 Results of comparison using the likelihood function
The best estimates as well as the 68% confidence intervals (corresponding to one standard deviation for standard distribution) for the parameters (D50, γ50and the respective volume parameters) of all models are given in Table 4.2.
In this Table a comparison of the maximum likelihood results can be made for the respective endpoint. The values for the logarithm of the likelihood function (Log-likelihood) as well as the χ2, the number of degrees of
free-dom (DF) and reducedχ2 values are given. Based on parameters from this
table the associated dose-response curves were plotted in Figure 4.2 for each of the models, respectively.
4.2.2 Results of comparison using the F test
Table 4.2 presents also results of the model comparison when the F test method was used. The values of Pχ are given in the last column, i.e. the distribution function for the χ2 ratio, where DF for separate fits
are the numerator and DF for the overall fit is the denominator degrees of freedom.
4.2.3 Conclusions from the model comparison
From the presented results one can clearly see that the diffrences in fitting the experimental data by the different models are rather small with a few exceptions. One should also remember that the confidence intervals are rather large. The reason for this is their experimental uncertainty with such a small number of data points. There may also be fine differences in the results caused by small errors within the experimental dataset. Based on the results in Table 4.2 and Figure 4.2 the following general conclusions can be drawn:
1. The Gaussian model is a symmetric sigmoid, which may be suboptimal for describing the response of some normal tissues (cf. 4 below).
2. The relative seriality model, having "fine-tuning" ability with the relative seriality parameter s may be most suitable for fitting mixed parallel and serial to mainly serial tissues.
3. For white matter necrosis most of the models gave a good fit, with the following exceptions:
4 Dose response models
• the fitting results of the inverse tumor and the critical element models were considerably worse (showing much lower Log-likelihood values) than the other models, taking the volume effect into account,
• when making a fit without the volume effect the Gaussian model gave inferior results with the lowest Log-likelihood,
• the Weibull distribution model was the only one giving better overall fit than the Gaussian distribution model (we chose the Gaussian model as the reference model in the F test and although this model is most commonly used, our results show it is not always the best),
• the Gaussian distribution, the parallel architecture and the Weibull distribution models were best handling the volume effect, giving best F test results.
4. Testing the dose-response curve shape without considering the volume de-pendance the Gaussian model gave the worst fit.
In clinical radiotherapy there is an increasing need of accurate models capable of describing the normal tissue response as a function of the dose and the irradiated volume. The present study gives an overview of the main existing models that are most frequently used. However, still more effort has to be given to radiobiological studies that can develop improved models suitable for biologically optimized radiotherapy planning.
Most modern radiobiological models have the potential to be used in radiobiologically optimized radiation therapy if they accurately describe the volume dependence and result in a good sigmoid dose-response curve. The models used here are good enough for both these aspects.
The separation of the volume effect from the sigmoid shape generating part in the models also opens up the possibility of novel combinations of them like e.g. relative seriality together with a binomial sigmoid.
Today all organs are assumed to be totally homogeneous and amorphous, without internal structure, even if we know that some organ regions are more sensitive and others more tolerant to irradiation. In the future such variations need to be considered, eg. by splitting the hilus region from the rest of the organ in most organs of mixed serial-parallel organization. Fortunately this problem has not been a major problem in this study. However, if the dataset had information where white and gray matter were separatey irradiated, this would have changed the situation since they have different sensitivity as shown in Paper I.
4.2 Example of models fitting to experimental data Table 4.2: Model parameter values for white matter necrosis. P arameters are gi ven with their 68% confidence interv als. LL stands for the log arithm of the lik elihood function. name of the model D50 ,Gy γ50 volume parameters LL χ 2 DF red. χ 2 Pχ critical volume 20.70 (20.25–21.18) 3.20 (2.57–3.29) M =20 (18–21), -35.57 12.75 10 1.28 0.57 N =397 (320–431) no volume ef fect -31.99 4.57 8 0.57 0.92 relati ve seriality 21.30 (21.14–21.54) 3.99 (3.64–4.41) s=0.01 (0.01–0.01) -35.25 14.09 11 1.28 0.63 no volume ef fect -31.92 4.84 8 0.61 0.93 critical element 24.20 (23.14–26.03) 0.99 (0.73–1.27) — -47.26 25.76 12 2.15 0.90 no volume ef fect -31.92 4.84 8 0.61 0.99 in verse tumor 19.47 (17.51–21.48) 0.99 (0.80–1.17) k=-3.05 (-3.59– -2.53) -40.17 16.89 11 1.54 0.73 no volume ef fect -31.92 4.84 8 0.61 0.96 Gaussian distrib ution 20.96 (20.46–21.71) 4.03 (3.31–4.70) n=0.62 (0.58–0.66) -35.98 11.46 11 1.04 0.50 no volume ef fect -33.41 5.56 8 0.70 0.84 parallel architecture 21.17 (17.97–30.38) 3.89 (3.15–5.10) v50 =0.14 (0.13–0.16), -34.29 11.52 10 1.15 0.51 σv =0.03 (0.02–0.03) no volume ef fect -32.10 5.02 8 0.63 0.87 W eib ull distrib ution 22.77 (22.59–23.35) 3.20 (2.49–3.95) B =0.63 (0.59–0.66) -35.44 10.33 11 0.94 0.43 no volume ef fect -31.62 4.26 8 0.53 0.89