http://www.diva-portal.org
This is the published version of a paper published in Work, Aging and Retirement.
Citation for the original published paper (version of record):
Agahi, N., Kelfve, S., Hassing, L B., Lindwall, M. (2021)
Alcohol Consumption Over the Retirement Transition in Sweden: Different Trajectories
Based on Education
Work, Aging and Retirement
https://doi.org/10.1093/workar/waab004
Access to the published version may require subscription.
N.B. When citing this work, cite the original published paper.
© The Author(s) 2021. Published by Oxford University Press. This is an Open Access article
distributed under the terms of the Creative Commons Attribution-NonCommercial License
(http://creativecommons.org/licenses/by-nc/4.0/), which permits non-commercial re-use,
distribution, and reproduction in any medium, provided the original work is properly cited.
For commercial re-use, please contact journals.permissions@oup.com
Permanent link to this version:
• 1 Decision Editor: Songqi Liu, PhD
Correspondence concerning this article should be addressed to Neda Agahi, Aging Research Center, Karolinska Institutet Tomtebodavägen 18A, 171 65 Stockholm, Sweden. E-mail: neda.agahi@ki.se
© The Author(s) 2021. Published by Oxford University Press.
Alcohol Consumption Over the Retirement
Transition in Sweden: Different Trajectories Based
on Education
Neda Agahi
1,
Susanne Kelfve
1,2, Linda B. Hassing
3, and Magnus Lindwall
3,41. Aging Research Center, Karolinska Institutet/Stockholm University, Stockholm, Sweden 2. Department of Culture and Society, Linköping University, Linköping, Sweden
3. Department of Psychology, University of Gothenburg, Gothenburg, Sweden 4. The Swedish School of Sport and Health Sciences, Stockholm, Sweden
ABSTR ACT
Retirement is a major life transition that involves changes to everyday routines, roles, and habits. Previous studies suggest that retirement may influence drinking habits. Many natural inhibitors of alcohol consumption disappear with the removal of work constraints. The potential impact depends on both individual and contextual factors. Women in the cohorts undergoing retirement now have been more active on the labor market, including the occupa-tion of higher status jobs, which indicates more financial resources as well as a larger role loss after retirement. Also, the current cohorts who retire have had more liberal drinking habits throughout their lives compared to previous cohorts. We therefore examined changes in alcohol consumption surrounding retirement in different education groups among women and men undergoing retirement using annual data from the Health, Aging and Retirement Transitions in Sweden (HEARTS) study, a longitudinal national study of 60- to 66-year-olds (n = 5,913), from 2015
to 2018. Latent growth curve models were used to estimate trajectories of alcohol consumption. Results showed that those who retired during the follow-up increased their usual weekly alcohol consumption while those who worked or were retired throughout the period had stable drinking habits. Those who were retired reported the highest al-cohol consumption. The increase surrounding retirement was driven by people with higher education. Women with tertiary education and men with intermediate or tertiary education increased their weekly alcohol intake after retire-ment, while those with low education had unchanged drinking habits. Mechanisms and motivations that may fuel increased alcohol intake among people with higher education should be further investigated.
Retirement is one of the major life transitions that occur over the life course. It affects roles and statuses, both work-related and social ones (e.g., Wang & Shultz, 2010; Carter & Cook, 1995). It also af-fects the daily structure, since various constraints (and facilitators) that are put on everyday habits and routines are removed. Studies have shown that following retirement, there are increases in seden-tary behavior (Leskinen et al., 2018), in sleep duration (Alhainen, Myllyntausta, Pentti, Vahtera, & Stenholm, 2020), as well as in phys-ical activity (Stenholm et al., 2016), which suggests a slower and less stressful pace of everyday life where healthy habits can be fostered. Furthermore, with the removal of work constraints (e.g., time con-straints), many natural inhibitors of alcohol consumption disappear, which may lead to new drinking habits and intensified drinking. On the other hand, the removal of work-related activities and roles that often include alcohol consumption, such as after-work get-togethers
or social engagement with customers, may lead to decreased alcohol consumption (Bamberger, 2015). These work-related roles may how-ever be replaced with social roles and activities that include alcohol consumption.
In a review study of the literature on the impact of retirement on drinking patterns, Kuerbis and Sacco (2012) found that retirement may not have a strong direct impact on drinking behaviors. Instead, they concluded that contextual aspects and individual attributes, such as gender and pre-retirement conditions, in conjunction with retirement, demonstrate clearer influences. These findings were supported by the English Longitudinal Study of Ageing, in which there was no definitive association between retirement and drinking behaviors (Holdsworth et al., 2017). Other recent studies suggest that alcohol consumption does increase after retirement and that gender and socioeconomic position are factors that may
Empirical Article
2 • Alcohol Consumption Over the Retirement Transition
differentiate groups at risk (e.g., Halonen et al., 2017; Wang, Steier, & Gallo, 2014; Zins et al., 2011). For example, findings from the Health and Retirement Study (HRS) in the United States showed that men but not women increased their drinking after retirement (Wang et al., 2014). In a Finnish study, Halonen and colleagues (2017) found that temporary risky drinking following the retire-ment transition occurred in about 12% of retirees, while 7% were risky drinkers already before retirement and slowly decreased their alcohol consumption after retirement. Both of these groups of re-search subjects were predominantly male, worked in metropolitan areas, reported depressive symptoms, and smoked. The continuous risky drinkers also belonged to advantaged socioeconomic groups to a higher extent. In a French study by Zins and colleagues (2011), results showed that men in all socioeconomic groups in-creased heavy drinking surrounding the retirement period but then gradually decreased drinking during the following years. Among women, a similar increase was reported surrounding retirement in all socioeconomic groups, but the decrease thereafter was less ap-parent, particularly among women in higher socioeconomic posi-tions where drinking habits seemed to remain on the same elevated level. These studies suggest that gender and socioeconomic differ-ences in drinking habits surrounding retirement should be investi-gated further.
Relating to gender, there are large differences between women and men when it comes to drinking habits as well as retirement paths and motivations. Older men still drink more, but alcohol consump-tion, including risky drinking, has particularly increased among older women (Raninen & Agahi, 2020; Waern, Marlow, Morin, Ostling, & Skoog, 2014), suggesting that gender norms regarding drinking are changing. In addition, more women are in the labor market today, and have been throughout their lives, including those holding higher occu-pational positions (Parker & Agahi, 2013). This affects their role and status as well as financial resources during working life, but also their potential role and status loss after retirement (Price, 2000), especially compared to earlier birth cohorts with high proportions of house-wives (e.g., Parker & Agahi, 2013). These changing circumstances in-dicate that many results from earlier birth cohorts regarding changes in drinking habits surrounding retirement may not be generalizable to the current ones, especially for women.
When it comes to socioeconomic position, we know from past research that more advantaged socioeconomic groups drink more frequently and larger amounts than less advantaged groups (e.g., Kelfve, Agahi, Darin Mattsson, & Lennartsson, 2014), and the latter group suffers more adverse consequences of alcohol consumption (e.g., Bellis et al., 2016). After retirement, advantaged socioeconomic groups have more resources to engage in social and cultural activities and travel, which in turn commonly involves alcohol consumption (Agahi, Dahlberg, & Lennartsson, 2019). This suggests that advan-taged socioeconomic groups may increase their alcohol consumption more after retirement compared to their less advantaged counterparts. Furthermore, role loss following retirement may be more pronounced and stressful in higher and more qualified socioeconomic groups (Price, 2000), similar to findings relating to consequences of un-employment in different socioeconomic groups (Montgomery et al., 2013).
An additional factor that may lead to increased post-retirement al-cohol consumption in the cohorts undergoing the retirement process
now, is that a higher proportion drink alcohol compared to earlier cohorts, and have done so throughout their lives (Ahacic, Kennison, & Kåreholt, 2012). Alcoholic beverages have been more access-ible during their lifetimes compared to the cohorts before them and norms concerning when and where to drink have been generally looser (Ahacic et al., 2012; Waern et al., 2014).
Thus, new studies are needed to further investigate changes in alcohol consumption surrounding retirement. This study uses a national sample with annual data collections, where people with higher education, including women with higher education, are properly represented. These groups are growing in the older popu-lation and retirement effects and lifestyle habits need to be investi-gated further.
Therefore, the aim of this study is to investigate changes in alcohol consumption during the transition into retirement in current cohorts of women and men undergoing the retirement process and to examine whether there are differences between education groups in the trajec-tories of alcohol consumption surrounding retirement.
M ETHODS
Data and Study Population
We used four waves of data from the Health, Aging, and Retirement Transitions in Sweden (HEARTS) study. HEARTS is a nationally representative, longitudinal study with annual measurements (see Lindwall et al., 2017 for a description of the HEARTS study). The survey is conducted primarily online using a web survey, but a paper version is also offered in the last reminder and chosen by a portion of the participants (about 31% in the first wave; see Lindwall et al., 2017). Of a nationally representative sample of people between 60 and 66 years of age at baseline (N = 14,990), 5,913 individuals ticipated in the first assessment in 2015. In 2016, 4,651 people par-ticipated in wave 2, 4,320 in wave 3 in 2017, and 4,033 in wave 4 in 2018. In the first wave, 64.1% of the participants reported not being retired (still working). In waves 2, 3, and 4, the proportion of partici-pants not being retired decreased to 48.9%, 36.0%, and 25.6%, respect-ively. Consequently, at wave 4, roughly 75% of the sample reported having retired; about 23% of these participants, however, reported still working to some degree. In the first set of analyses, we included those who participated in all four waves of data collection and who provided information about retirement status (n = 3,152) in order to examine both the two stable groups (working and retired throughout the follow-up period) and the three change-groups (retired at different time points during the follow-up period). The second set of analyses focused on the retirement transition and therefore included those who retired during the follow-up period or who were retired at baseline, and who had reported their alcohol consumption at least once (n = 3,335). Those who reported working throughout the follow-up period were not included in the second set of analyses.
The two sets of analyses use slightly different samples and are therefore described separately (Table 1). In the second set of ana-lyses describing trajectories of alcohol consumption across the retire-ment transition, 52.7% were women and the mean age was similar for women and men. Among women, the largest education group was tertiary education (46.5%), whereas the largest group among men was intermediate education (46.4%). In both groups, the smallest cat-egory was the primary education.
Variables
Alcohol consumption was estimated using two questions regarding drinking frequency and usual amount of drinking per occasion. Using frequency and quantity items to estimate usual alcohol consumption is a common procedure (Room, 1990; Sobell & Sobell, 1995). Drinking frequency was measured with the question “How often have you been drinking alcohol during the last year?.” Response options were Once per month or more seldom (=0.25 times/week), 2–4 times per month (=0.75 times/week), 2–3 times per week (=2.5), and 4 times per week or more often (=5.5). Usual amount of drinking was measured with the question “How many drinks do you have on a typical day when you drink alcohol?.” An illustration of standard drink sizes for various alcoholic beverages was included in the questionnaire. Response op-tions were 1–2 drinks (=1.5), 3–4 (=3.5), 5–6 (=5.5), 7–9 (=8), 10 drinks or more (=10). By multiplying the frequency and amount items we got an estimation of usual alcohol consumption in standard units/ week (We also ran sensitivity analyses where “4 times per week or more often” was coded as 4.5 or 6.5 (instead of 5.5), and “10 drinks or more” as 11 or 12 (instead of 10). The same pattern of results was found in these analyses.).
Retirement status and retirement status change.
The following question was used to determine the participants’ re-tirement status “Are you retired (i.e., have started to receive old age pension)?.” Four different response options were available (a) No; (b) Yes – but continue working and do not perceive myself as a pensioner; (c) Yes – continue working but perceive myself as a pensioner; and (d) Yes – full-time retired. In terms of retirement status change throughout the study, those responding a or b at each time point were categorized as
working w1-w4, whereas those responding c or d at each time point were categorized as retired w1-w4. Those responding a or b at the first time point and c or d at the second time point were categorized as tran-sition w1-w2 and those responding a or b at the first and second time points and c or d at the third time point were categorized as transition w2-w3. Finally, participants responding a or b at the first three time points and c or d at the fourth time point were categorized as transition w3-w4. People who went back to working after being retired were ex-cluded from the analyses (n = 48).
Participants who had retired also reported the date (month and year) of their transition from work to retirement. The individual re-tirement date information (year of rere-tirement) was used in the second set of analyses to center the growth curve analyses around each individual’s retirement date.
Education.
Based on the question: “What is your highest level of education?” we created a three-level variable for education consisting of primary, inter-mediate, or tertiary education.
Statistical Analyses
The statistical analyses were performed in Mplus version 8.1 (Muthén & Muthen, 1998–2017) and the robust full information maximum likelihood estimator (MLR) was used to analyze the data. Item-level missing data was handled using the full information MLR (Enders, 2010).
In the first set of analyses, we used multi-group latent growth curve models (LGCM; Bollen & Curran, 2006; McArdle, 1988) to estimate trajectories of alcohol consumption across different retirement status
Table 1. Characteristics of the Two Subsamples Used in the Two Sets of Analyses
Sample Used in Analyses of Trajectories of Alcohol Consumption Across Retirement Status Groupsa
Total Age at baseline
Mean (SD) 63.1 (2.0)
Retirement status change group, % (n)
Working w1-w4 35.9 (1132) Retired w1-w4 25.6 (808) Transition w1-w2 13.6 (429) Transition w2-w3 13.0 (410) Transition w3-w4 11.8 (373) Total 100.0 (3152)
Sample used in analyses of trajectories of alcohol consumption across the retirement transition by educationb
Women Men Total
Age Mean (SD) 64.1 (1.7) 63.9 (1.7) 64.0 (1.7) Education, % (n) Primary 13.5 (238) 16.7 (263) 15.0 (501) Intermediate 39.9 (702) 46.4 (732) 43.0 (1434) Tertiary 46.5 (818) 36.9 (582) 42.0 (1400) Total 100.0 (1758) 100.0 (1577) 100.0 (3335)
Note. aIncluding all who have information about retirement status all four waves. bIncluding all participants with information on retirement year, education, and sex.
4 • Alcohol Consumption Over the Retirement Transition
change groups. More specifically, we compared the alcohol consump-tion trajectories across five groups: (a) participants constantly working across all four waves (working w1-w4); (b) participants being con-stantly retired across all four waves (retired w1-w4); (c) participants changing status from work to retirement between waves 1 and 2 ( tran-sition w1-w2); (d) participants changing status from work to retirement between waves 2 and 3 (transition w2-w3); and (e) participants chan-ging status from work to retirement between waves 3 and 4 (transition w3-w4). The rationale underlying this analytical design was to use the constantly working and constantly retired groups as control-groups for the three retirement status change groups (groups c–e), thereby con-trolling for general trends in terms of change in alcohol consumption not directly driven by the retirement transition.
In the second set of analyses, we only included participants who retired during the study period (between waves) or who were retired at the beginning of the study period. We used each participant’s scores in alcohol consumption (drinks/week) at each time point across four waves as input in the growth curve models. Gender and education sub-groups were used as moderating variables in the analyses to investigate the groups for which alcohol consumption changed surrounding re-tirement. Instead of using time in study as the time structure in the growth models (as we did in the first set of analyses), we here used time to/from retirement (measured in years, based on each individual’s self-reported date of retirement) and thereby individualized time scores linked to distance to/from retirement. Retirement date was only avail-able for participants completing the web-survey, not the paper survey. Therefore, participants who used the paper-survey at any wave were not included in the second set of analyses. The constantly working par-ticipants were also excluded from these analyses as they naturally did not have any retirement date reported.
In latent growth curve models, typically four different parameters are of main interest: the mean intercept, the mean slope, the intercept variance, and slope variance. In the first set of analyses, the mean inter-cept represents average alcohol consumption in the unit of standard
drinks per week at the first measurement (wave 1) and the mean slope the average change per year, as the measurements were annual. In the second set of analyses, when the time structure was centered around each individual’s retirement year, the mean intercept means the average alcohol consumption at the year of retirement, whereas the mean slope represents average change per year during the study period which in-cludes the retirement transition. The intercept variance and slope variance represent individual differences around the group mean in starting point (intercept) and change (slope).
R ESULTS
Table 2 describes the drinking habits at baseline for the two sub-samples as well as for the whole HEARTS study sample. Correlations between the study variables can be found in Supplementary Table 1.
Trajectories of Alcohol Consumption Across Retirement
Status Groups
In the first tested multi-group latent growth curve model, the slope variance in the group retiring between wave 1 and 2 was negative. When this parameter was set to 0, the model terminated normally. The model fit of this model was adequate, χ 2 (27) = 291.61, p <
.001, CFI = 0.97, TLI = 0.97, RMSEA = 0.13, 90% confidence interval 0.11–0.13, SRMR = 0.07 (Some fit indices (in particular RMSEA) indicated that the multi-group model did not fit data so well. As an alternative, we therefore fitted a MIMIC model using re-tirement status information as dummy-variables to predict baseline level (intercept) and change (slope) in alcohol consumption. The fit of this model was better (CFI = 0.99; RMSEA = 0.039 (90% CI: 0.030–0.047). The patterns of results were the same as the multi-group model, but less straightforward to interpret as the estimates for the retirement groups (dummy variables) are presented in rela-tive terms in comparison to a reference group. We therefore chose to present the results from the multi-group analyses, since the esti-mates are easier to interpret.). When adding quadratic slopes, none
Table 2. Drinking Habits at Baseline in the Total HEARTS Study Sample and Two Subsamples in This Study
Total HEARTS sample (n = 5,913) Subsample 1 (n = 3,152) Subsample 2 (n = 3,335)
% (no) % (no) % (no)
Drinking frequency
4+ times/week 5.5 (326) 6.3 (199) 6.5 (218)
2–3 times/week 25.1 (1481) 27.4 (862) 28.0 (935)
2–4 times/month 35.6 (2103) 37.5 (1182) 36.2 (1208)
Once per month or more seldom 14.4 (851) 13.7 (433) 13.3 (442)
Never 13.2 (779) 11.6 (364) 11.8 (392)
Missing 6.3 (372) 3.6 (112) 4.2 (140)
Usual drinking amount
Does not drink 13.2 (779) 11.6 (364) 11.8 (392)
1–2 drink 48.3 (2858) 52.4 (1653) 52.7 (1757) 3–4 drinks 26.2 (1546) 26.9 (848) 26.3 (77) 5–6 drinks 5.5 (325) 5.3 (167) 4.9 (162) 7–9 drinks 1.1 (64) 1.0 (30) 1.0 (34) 10+ drinks 0.3 (19) 0.3 (9) 0.3 (9) Missing 5.5 (322) 2.6 (81) 3.1 (104)
Glasses/week, mean (SE) 3.5 (0.07) 3.7 (0.09) 3.7 (0.09)
of these parameters were significant for any of the groups. Also, this model resulted in an inadmissible solution with a number of nega-tive variances. Therefore, we did not include quadratic slopes in the model.
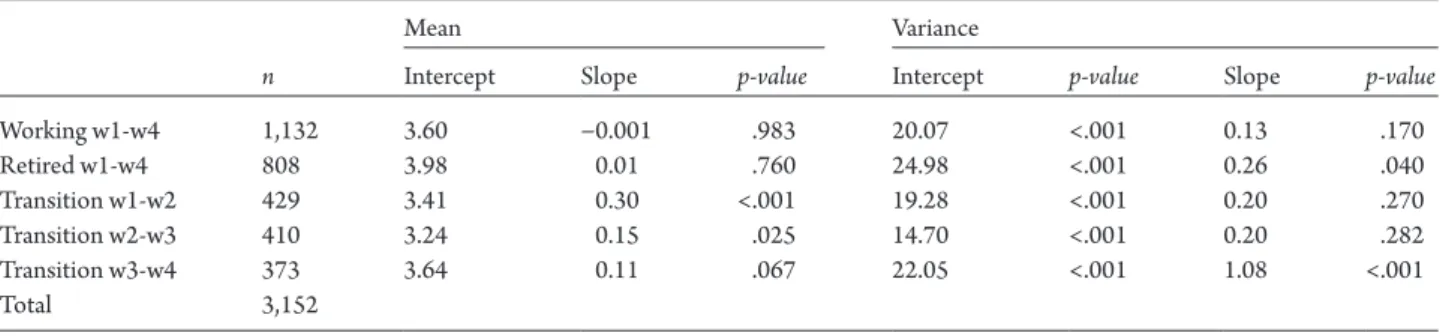
Table 3 describes the results of the models, the means of inter-cept and slope, and interinter-cept and slope variances. The highest levels of alcohol consumption at baseline was found among those retired throughout the period (mean intercept = 3.98 units/week), followed by those working throughout the period, and those retiring between the last two waves. The lowest baseline level was found in the group that retired between wave 2 and 3. With regard to changes over time, trajec-tories of alcohol consumption among those either working or retired throughout the period displayed stability across the four waves, mir-rored by non-significant slopes. In contrast to the trend of stability in these two groups, alcohol consumption increased in participants with a retirement transition between wave 1 and wave 2 (mean slope = 0.30, p < .001), and between wave 2 and 3 (mean slope = 0.15, p = .025). The mean slope of the group that retired most recently (between wave 3 and 4) was also positive, indicating an increase in alcohol consumption, but did not reach statistical significance (mean slope = 0.11, p = .067). Comparing the slopes in the different groups, there were significant differences between the group that had a retirement transition w1-w2 compared with the groups working throughout w1-w4 (Δ χ 2 = 12.27/
1 df, p < .001) and retired throughout w1-w4 (Δ χ 2 = 10.41/ 1 df, p
< .001). Similarly, there were significant differences in slopes between the group that transitioned between w2-w3 and the groups working throughout w1-w4 (Δ χ 2 = 3.85/ 1 df, p = .049), retired throughout
w1-w4 and those with a retirement transition w3-w4 (Δ χ 2 = 5.00/ 1 df,
p = .025). No other differences between slopes were significant. In terms of heterogeneity of change, there was significant between-person variability in change in the group retired throughout w1–w4 (slope variance = 0.26, p = .04) and the group that retired between w3 and w4 (slope variance = 1.08, p < .001).
Trajectories of Alcohol Consumption Across the
Retirement Transition, by Education and Gender
The model using individually observed time scores (time to/from re-tirement) terminated normally. No traditional fit indices are provided, because calculation of standardized coefficients and chi-square is not possible in the required type of analyses for these models in MPLUS (TYPE=RANDOM). No quadratic slopes (non-linear changes) were significant, so these were not included in the models. Looking at all participants who retired during or prior to the study period (upper part of Table 4), the average alcohol consumption was about 3.6
standard drinks of alcohol per week in the year of retirement (mean intercept = 3.63). There was, however, significant between-person vari-ability in consumption at retirement year (intercept variance = 17.55, p < .001), which indicates that individuals differed with regard to the number of drinks they consumed per week. Across the four annual measurements, there was a significant average increase by about 0.13 drinks per week per year (p < .001) in the years following retirement. There was no significant between-person variability in change (slope variance = 0.06, p = .64), indicating that the change in alcohol con-sumption over time was similar across individuals.
With regard to gender, men reported higher alcohol consump-tion at the retirement year compared to women (mean intercept for men = 4.63 units/week and for women = 2.72 units/week). For both women and men alcohol consumption increased during the years after retirement (mean slope for men = 0.15, p < .001, and for women = 0.11, p < .001). There was no significant between-person variability in change for either women or men.
In terms of education, the primary education group displayed the lowest consumption level (mean intercept = 2.93) at the year of retire-ment and stability in the years after retireretire-ment (mean slope = 0.01, p = .87). The intermediate education group displayed somewhat higher consumption levels at retirement year (mean intercept = 3.47) and a significant increase in the years following retirement (mean slope = 0.11, p < .001). The tertiary education group reported the highest levels of alcohol consumption at year of retirement (mean intercept = 4.06) and a significant increase after retirement (mean slope = 0.18, p < .001).
Looking at levels and change in alcohol consumption after re-tirement among women and men in different education groups dis-played a similar pattern. Lower levels of weekly alcohol consumption and stable patterns over the retirement transition and over time were found among both women and men with primary education, (mean intercept for men = 3.80, mean slope = 0.03, p = .74, and for women mean intercept = 1.91, mean slope = 0.02, p = .62). Among men, both intermediate and tertiary education groups reported a higher alcohol consumption at the year of retirement and a significant increase in consumption after retirement (intermediate education mean inter-cept = 4.35, mean slope = 0.18, p < .001; tertiary education mean intercept = 5.38, mean slope = 0.17, p < .004). Among women, the level of alcohol consumption was also higher in the intermediate and tertiary education groups, but an increase after retirement was only found in the tertiary education group (intermediate education mean intercept = 2.57, mean slope = 0.05, p = .15; tertiary education mean intercept = 3.1, mean slope = 0.18, p < .001).
Table 3. Trajectories of Alcohol Consumption (Units/Week) Across Retirement Status Groups, n = 3,152
Mean Variance
n Intercept Slope p-value Intercept p-value Slope p-value
Working w1-w4 1,132 3.60 −0.001 .983 20.07 <.001 0.13 .170 Retired w1-w4 808 3.98 0.01 .760 24.98 <.001 0.26 .040 Transition w1-w2 429 3.41 0.30 <.001 19.28 <.001 0.20 .270 Transition w2-w3 410 3.24 0.15 .025 14.70 <.001 0.20 .282 Transition w3-w4 373 3.64 0.11 .067 22.05 <.001 1.08 <.001 Total 3,152
6 • Alcohol Consumption Over the Retirement Transition
DISCUSSION
In this study, we used annual individual-level data to investigate if and how drinking habits change surrounding retirement in current cohorts undergoing this transition. Results show that individuals who undergo the retirement transition during the study period have increasing tra-jectories of drinks per week, while those who either work or are re-tired throughout the period have stable drinking habits. Those who are retired throughout the period have the highest alcohol consumption. With regard to gender and educational differences, results show that men drink more than women, and that there is an educational gradient with higher consumption at higher levels of education. Surrounding the retirement transition, women with tertiary education and men with intermediate or tertiary education increase their weekly alcohol intake, while men with primary education and women with primary or intermediate education do not change their weekly alcohol consump-tion. Taken together, these findings suggest that people who are retired drink more than those who are still working, and that the increase in alcohol consumption takes place around the retirement transition, pri-marily driven by people with higher education.
Our results confirm previous findings from other countries showing an association between retirement and increased alcohol consumption (e.g., Halonen et al., 2017; Perreira & Sloan, 2001; Zins et al., 2011; Wang et al., 2014). It also highlights the fact that the in-crease is predominantly found among people with higher education, both women and men, who also have a higher alcohol intake already before retirement. There are several possible explanations for an in-crease in consumption in higher socioeconomic groups. Compared to lower socioeconomic groups, they are likely in better health, which en-ables and facilitates alcohol consumption, and have more financial re-sources to partake in various activities, that in turn commonly involve alcohol consumption (e.g., Agahi et al., 2019; Holdsworth et al., 2017). Another explanation may be that the negative side of retirement, such as the role loss and loss of daily structure, is more pronounced and difficult to adjust to among more advantaged socioeconomic groups, in particular the status loss related to the work identity (Price, 2000). Along these lines, the so-called disappointment paradox suggests
that unexpected hardships may be worse for higher socioeconomic groups partly because they are less used to meet and cope with them (Montgomery et al., 2013). Consequently, increased alcohol con-sumption may be a way to cope with the stress caused by the losses and adjustments that retirement, at least initially, entails for some people (Bamberger, 2015). This is also in line with the review findings of Kuerbis and Sacco (2012), who suggested that it is not retirement per se that impacts drinking habits, but rather the nature of the retirement transition such as the circumstances and context surrounding work and roles, as well as voluntariness of retirement. Yet another mech-anism may be that lost work-related roles are replaced with new social roles that involve alcohol consumption.
In line with previous findings, our results showed that women gen-erally have a lower alcohol intake than men, about two drinks less per week, and the increase over the retirement transition was also slightly smaller overall. Gender differences in alcohol consumption may par-tially have biological explanations as men in general tolerate more alcohol than women do, but they may also be explained by differ-ences in societal norms as well as differdiffer-ences in support seeking and coping styles (Dawson, Grant, & Ruan, 2005; Wilsnack, Wilsnack, Kristjanson, Vogeltanz-Holm, & Gmel, 2009). These gender roles and norms are gradually loosening. Notably, however, among women with tertiary education, the mean weekly intake and the increase after retire-ment resemble the drinking patterns of men. They are also in line with findings from France where women in higher occupations maintained their elevated heavy drinking habits long after the retirement transition (Zins et al., 2011). Whether these changes can be attributed to lost (or gained) roles remains to be investigated. This group warrants more study in order to shed more light on the mechanisms and motivations that may fuel this increase.
As with all studies, these findings should be interpreted in light of certain limitations and strengths. This is the first retirement study with annual follow-ups to investigate within-person changes in alcohol consumption in a national sample, rather than samples connected to certain workplaces or work sectors, which makes re-sults more generalizable. Also, since data were recently collected,
Table 4. Trajectories of Alcohol Consumption Across the Retirement Transition by Education Level and Gender, n = 3335
Mean Variance
n Intercept Slope p-value Intercept p-value Slope p-value
All Primary education 501 2.93 0.01 .87 17.15 .007 0.02 .933 Intermediate education 1,434 3.47 0.11 .001 15.07 <.001 0.05 .795 Tertiary education 1,400 4.06 0.18 .001 20.02 <.001 0.07 .670 Total 3,335 3.63 0.13 <.001 17.55 <.001 0.06 .638 Men Primary education 263 3.80 0.03 .735 26.80 .028 0.05 .914 Intermediate education 732 4.35 0.18 <.001 20.03 <.001 0.12 .760 Tertiary education 582 5.38 0.17 .004 29.74 <.001 0.05 .878 Men total 1,577 4.63 0.15 <.001 24.51 <.001 0.09 .740 Women Primary education 238 1.91 0.02 .616 5.15 <.001 0.01 .912 Intermediate education 702 2.57 0.05 .151 9.13 <.001 0.05 .733 Tertiary education 818 3.06 0.18 <.001 10.67 <.001 0.37 .100 Women total 1,758 2.72 0.11 <.001 9.44 <.001 0.17 .159
results are generalizable to current cohorts of retirees. On the other hand, because it is a web survey, there is a lower response rate among people with lower education (Lindwall et al., 2017). This underrepresentation might have led to an underestimation of drinking habits in the primary education group. However, the es-timates reported in the tables are not relative measures comparing educational groups to one another, and the educational differences in drinking patterns are clear among both women and men, thereby giving support to the robustness of the results. An additional tation is the measurement of alcohol consumption. The main limi-tation of the items used in this survey is that they are very likely to underestimate the true alcohol intake. First, the response options of the frequency question are rather crude, with the most frequent category being “4 times or more per week.” After retirement, fre-quency of alcohol consumption might increase, particularly in that category. Second, questions only concern usual drinking habits— there is no question about occasional episodes of binge drinking— which further underestimates weekly alcohol intake.
Nevertheless, despite the risk that alcohol intake is underesti-mated, we find significant within-person changes over time. The size of the increase we find is rather small however; at most an increase of 0.30 drinks/week on a yearly basis among individuals retiring be-tween wave 1 and 2. Although the size of the increase is likely under-estimated, it indicates that the magnitude of change is not such that people in general are at risk of problematic drinking following retire-ment. However, increases in population drinking generally translate into increases in heavy drinking (Skog, 1985; Rossow, Mäkelä, & Kerr, 2014). Considering that the body’s ability to metabolize and handle alcohol decreases with age (Anderson, Scafato, & Galluzzo, 2012; Heuberger, 2009), the increased drinking among newly retired and older people might have both social and health consequences, and as such should be further studied.
SUPPLE M EN TARY M ATER IAL
Supplementary data is available at Work, Aging, and Retirement online.
ACKNOWLED G M EN TS
Funding was obtained from the Alcohol Research Council of the Swedish Alcohol Retailing Monopoly (grants 0051 and 2018-0074) and FORTE (The Swedish Research Council for Health, Working Life and Welfare; grants 2013-2300 and 2019-01100). The HEARTS research program is supported by funding from FORTE, grant 2013-2291.
R EFER ENCES
Agahi, N., Dahlberg, L., & Lennartsson, C. (2019). Social integra-tion and alcohol consumpintegra-tion among older people: A four-year follow-up of a Swedish national sample. Drug Alcohol Depend, 196, 40–45. doi:10.1016/j.drugalcdep.2018.12.011
Ahacic, K., Kennison, R. F., & Kåreholt, I. (2012). Changes in sobriety in the Swedish population over three decades: Age, period or co-hort effects? Addiction, 107, 748–755
Alhainen, M., Myllyntausta, S., Pentti, J., Vahtera, J., & Stenholm, S. (2020). Concurrent changes in sleep and physical activity during the transition to retirement: A prospective cohort study. Sleep Medicine, 68, 35–41.
Anderson, P., Scafato, E., & Galluzzo, L. (2012). Alcohol and older people from a public health perspective. Annali dell’Istituto Superiore di Sanità, 48(3), 232–247. doi:10.4415/ann_12_03_04 Bamberger, P. A. (2015). Winding down and boozing up: The complex
link between retirement and alcohol misuse. Work, Aging And Retirement, 1, 92–111.
Bellis, M. A., Hughes, K., Nicholls, J., Sheron, N., Gilmore, I., & Jones, L. (2016). The alcohol harm paradox: Using a national survey to explore how alcohol may disproportionately impact health in deprived individuals. BMC Public Health, 16, 111. Bollen, K. A., & Curran, P. J. (2006). Latent Curve Models: A Structural
Equation Perspective. Hoboken, NJ: John Wiley & Sons, Inc. Carter, M. A. T., & Cook, K. (1995). Adaptation to retirement: Role
changes and psychological resources. The Career Development Quarterly, 44, 67–82. doi:10.1002/j.2161-0045.1995.tb00530.x Dawson, D. A., Grant, B. F., & Ruan, W. J. (2005). The association
be-tween stress and drinking: Modifying effects of gender and vulner-ability. Alcohol Alcohol, 40, 453–460.
Enders, C. K. (2010). Applied missing data analysis. New York, NY: Guilford Press.
Halonen, J. I., Stenholm, S., Pulakka, A., Kawachi, I., Aalto, V., Pentti, J., Lallukka, T., Virtanen, M., Vahtera, J., & Kivimäki, M. (2017). Trajectories of risky drinking around the time of statutory re-tirement: A longitudinal latent class analysis. Addiction, 112(7), 1163–1170
Heuberger, R. A. (2009). Alcohol and the older adult: A comprehen-sive review. J Nutr Elder, 28, 203–235
Holdsworth, C., Frisher, M., Mendonca, M., de Oliveira, C., Pikhart, H., & Shelton, N. (2017). Lifecourse transitions, gender and drinking in later life. Ageing and Society, 37(3), 462–494. doi:10.1017/ S0144686X15001178
Kelfve, S., Agahi, N., Darin Mattsson, A., & Lennartsson, C. (2014). Increased alcohol use over the past 20 years among the oldest old in Sweden. Nordic Studies on Alcohol and Drugs, 31(3), 245–260.
Kuerbis, A., & Sacco, P. (2012). The impact of retirement on the drinking patterns of older adults. Addict Behav, 37, 587–595 Leskinen, T., Pulakka, A., Heinonen, O. J., Pentti, J., Kivimäki, M.,
Vahtera, J., & Stenholm, S. (2018). Changes in non-occupational sedentary behaviours across the retirement transition: The Finnish Retirement and Aging (FIREA) study. J Epidemiol Community Health, 72, 695–701.
Lindwall, M., Berg, A. I., Bjälkebring, P., Buratti, S., Hansson, I., Hassing, L., Henning, G., Kivi, M., König, S., Thorvaldsson, V., & Johansson, B. (2017). Psychological Health in the Retirement Transition: Rationale and First Findings in the HEalth, Ageing and Retirement Transitions in Sweden (HEARTS) Study. Front Psychol, 8, 1634.
McArdle, J. J. (1988). Dynamic but structural equation modeling of repeated measures data. In Handbook of multivariate experimental psychology (pp. 561–614). Boston, MA: Springer.
Montgomery, S., Udumyan, R., Magnuson, A., Osika, W., Sundin, P. O., & Blane, D. (2013). Mortality following unemployment during an economic downturn: Swedish register-based cohort study. BMJ Open, 3(7), e003031
Muthén, L. K., & Muthén, B. O. (1998–2017). Mplus user’s guide (8th ed.). Los Angeles, CA: Muthén & Muthén.
8 • Alcohol Consumption Over the Retirement Transition
Parker, M. G., & Agahi, N. (2013). Cohort change in living condi-tions and lifestyle among middle aged Swedes: The effects on mor-tality and late-life disability. In C. Phellas (Ed.), Aging in European Societies. (p 237–253), New York: Springer.
Perreira, K. M., & Sloan, F. A. (2001). Life events and alcohol con-sumption among mature adults: A longitudinal analysis. Journal of Studies on Alcohol, 62(4), 501–508.
Price, C. A. (2000). Women and retirement: Relinquishing profes-sional identity. Journal of Aging Studies 14(1), 81–101.
Raninen, J., & Agahi, N. (2020). Country report: Trends in older people’s drinking habits, Sweden 2004–2017. Nordic Studies on Alcohol and Drugs. September 2020, doi:10.1177/1455072520954336. Room, R. (1990). Measuring alcohol consumption in the United
States: Methods and rationales. In: L. T. Kozlowski, H. M. Annis, H. D. Cappell, F. B. Glaser, M. S. Goodstadt, Y. Israel, H. Kalant, E. M. Sellers, E. R. Vingilis (Eds.), Research Advances in Alcohol and Drug Problems. (pp. 39–80),Vol. 10. New York: Plenum.
Rossow, I., Mäkelä, P., & Kerr, W. (2014). The collectivity of changes in alcohol consumption revisited. Addiction, 109(9), 1447–1455 Skog, O-J. (1985). The collectivity of drinking cultures: A theory of
the distribution of alcohol consumption. Br J Addict, 80, 83–99. Sobell, L. C., & Sobell, M. B. (1995). Alcohol Consumption Measures.
In J. P. Allen, M. Columbus (Eds), Assessing Alcohol Problems: A Guide for Clinicians and Researchers (pp. 55–73). Rockville, MD:
National Institute on Alcohol Abuse and Alcoholism Treatment Handbook Series 4.
Stenholm, S., Pulakka, A., Kawachi, I., Oksanen, T., Halonen, J. I., Aalto, V., Kivimäki, M., & Vahtera, J. (2016). Changes in physical activity during transition to retirement: A cohort study. Int J Behav Nutr Phys Act, 13, 51. Waern, M., Marlow, T., Morin, J., Ostling, S., & Skoog, I. (2014).
Secular changes in at-risk drinking in Sweden: Birth cohort com-parisons in 75-year-old men and women 1976–2006. Age and Ageing, 43(2), 228–234.
Wang, M., & Shultz, K. S. (2010). Employee retirement: A review and recommendations for future investigation. Journal of Management, 36, 172–206.
Wang, X., Steier, J. B., & Gallo, W. T. (2014). The effect of retirement on alcohol consumption: Results from the US Health and Retirement Study. European Journal of Public Health, 24(3), 485–489. Wilsnack, R. W., Wilsnack, S. C., Kristjanson, A. F.,
Vogeltanz-Holm, N. D., & Gmel, G. (2009). Gender and alcohol consump-tion: Patterns from the multinational GENACIS project. Addiction, 104(9), 1487–1500.
Zins, M., Guéguen, A., Kivimaki, M., Singh-Manoux, A., Leclerc, A., Vahtera, J., Westerlund, H., Ferrie, J. E., & Goldberg, M. (2011). Effect of retirement on alcohol consumption: Longitudinal evi-dence from the French Gazel cohort study. PLoS One, 6(10), e26531.