Are students acting rational?
A study in Behavioural finance
Master’s thesis within Business Administration
Author: Madeleine Akbas 880926
Tutors: Johan Eklund
Andreas Högberg
Master’s Thesis in Business Administration
Title: Are students acting rational?: A study in Behavioural finance
Author: Madeleine Akbas 880926
Tutors: Johan Eklund
Andreas Högberg
Date: 2011-05
Keywords: Behavioural finance, Affect heuristic, Efficient Market Hypothesis, Home bias
Abstract
Finance taught in schools generally starts with the efficient market hypothe-sis, which holds the assumptions of rational investors and markets where all information available is reflected. In recent years however, a lot of critique has been given to efficient markets and its assumptions of rationality. The greatest reason to this is because of crashes and irregularities in the market. The field of behavioural finance has been in existence for many years but is not as established as the efficient market hypothesis. It says that investors may act irrational and are mostly trying to explain the reasons why. People’s behaviour is being closely studied in order to see patterns of behaviour and this has resulted in different heuristics and biases. Heuristics are instances that come to mind when making a decision and differ a lot depending on what kind of decision you are making.
Since there are many different heuristics, this thesis only focused on one: the affect heuristic. The method was constructed in a specific way in order to show if the students showed affect in their answers. Also, a check for home bias was made.
This thesis presents the behaviour of two different groups of students, fi-nance students from Sweden and MBE-students from Germany. It was proved that both of the groups were acting irrational in their investment de-cisions. The reason to their irrationality is both because the method was constructed in a way to strategically mislead them but also because of the data collection. There were also some differences noticed depending on age groups, former studies in finance and work experience in finance. The affect heuristic was clearly shown in the answers by both groups of students. A home bias was also noticed in the answers. It was proven that 10,3 per-cent of the Swedish students invested in Swedish companies in both their first and second choice, even though the three best companies were Ger-man. None of the German Students decided to invest in a Swedish compa-ny in both the first and second choice.
Table of Contents
1
Introduction ... 3
1.1 Background ... 4 1.2 Problem discussion ... 5 1.3 Research questions ... 6 1.4 Purpose ... 6 1.5 Methodology ... 6 1.6 Delimitations ... 6 1.7 Outline ... 62
Theoretical framework ... 7
2.1 Efficient market hypothesis ... 7
2.2 Behavioural finance ... 9
2.2.1 Limits to arbitrage ... 10
2.2.2 Psychology ... 10
2.3 Affect heuristic ... 12
2.4 Home bias ... 14
3
Method and data ... 16
3.1 Survey construction method ... 16
3.2 Quick reference guide to the companies ... 17
3.3 Questionnaires ... 18
3.4 Target groups ... 18
3.5 Data collection ... 18
3.5.1 German students ... 18
3.5.2 Swedish students ... 19
3.6 Critique to surveys and experiments when collecting data ... 20
4
Empirical results and analysis ... 22
4.1 Entire groups ... 22
4.2 Age groups ... 23
4.3 Former studies in finance ... 26
4.4 Work experience in finance ... 27
4.5 Home bias ... 28
4.6 Measuring right responses ... 29
4.7 Comparison with the article by Kida et al. from 1998 ... 29
4.8 Critique to the method ... 30
5
Conclusion ... 32
List of references ... 34
Appendices ... 37
1
Introduction
The first section of the thesis will give an introduction to the topic of behavioural finance. Earlier research made in the field will first be presented, followed by the purpose and research questions of this thesis. Final-ly, an outline of the thesis will be presented in order for the reader to get a better view of it.
The basis for almost all finance taught in schools start with the assumptions of the efficient market hypothesis, which holds the assumptions of rational investors and that all infor-mation available is reflected in the market (Ross, Westerfield & Jaffe, 2005). That may make sense to a lot of people but others are disagreeing and have trouble accepting this. Often the reason to this is often the simple fact that we are all human and how could it be possible that humans always make perfect decisions? Everywhere else it is taught that every person is special and that would also mean that people make different choices. If the effi-cient market hypothesis were always true it would mean that we are living in a world with perfect investors. How come then, that sometimes arbitrary situations exists in the market? And what about financial crises and crashes? There is in situations like this that people usu-ally doubt the efficient market hypothesis (Cassidy, 2010).
There is a relatively new field in finance called behavioural finance that is a complement to the efficient market hypothesis. It says that people sometimes make irrational decisions, al-so when it comes to financial investments. This means that the market cannot always be ef-ficient and work in the best way possible. There can sometimes exist arbitrary situations, because there are information exposed to some people before the market have reacted to it. This gives those people a chance of taking advantage of the market and making an arbi-trage on it (Barberis & Thaler, 2002).
Behavioural finance is a mixture of finance and psychology, which means that the main fo-cus is to analyse how people behave in different scenarios and how this would affect their decision-making in financial decisions. There are a lot of different effects that have been found, which shows why people may act irrational (Barberis & Thaler, 2002). Since it is very closely linked to psychology, many of the important findings in behavioural finance have been made by psychologist.
The major importance of behavioural finance is easily understood by considering people as independent decision-makers and not only a part of self-regulatory markets. By looking at it that way, it may be easier to understand every person’s contribution in the market and how it works. Depending on what background the investors have, different decisions are most likely to be made. If a person have been working within the field of finance for ten years, then that person will have more knowledge and may make different decisions compared to someone who is not as familiar to the market.
Since behavioural finance has not been in existence for very long, it is still struggling with taking place as an established financial theory. In order to do so, more research has to be made to support the hypothesis. Also, to become one of the most leading theories in a field there has to be a framework in order to be able to teach the theory. This means that more studies have to be made so that clear patterns can be built.
This is the greatest reason to why this thesis will explore and research the field of behav-ioural finance: to contribute with new research to behavbehav-ioural finance.
1.1
Background
Most people tend to a agree that behavioural finance originates from the early 1970’s when two psychologists, Amos Tversky and Daniel Kahneman, published three leading articles. In 1973 and 1974 they published articles describing and testing different heuristics but the article they wrote in 1979 called Prospect theory is often seen as the starting point for behav-ioural finance. It was published in the journal Econometrica where it eventually became the most cited article ever to appear in the journal (Sewell, 2001).
Kahneman was given the Swedish Riksbank Prize in Economic Sciences in Memory of Al-fred Nobel in 2002 "for having integrated insights from psychological research into eco-nomic science, especially concerning human judgment and decision-making under uncer-tainty".
Thaler wrote in 1980 that the prospect theory suggested by Tversky and Kahneman should be working as a base of a new field of research, because consumers sometimes act in a way that is inconsistent with more classical economic theory. While Tversky and Kahneman usually are seen as the starters of behavioural finance, a lot of the important work made af-ter has been written by Thaler.
The three of them, Thaler, Tversky and Kahneman, started to work together with the help of another researcher, Schwartz. Together they wrote the paper The effect of myopia and loss aversion on risk taking: An experimental test (1997) where they among other things found out that people tend to put more weight on losses than to gains.
Another important article concerning behavioural finance was published in 1985; De Bondt and Thaler’s article Does the stock market overreact?. In the article they found out that people were overreacting to news that were unexpected or dramatic, which eventually led to inefficiencies in the stock market. They were carrying out tests in order to confirm their hypothesis that people are acting irrational when having information presented in a certain way, which eventually showed was true.
After a lot of research, Shleifer (2002) wrote a book called Inefficient markets: An introduction to Behavioural finance. He starts the book by introducing the reader to the efficient market hypothesis and then moves on by describing its weaknesses and the role of behavioural fi-nance and where it comes in. The book was written with the support and help of many im-portant behaviourists.
In the article Behavioural corporate finance, Shefrin (2001) discussed the need for and im-portance of behavioural finance in the literature. He wrote that psychological forces ac-cording to behaviourists are influencing the three traditional approaches to corporate fi-nance: rational behaviour, Capital Asset Pricing Model and efficient markets all. Psycholo-gists in the article also conduct experiments in order to show how easily people can be mis-led when making decisions. The outcomes of the experiments show how people uncon-sciously are using different heuristics when making decisions, such as loss aversion, over-confidence and confirmation bias.
A lot of focus has been put on the different heuristics and biases of behavioural finance. The most important ones can be found in the book from 2002 called Heuristics and biases: The psychology of intuitive judgment written by Gilovich, Griffin and Kahneman. Some of the heuristics and biases mentioned in the book are: affect, availability, recognition, substitu-tion etc.
Continuing on the importance of heuristics, many studies have been made in order to show them and their effects. Slovic, Finucane, Peters and MacGregor (2002) have been studying the affect heuristic in articles and define it as “the specific quality of goodness or badness”. Another interesting study on the affect heuristic was made in 1998 and used business exec-utives as test-persons. Information about companies and their financial figures were pre-sented to the executives in a specific way in order to test if the affect heuristic could be no-ticed. Indeed, the investment decisions made by the executives showed a clear pattern of affect (Kida, Smith & Maletta, 1998).
The majority of researchers in the behavioural finance literature are from the beginning psychologists and not people usually working in finance. Of course there have been studies made on investors but not as many compared to other more established theories, such as the efficient market hypothesis. Even though a lot of research has been made, even more have to be made in order to make it a more reliable method. One specific reason to why it may be harder in behavioural finance is because it is actually two fields that need to be linked together and so psychologists have to work closely to finance, or vice versa in order to conduct more research.
1.2
Problem discussion
After the presentation of behavioural finance it is easy to see that there are a lot of different interesting approaches that can be tested and analysed. In this thesis however the focus will be put on only one of the heuristics in order to be able to make the thesis as narrow as possible. This thesis will focus on the affect heuristic that has not been given as much at-tention as other heuristics.
The interesting part of behavioural finance is that the tests cannot be performed as easily as other theories. The information has to be presented in a certain way in order to see if the investors tend to act irrational. So the data collection has to be made like an experiment where the participants are being strategically misled.
In order to see how people interpret information based on previous experiences, two groups with different backgrounds will be tested. The two groups are students from Jön-köping International Business School in Sweden and Steinbeis in Germany.
Since the home country between the two groups is different, a test on home bias will also be made in the study in order to see if the students are acting irrational. Home bias is usual-ly not a part of behavioural finance but it is still appropriate in this study since it also shows a tendency of irrationality.
The reason to why this thesis is of importance is because of the fact stated in the end of the background. There is not a lot of research in behavioural finance made exclusively on fi-nance investors. This thesis however will help to fill that existing gap. Since people in psy-chology have written most of the behavioural finance literature, more needs to be written by people studying or working in finance in order to make the link between psychology and finance more stable.
1.3
Research questions
In this thesis focus will be placed on some important aspects and the questions that will be answered are:
• Are the students making irrational investment choices?
• Is there a difference in the choices made depending on what group they belong to? • Does the students tend to choose companies that are from their home country?
1.4
Purpose
The purpose of this thesis is to examine if there is irrationality in investment choices made by students studying finance.
1.5
Methodology
A quantitative, experimental study will be made on both of the groups separately. Exactly the same procedure will be made on the groups, so that they have the same information and that the answers received can be compared with each other.
The study will consist of three different surveys that will be handed out to the students where they in the end will have to decide on which companies to invest in. Depending on how the information is being presented to them, the affect heuristic will hopefully be visi-ble in the answers.
1.6
Delimitations
The area of behavioural finance is broad and includes a lot of different effects. So in order to be able to specify this thesis more, focus will be put on only one of the effects: affect heuristic. The questions in the survey are made in order to show this heuristic and not all the others that exist.
1.7
Outline
After this introduction of the thesis, a theoretical framework will be presented. The section after will present the method used in order to collect the data and also the surveys used. When that is done, the collected data will be presented along with an analysis. Here, every group will be analysed as well as the answering of the research questions further up. When every question have been answered and analysed, a conclusion of the entire thesis will be made.
2
Theoretical framework
In this section different theories appropriate for the thesis will be presented. Studies made on the topics along with the basic assumptions of them will be explained. The theoretical framework will start with the efficient market hypothesis, followed by a definition of behavioural finance. It will continue with presenting the affect heuristic and end with home bias.
2.1
Efficient market hypothesis
The efficient market hypothesis says that the prices in a market always fully reflect all avail-able information in the market. Everything that needs to be taken into account is already reflected in the prices, thus making it an efficient market. There are three sufficient condi-tions underlying the theory; the first is that there would be no transaction costs in the mar-ket, the second is that everyone can easily get all information and third, that everyone agree on the meaning of current information for the current prices and the distribution of future prices. If all of this would be true in a market, the prices would indeed fully reflect all in-formation available. On the other hand, it is easy to see that this is hardly the case in the re-al world. But the conditions are to some extent needed for the efficient market hypothesis and exist in different forms. For example, instead of everyone having unlimited access to the information existing, if a “sufficient number” of investors have the information then that could be enough for the efficient market. Eugene Fama points out that the efficient market hypothesis is of course an extreme hypothesis that is not expected to be perfectly true but on the research made on it he says that it stands up quite well to the data (Fama, 1970).
The basic conditions underlying the efficient market hypothesis are sometimes being stated otherwise. Since it was so long ago that Fama wrote the article and a lot of research have been made in the field, the formulation seems to change. When Shleifer (2000) presents the efficient market hypothesis in his book, he writes that it relies on three arguments; firstly, that investors are rational and also value securities rationally. The second argument is that if some investors are not rational, then their choices are uncorrelated and therefore cancel out each other. And last, if investors are irrational in similar ways they are met in the mar-ket by rational arbitrageurs who will take away their influence on the prices.
There are also three types of forms in the efficient market hypothesis and the tests per-formed in Fama’s article from 1970 are made independently on the different forms. In the weak form, the information used comes only from historically prices or returns. The next form, the semi-strong, uses all publicly available information, such as annual reports. The strong form however deals with information that is private, meaning that only a small amount of people has access to the information.
A connection exists between the efficient market hypothesis and the idea of random walks. The idea behind random walk says that in price series all of the following changes in price represent random departures from previous prices. It says that if the flow of information were not being prevented, then that information would be reflected directly in the stock prices. So the price change of tomorrow would only affect tomorrow’s stock price and not today’s. And since news cannot be predicted prematurely, the resulting price change will al-so be unpredicted before. In the end, if all of this is true, then all the information will be re-flected in the stock prices in the market. So anyone that would buy a diversified portfolio in the market would get the same rate of return, regardless if it is a uniformed investor or an
expert (Malkiel, 2003).
The research made by Fama is considered as the basic foundations and the starting point of the efficient market hypothesis. The assumption of efficient markets has somehow always existed in a similar form but the article by Fama in 1970 was anyway a starting point in the form that it exists today (Shiller, 2000).
In the popular book “Irrational exuberance” by Shiller (2000), he describes the efficient market hypothesis closely and relates it to previous happening in the market on recent years. He uses the term “smart money” in order to refer to smart investors in the financial markets. When someone is looking for an opportunity in making a profit in the financial market, the smart money are the ones you compete against. But the efficient market hy-pothesis states that if there were possibilities in the market where the smart money could make a profit, then this would only be in order to drive the asset prices to their true value. So in other words, that would mean that they were only buying under prized stocks in or-der to get their prices up and opposite, meaning that they were selling overprized stocks that eventually would get their price down. All of this would be made so that the prices would in the end be in equilibrium.
The concept of efficiency can have a different meaning for everyone. The basics for it is of course the same but how to formulate it may be different. Malkiel wrote in 2003 is that in his article he defines efficiency in financial markets as markets where investors cannot earn above-average returns without accepting that there will be an above-average risk connected to it. This formulation is in its basis aligned with the efficient market hypothesis but on the other hand it points out what implications an above-average return may have. It says that you can sometimes earn money on the market but you will not do so without having to sacrifice some risk.
Moreover, it is said that everything that is going on in the market is reflected directly. Meaning that there would be no arbitrary situation by someone who got the information before (Ross, Westerfield & Jaffe, 2008). If, for example a firm’s share value will increase due to a change in the firm, then as soon as it is implemented or announced this would be reflected in the market. A person who sees this information should not be able to have time to make an arbitrary gain out of this. That is one of the underlying assumptions of the efficient market hypothesis.
Even though the field of efficient markets is established, it also has a lot of critiques. One of them is clearly the field of behavioural finance and it has got a lot of attention in recent years. Some of the critiques on the efficient market hypothesis are discussed in Malkiel’s ar-ticle from 2003. He points out that he is supporting the efficient market hypothesis but that it has some errors as well. One of the biggest reasons to why people do not trust the efficient market hypothesis is because of big crashes in the market. From big crashes, like the IT-crash in 2000, to small irregularities in the market, such as the January-effect. The reasons to why he still believes in efficiency are mainly because of three reasons. First, he believes that the market can be efficient even though the participants in the market some-times can make irrational choices. Second, because he believes that the market is very good at reflecting new information fast. And third, he says that the market pricing is not always perfect but that it does not mean that the market is not efficient because of this.
2.2
Behavioural finance
The field of Behavioural finance is often presented as a critique to the efficient market hy-pothesis and has therefore sometimes been given the name “Inefficient markets” (Shleifer, 2000). One of the basic foundations of the efficient market hypothesis says that efficient markets are places where investors in most cases are acting rational and where information is fully reflected in the prices (Fama, 1970).
In behavioural finance however, it is not a clear model that is being used as the foundation of the field. Instead, it can be divided into two blocks where the first one is cognitive psy-chology. This part deals with how people think and the different heuristics and biases that are noticed and studied. The second part deals with the limits to arbitrage and refers to studies regarding which arbitrage situations that will be effective (Ritter, 2003).
The definition of behavioural finance can sometimes be confusing, since authors seem to interpret it in their own way. The core meaning of it is of course the same but some of the definitions of important authors will be presented here:
Figure 1: Definition of behavioural finance by different authors Thaler
(1993) "I think of behavioural finance as simply "open-minded finance”." Shleifer
(2000) “At the most general level, behavioural finance is the study of hu-man fallibility in competitive markets.” Shefrin
(2001) “Behavioural finance is the study of how psychology affects financial decision making and financial markets.” Ritter
(2003) “Behavioural finance encompasses research that drops the tradition-al assumptions of expected utility maximization with rational inves-tors in efficient markets.”
Shiller
(2006) “Behavioral finance is not wholly different from neoclassical finance. Perhaps the best way to describe the difference is that behavioral fi-nance is more eclectic, more willing to learn from other social sci-ences and less concerned about elegance of models and more with the evidence that they describe actual human behavior.”
Sewell
(2007) “Behavioural finance is the study of the influence of psychology on the behaviour of financial practitioners and the subsequent effect on markets.”
De Bondt et
al. (2008) “Behavioral finance is the study of how psychology impacts finan-cial decisions in households, markets and organizations. The main question is: What do people do and how do they do it?”
After reading the definitions stated by these authors, an overview of behavioural finance should be given. But as mentioned above, behavioural finance may be divided into two subsections. Here under these subsections will be examined in order to give the reader a deeper understanding of the subject.
2.2.1 Limits to arbitrage
The limits to arbitrage deals with the counterargument to the idea of efficient market hy-pothesis, which says that if prices wander away from fundamental values, rational actors in the market will take actions that will lead the prices back to its fundamental value. The ar-gument that behavioural finance gives says that it is not always the case that rational actors may take control of the situation, because it can be both risky and costly. This will eventu-ally make the mispricing long lasting in the market (Barberis & Thaler, 2002). Also Merton (1987) states the belief that finding mispricing in markets can be hard, which give people enough reason to not correct the mispricing and thus leaving it in the market.
An arbitrary situation occurs when someone can buy and sell the same, or fundamentally similar, security at the same time in different markets and make a profit on it (Sharpe & Al-exander, 1990). In theory, in an arbitrary situation you are not using any capital or expose yourself to risk (Shleifer, 2000). In common finance terminology irrational traders are often called noise traders, while rational traders are called arbitrageurs. Friedman (1953) suggests that the rational traders in the market, the arbitrageurs, will make profits on the irrational actions made by the noise traders in the market. This is not a shared belief in behavioural finance, which says that those situations may be attached to a lot of risk (Barberis & Thaler, 2002).
Traders in the market usually short sale with a substitute stock in order to hedge for the risk associated with investing in a stock. But even though the trader short sells in order to remove risk, it may not always work. There may be situations where both of the stocks will move in the same direction. The importance of this is to show that there may always be at-tached some risk when trying to make an arbitrage (Barberis & Thaler, 2002). However, De Long, Shleifer, Summers and Waldmann (1990) showed that there might be some traders in the market who wants to make the same investment decisions as the noise traders be-cause they believe that they can make a profit on that. This may be the case in markets where a pattern is noticed that traders usually tend to invest in stocks that had high values in the past. If the arbitrageurs then trade the same as the noise traders in the market they help fundamental values to increase, meaning that it will increase even more in next time period. And it is during that period that the arbitrageurs can make a profit.
Another proof of mispricing is an example from the S&P 500 index. It has been noticed that when a stock is included in the index, the firm’s shares increase even though the fun-damental value is the same. When Yahoo was included in the S&P 500 its shares increased by 24% in only one day. This led to a mispricing in the share value since the fundamental value and share value was not the same anymore (Barberis & Thaler, 2002).
The evidence connected to the arguments of limited arbitrage may be easy to understand. Every sign of mispricing in the market is evidence enough to show it. Even though the ef-ficient market hypothesis states that there will be mispricing in the market, that eventually will move back to fundamental values, there are mispricing that stays in the market. And it is these long-lasting prices that are the proof of the limits to arbitrage (Barberis & Thaler, 2002).
2.2.2 Psychology
The study of people’s behaviour is the second part of behavioural finance. Experiments are being conducted in order to see how people behave and what mechanisms that underlie
their choices. Different heuristics and biases are being used when people are faced with un-certain probabilities or prediction of values, which simplifies the decision making process (Tversky & Kahneman, 1974). Some of the existing heuristics will be presented here:
Availability. In some situations, people’s decisions rely on how easily some instances or
happenings can be brought to mind (Tversky & Kahneman, 1974). To make it clearer, an example will be given. How media portrays different types of death makes some easier to recall. Consequently, that makes people believe that homicide occurs more frequently than suicide or that people more often die from fires than from drowning (Lichtenstein, Slovic, Fischoff, Layman & Coombs, 1978).
Folkes (1988) wrote an article where he performed four tests on consumers to show that availability influenced them when deciding upon a product’s failures. When consumers per-ceive the risk of buying a product, they use availability by searching for information, stick-ing to well-known brands or by staystick-ing loyal to brands they have been satisfied with before.
Representativeness. When people are dealing with probabilities and of how much one
object belongs to another, they tend to use representativeness in order to make decisions. This is done by evaluating how much the first object is representative of the second, name-ly how similar they are to each other (Tversky & Kahneman, 1972). In some situations however, representativeness may be misleading. One noticed failure is that people tend to neglect sample size when making their decisions (Elton, Gruber, Brown & Goetzmann, 2010). Instead of thinking that a small sample size is not representative of the entire popu-lation, they tend to put too much importance on the sample instead of seeing a larger pic-ture. For example they may believe that a financial analysts that have made four good in-vestments is talented, because four successes is not representative of a bad analyst (Barberis & Thaler, 2002).
Overconfidence. This heuristic deals with situations where people overestimate their own
personal ability when making an estimation (Elton et al., 2010). A study made by Shefrin (2001) showed evidence of this heuristic. People were presented to the problem: “Relative to all the people you work with, how would you rate yourself as a driver? (1) Above aver-age? (2) Averaver-age? (3) Below averaver-age? Here average is defined as the median”. It has been noticed that when groups of people who are working together was given this question, 65 to 80 percent rated themselves as “above average”. This is of course impossible, since no more than 50 percent can be above average. This can be extended to other situations as well where it has been proven that people are overconfident (Shefrin, 2001).
People are not only overconfident about their own abilities but also when making judg-ments where they are convinced that they know the right answer. It has been shown that events people are very convinced will occur only happens around 80 percent of the time, while events they think will never occur happens around 20 percent of the time (Fischhoff, Slovic & Lichtenstein, 1977).
Anchoring and adjustment. In situations where a person will make an estimate, they might start from an initial value, an anchor. After this adjustments are being made in order to reach the final value (Tversky & Kahneman, 1974). An example of this is when evaluat-ing a stock with unknown expected return and first turn to the S&P 500. This is the an-choring. After this the result is being adjusted depending on which industry the company is working and also according to risk (Elton et al., 2010). Experiments that have been con-ducted in order to show the anchoring and adjustment have been made by first asking some people to first make a comparative decision, such as: “Is the population of Chicago
more or less than 200,000?” After that, an absolute estimate will be made by giving the question: “What is the actual population of Chicago?”. This has lead to that people tend to answer somewhere close to 200,000 thus using that number as an anchor and then adjust-ing for a value dependadjust-ing on other information that they have. This has been noticed in many studies (Epley & Gilovich, 2006).
The heuristics presented above are all of great importance in behavioural finance and there are many more among them. All of them will not be presented here in this thesis but a deeper investigation will now be made on another important heuristics in behavioural fi-nance, namely the affect heuristic.
2.3
Affect heuristic
The affect heuristic can be described as a heuristic where decisions are being influenced by affect. This means that depending on what you feel when you are being presented with cer-tain information, this will be dependent when you are making decisions. This goes usually very fast and the person being exposed to this may not even know what is going on. Con-sider for example the word “hate” and how you feel when you hear it (Slovic et. al, 2002). Surely you immediately feel the connection to a bad feeling and this is the fastest way to ac-tually show the affect heuristic but also the most trivial. There are different ways where more affect will be shown and also moments where the decision making process can be dependent on what affect that has been given before.
The modern psychology can be divided into three different groups where affect is one of them and cognitive and conative is the other two. These three groups have also been given the name “ABC” of psychology, where A stands for affect and the way we feel. B is for behaviour and C stands for cognition (Kraus, 1990). A majority of theorists believes that the affect works only after a great amount of cognitive reactions have taken place. Zajonc disproves this in 1980 when he conducts a test regarding it and shows that the affect is working independently and without post-cognitive reactions.
The field of affect is broad and one of the most important aspects when it concerns fi-nance is people’s decision-making processes and how they can be influenced. Different re-search has been made in order to show how people can indeed be manipulated and have proven this by using test-persons.
Kida et al. wrote in 1998 an article where they conducted three experiments on experienced business executives. They refer to affective reactions as “an evaluative response that repre-sents a positive or negative valence in memory structures”. One of the three experiments they constructed was testing how affect can influence the decision making of these execu-tives. In this test 22 managers were going to make an investment decision after evaluating the information of ten firms. But in order to test for the affect heuristic it had to be con-structed in a specific way. The executives were first presented with information of five of the firms. Out of these five (firm A, B, C, D and E), firm B was superior to the other ones. In the next sheet they were presented with the numbers of the remaining firms (firm F, G, H,I and J). In this sheet however, all of the companies’ numbers were close to each other and it was much harder to see which of the companies that were the best investment choice. When the executives were to decide in which two firms to invest in, 82 percent of them chose firm B even though it was the third best of the firms and if everyone had an-swered correctly then it should not be chosen by anyone. The reason to why so many of
them chose firm B as the first choice is because they remembered from the first sheet a positive reaction towards firm B. The rest of the executives, 18%, chose firm G as their first choice, the best company in the survey. The ones who chose firm B as their first choice chose firm G as their second choice. None of the respondents chose firm I that were the second best company.
A psychologist named Robert Zajonc also performed a lot of different tests in 1968 to show the affect heuristic. One important finding he made was when people were being ex-posed to certain information repeatedly. The “mere exposure” of the information created a positive reaction to the person. He was also interested in social behaviour and to show the link between affect and cognition. This is mostly demonstrated in an article he wrote in 1980 where he says that both affect and cognition are two completely separate systems but that they still can influence each other. He also showed in his article that affect is not al-ways post cognitive, as mentioned above. He believes that the affective reaction is often the first reaction and sometimes can even be the most dominate one (Zajonc, 1980).
Winkielman, Zajonc and Schwarz (1997) wanted to show how fast the affect heuristic can be and conducted tests where they used a subliminal priming paradigm. The priming was being made by showing the participants different faces (happy faces, angry faces or a neu-tral polygon) for only 1/250 of a second. This was being made so fast in order for the par-ticipants to not even notice that they had seen it. After this they were being presented by an ideograph for two seconds and after this they were to tell how much they liked it. The ide-ographs where a happy face had been shown before where much more liked than for the ones being primed with an angry face. This showed that the affective priming indeed influ-enced the participants’ answers.
The method used in the article above was inspired by a similar test conducted by Murphy and Zajonc in 1993 where they also “primed” the participants in order to show the affect. Continuing on the evidence found by Zajonc in 1980 about the “mere exposure”, Reber, Winkielman and Schwarz (1998) made different experiments where they showed that stim-uli that were being shown for a longer time where liked more than the one that had been shown for a short time. This shows exactly the same conclusion as the experiments made by Zajonc but also that the experience of fluency were attributed to positive affect but not to negative. This was the result of asking participants about the prettiness or ugliness of circles being shown in a specific way. This showed that the participants with the positive focus (rating the prettiness) differed from the ones with the negative focus (ugliness). Other and more different studies have also been conducted in the field of affect. La France and Hecht showed in 1995 that students that were being caught for academic misconduct were being punished differently depending on if they were being pictured smiling or not. The students that were smiling got lower punishments because they were thought of as be-ing more good, honest and trustworthy than the ones that were not smilbe-ing.
All of this research has shown that the people in these tests have in one way or another been influenced and manipulated in order to show what affects them. This is also used in our daily lives in order for companies to attract more customers. Interesting evidence of this manipulation is being reflected upon in an article by Slovic, Finucane, Peters & Mac-Gregor (2007). An example given there is why packages of food have words written on them as “new”, “natural”, “fat free” etc. The reason for this is of to attract the likelihood of the product and make the consumers wanting to buy them.
2.4
Home bias
It has been recognized that investors tend to invest in domestic assets far more than in for-eign assets. This phenomenon has been given the name home bias. Other combinations such as home asset bias or domestic asset bias are also referring to the same issue. It has been noticed in equity investments as well as in stock- and bond market investments (Oeh-ler, Rummer, Walker & Wendt, 2007).
Since countries move in different directions, meaning that some countries face an upswing in the economy while others are facing troubles at the same time, it would make more sense for investors to hold diversified portfolios. By doing so, they would have more chances in making a profit if one of the countries were facing a decrease in their stocks. Even though this is the case, many investors still seem to invest in their home country’s as-sets instead of spreading out their investments on different countries (French & Poterba, 1991).
Grinblatt and Keloharju (2000) showed that not only do investors tend to invest in their home countries but also they tend to invest more in firms that are geographically closer to them than other firms, even though they all are located in their home country. A study was made on Finnish investors which showed that they were more frequently investing in Finn-ish firms that were located close to them, had the same background and used the same lan-guage as themselves.
Research has been made in order to test this bias and to see to what extent it actually exists. Most of the research however has been made concerning investments in equity and not as much concerning the stock- and bond markets. However, some common effects have been noticed and also reasons to why people tend to invest in their own countries have been found (Oehler et al., 2007).
There are three factors that help to explain the phenomena of home bias. The first con-cerns the transaction costs in making foreign investments. It may be more costly to invest in another countries because of tariffs, different taxation rules in the country, or other costs that arise. This leads to people preferring to invest in their own country where these costs do not arise. The second factor deals with different hedging possibilities that may arise. There are arguments saying that the possibilities of hedging risk is better when dealing with domestic assets instead of foreign. The last factor is information asymmetries and the rea-son to why it can contribute to a home bias is because investors usually have more infor-mation, sometimes even inside inforinfor-mation, about assets in their home country (Oehler et al., 2007).
Even though the home bias exists in our markets today, a decline has somehow been rec-ognized. One reason to this is that information is being exchanged to a greater extent today compared to a couple of years ago. With the internet people get more information that they earlier could not get hold of as easy, which has led to the fact that investors now have more information also from countries that does not lie close to them (Amadi, 2003). Also, there was a general relaxation concerning the controls on foreign portfolio investments around the 1980s, which have helped to make it easier to trade in other countries (Brennan & Cao, 1997).
Another reason to why trade between countries have become easier is because of establish-ing of unions and especially the European monetary currency. Now that many countries in Europe have the same currency, trades between these countries is easier and somehow cheaper since they do not have to make an exchange of the currency. The countries are
coming closer to each other in a way when it is easy to get information and also when they are using the same currency (Oehler et al., 2007).
All of this has lead to that the home bias is becoming less noticeable than it was when all these factors did not exist. This is not strange at all, since the changes are big. People now-adays have a greater understanding of other options and not only the ones that lies closest to them, which leads to that their investment choices also will be changed. But even though there has been noticed a decrease in home bias it is still a noticeable phenomenon in our markets today and something that needs to be taken into account.
3
Method and data
In this section the construction of the survey will first of all be explained. After that, the target groups in this thesis will be presented. Critique to survey and experimental methods will also be presented shortly and finally this section will end with a quick reference guide to the companies used.
3.1
Survey construction method
In order to check for the affect heuristic, the method has been constructed in a certain way. In this thesis it was constructed in the same way as the article by Kida et al. (1998). Surveys were used in order to receive the answers from the students but the entire method was constructed more like an experiment.
The respondents were told that they would have to decide on two companies to invest in out of eight companies. The financial numbers that were presented to them were “return on assets”, “cash flow to equity”, “profit margin” and “times interest earned”. However, they did not get the financial numbers for all eight companies at the same time. First, they were presented with a survey containing numbers of four companies. During five minutes they got to look at the survey and try to memorize the numbers. After approximately one hour they were presented with the numbers of four other companies working in the same industry. This was also presented as a survey, given to them for five minutes. Then, one hour later again, they had to decide in which two companies they would invest in out of all eight companies together. The numbers of the companies were presented in a specific way that will be presented below, in order to check for the affect heuristic.
In the first sheet presented, one of the four companies is superior to the others and there-fore it should be easy to choose which company is the best. This will also create a sense of “goodness” to this company compared to the other ones. In the next four companies the numbers presented were almost the same, making it harder to see which company that is the best to invest in. In the final survey they had to choose two companies to invest in of all companies together. The reason to this construction of the information is based on the assumptions of the affect heuristic that says that the respondents should feel a positive af-fect towards the best company in the first sheet. This is because it was so much better than the other companies. In the second sheet on the other hand, none of the companies were much better than the others and hence should not create a positive affect in mind of the respondents. However, the best of all eight companies are actually placed in the second sheet of companies. But since it is hard to notice, the positive affect should only be created towards the best company in the first sheet.
All eight companies chosen in this thesis are working in the clothes industry. The eight companies are: Acne, Boss, Escada, Filippa K, H&M, Jil Sander, Joop! and Peak.
The best company out of all the eight was Boss. The second best company was Jil Sander, so in order for the students to pick the right answer they should invest in Boss in their first choice and Jil Sander in the second. Escada is the third best company out of the eight but is also the company with the affect put on it. Therefore, if the students chose Escada as their first or second choice that is because they have been affected by the goodness of it in the first survey.
Also, the companies were chosen so that half of them consisted of Swedish companies and the other half of German companies. In order to do so, the answers will show if the
stu-dents tend to choose companies that belong to their own country and if they feel more connection to them. This will show if there tends to be a home bias among the answers. The last thing made in order to mislead the students was to make the company name Peak bold and H&M cursive in the surveys. This had no other meaning than to confuse the stu-dents into believing that there was something special with these companies only by the way they where presented. If these companies will be picked it has nothing to do with affect but instead with irrationality.
3.2
Quick reference guide to the companies
Section 3.1 explained how the method was constructed and also the companies’ different qualities. This is summarized in the list here under, which can be used as a quick reference guide when reading the empirical results and analysis.
• Best company: Hugo Boss • Second best company: Jil Sander • Third best company: Escada • Fourth best company: H&M • Fifth best company: Acne Jeans
• Sixth best company: Peak Performance • Seventh best company: Joop!
• Eight best company: Filippa K
• Company that will show the affect heuristic: Escada • Company made bold: Peak Performance
3.3
Questionnaires
The three questionnaires can be found in Appendix 1-3.
3.4
Target groups
This thesis has used two different target groups in order to compare the results with each other later. The connection between the two groups is that both of them are studying fi-nance but otherwise there are differences between the groups.
The two collections of data were made separately since they are two groups that have no connection to each other.
The first target group was German MBE-students with different backgrounds. All of them have been studying other subjects before, mostly engineering and are now studying finance. They all belong to the Steinbeis University in Germany and where only in Sweden for two weeks as part of an internationalization project. Since they all have been studying before and most of them also been working, this target group have an average age older than the Swedish group that will be presented next. The group of German students consisted of 51 students.
The other target group was Swedish students studying finance. The class that were used was an introductory class in finance, which means that most of the students do not have a long background in finance. They are younger than the German students and most of them have never worked in finance before. The group with Swedish students were larger than the German students. It consisted of 97 students.
In the survey written by Kida et al. from 1998 the method is very similar to the one in this thesis. The biggest difference however lies in the target groups. As presented above the re-spondents here are students while in the survey by Kida et al. they were business executives on different levels. Some examples of their titles are: director of corporate accounting, bank president, president of a publicly traded company etc. On average they had 10 years of business experience. The experiment was conducted on them while they were attending financial and managerial training programs and was located at a large metropolitan universi-ty. Also, the group size differs a lot between that report and this one. Here, there are one group with 51 students and one with 97 students. In their report they conducted this spe-cific test on 22 business managers only.
3.5
Data collection
The data collection of the two groups was both made during one of their lectures but the conditions and atmosphere in the classrooms differed some. The two groups will be pre-sented separately here under.
3.5.1 German students
The data collection was made during one of the lecture they had in Sweden. When the stu-dents had arrived and the lecture was about to begin, the teacher presented me to the class and said that I was going to make a survey on them. I had been working with the students
before for a couple of days, so they were familiar with me but did not know that I was writ-ing my thesis. I explained to them how the survey was constructed, that they were gowrit-ing to be presented with numbers of eight companies and had to decide upon which two compa-nies to invest in. Of course I did not mention the affect heuristic or that I was writing about Behavioural finance. That was very important, since the study tries to mislead them into answering in a certain way. If they knew this from before their answers would have been different.
When handing out the surveys to the students, most of them seemed interested in answer-ing the survey and I saw that they were lookanswer-ing at the paper and tryanswer-ing to remember the best answer. The breaks that were allowed for the survey was good, because we tried to keep it quiet and calm in the classroom so that they could focus on the answer. They were told not to speak with each other and just try to answer the questions alone. When present-ed with the second sheet and finally the final survey where they had to fill in the answers, most of them seemed to focus as well on the survey and answering as good as they could. Some questions came up during the time they were given to study the surveys, such as “Do we really have to write our names?”, “How can I choose among these companies if I do not have any stock-price?”. I answered their questions and tried to make them focus on the important parts that for example do not involve the stock price of the companies.
Another thing that I recognized was that many of the students had problems remembering the names of the companies when having to choose among the companies. Many of them tried asking me which company that was the third company on the first sheet for example, since they remembered the place of the company but not the name. Unfortunately, looking at their neighbour instead or asking them for the answer often solved this.
The atmosphere in the classroom was very relaxed since the teacher encouraged the stu-dents to be positive about the survey and to answer as good as they could. He did this by starting with a small joke every time before the surveys were handed out to the students, which made the students joyful and relaxed before filling them in. The fact that the teacher was very helpful was appreciated because the students felt more eager to take the survey se-riously and answer as well as they could.
3.5.2 Swedish students
The data collection of the Swedish students was made approximately one week after that of the German students. It was during an introductory course in finance. The teacher shortly introduced me to the class and then I had to present my thesis to them and how they were going to fill in the survey. In contrast to the German group, I did not have any relation to these students and we had never seen each other before.
When the first sheet of companies was being handed out, the teacher started his class in order to have time to finish it in time. This led to that many of the students only put my survey under their notebook or on the side in order to not miss anything of their class. Af-ter approximately five minutes I went up again to collect the survey back but the problem then was that many of the students had not taken a look at the survey yet since they were listening to their class, which led to that they only had a quick look at it before I took it back.
This was the case also when the second survey was being hand out and also new students had arrived to the class that had not seen the first survey. They could of course then not be a part of the survey since all parts needs to be considered in order to be able to answer. The third and last survey that they had to fill in was handed out to them ten minutes before the class ended and during the time that the teacher still held in the class. The reason to this was that the teacher thought it was a good idea to fill it in and give it back to me when they left the classroom. Many of the students that had seen the first survey had left in the break, which unfortunately led to that answers that could have been collected now disap-peared since they were not there to fill in their answers.
The biggest difference between the data collection between the German and Swedish stu-dents was that the German stustu-dents had time to think through and remember the answers more since they were given a short break in the lecture in order to answer. With the Swe-dish class there was not time to do that, which led to that the students felt stressed and were not left with extra time in order to really have a look at the answers.
Also, the class was bigger which made it hard to keep everyone in order and to actually have them all stay during the class. The German students had to attend all of their lectures, which led to the fact that all students answered the questionnaire. With the Swedish stu-dents however, some of them came in the break while some of them left in the break.
3.6
Critique to surveys and experiments when collecting data
Even though collecting information through surveys is frequently used in business research (Saunders, Lewis & Thornhill, 2009), there are some aspects one must take into considera-tion in order for it to work appropriately. Survey collecconsidera-tions can be used in many different areas and there are some specific things to have in mind when using them with experi-ments.
First of all the questions always needs to be formulated in an easy way to understand when constructing a survey, so that the respondents interpret them in the same way as the re-searcher wants (Schuster, Ackelson, Worth, Daugherty & Wright, 1976).
Second, the atmosphere in the room has to be created in order to get a laboratory envi-ronment (Friedman & Sunder, 1994). This means that the respondents need to have space enough around them and time to think through their decisions. If they are being stressed the answers will of course be different than if they had time to think over their decisions. If it is important to get answers that are not being influenced by other people it is also im-portant to give the respondents enough space and not put them too close to each other, since that may make them talk with each other.
Another factor to take into account is: How willing are the respondents to answer your survey? There can be different reasons to why these people want to answer it but if they are not motivated by anything it will be visible in the answers (Friedman & Sunder, 1994). This is something very important and something that has been noticed more and more lately. If the respondents will get either a monetary or a non-monetary gift after participating, it has been noticed that they tend to be more motivated (Simmons & Wilmot, 2004). This may perhaps not be hard to understand, because if the respondents feel no interest at all in an-swering the survey, either they will not participate or they will only answer the questions fast without thinking through the options properly.
However, this may not always be so easy to follow. In order to construct a method where the answers are being made as accurately as possible it means that the respondents will have to first of all be placed in a calm place with enough space for their own. Second of all, if a gift is given to them then there needs to be some kind of financing behind it.
4
Empirical results and analysis
The data that concern the distribution of age, gender, years of studies in finance and work experience in fi-nance of the both groups can be found in Appendix 4. In this section however, the investment decisions de-pending on those factors will be presented and analysed. A check for home bias will also be made, as well as comparing these results to Kida et al.’s article (1998) and analysing the method of this thesis.
Before starting to analyse the empirical observations, it can be helpful if the companies that “should” be chosen will be presented again. The best of all eight companies is Hugo Boss, meaning that in the first choice everyone should answer it in order to have the right an-swer. The second best company is Jil Sander, so in their second choice this company should be chosen. In order for the affect heuristic to be visible in the answers, Escada Company should be chosen in their first or second choice.
The data will be analysed with the help of tables containing the results from the surveys. First the entire German and Swedish groups will be analysed. After that the both groups will be divided into smaller groups according to what age they have and if they have studied or worked in finance before. The reason to why they will be divided into smaller groups is to see if patterns can be seen within the groups.
4.1
Entire groups
The first graph shows the German students first and second decision choices. Here, no consideration regarding age, gender etc. will be taken into account when analysed. This will instead be a general picture of what the entire group answered.
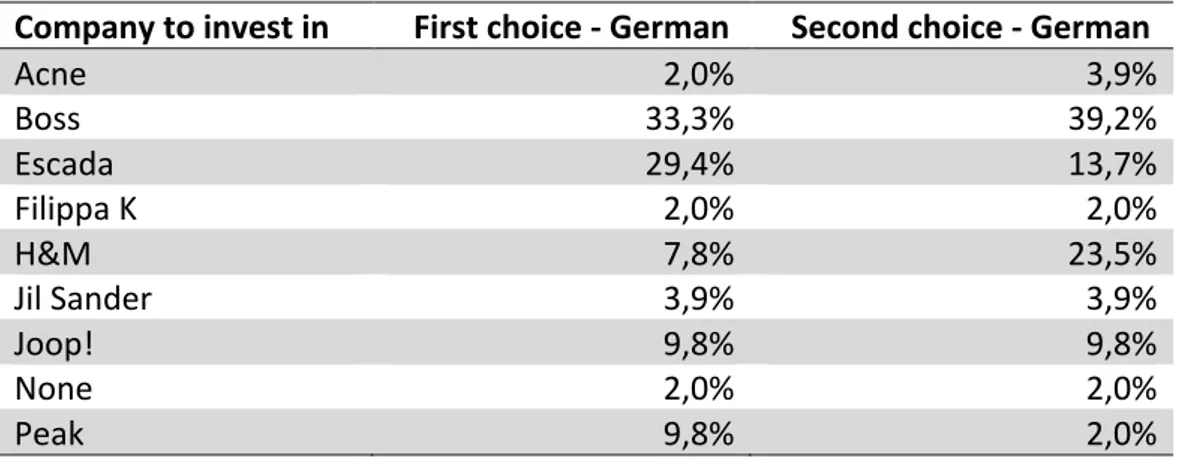
Table 4.1: Investment choices by the entire German group.
Company to invest in First choice -‐ German Second choice -‐ German
Acne 2,0% 3,9% Boss 33,3% 39,2% Escada 29,4% 13,7% Filippa K 2,0% 2,0% H&M 7,8% 23,5% Jil Sander 3,9% 3,9% Joop! 9,8% 9,8% None 2,0% 2,0% Peak 9,8% 2,0%
In the first choice we see that the company invested by most students was Boss (33,3 per-cent) and Escada (29,4 perper-cent) that almost has the same amount of votes closely follows it. If everyone would have been rational here, everyone should have chosen Boss but in-stead we see all kinds of different votes. All of the companies have been chosen by some students to be invested in. Even the company that was in the bottom of all companies, Fil-ippa K (2,0 percent), got some votes. This shows that the students tend to show irrational behaviour when making their decisions. However, since a tendency towards Escada Com-pany is shown it means that the students used the affect heuristic when making their
deci-sions.
Also in the second choice the Boss got the majority of the votes (39,2 percent). Although if compared with the first choice, more students chose Boss as their second choice rather than the first choice. Another company that many students invested in was H&M (23,5 percent). It is the fourth best company, so usually it should not get any votes. However, it was made cursive when presented to the students, which could have made them choose it since they thought it was something special about it. Also here the Escada Company (13,7 percent) got a lot of votes which shows that also here some affect have been shown.
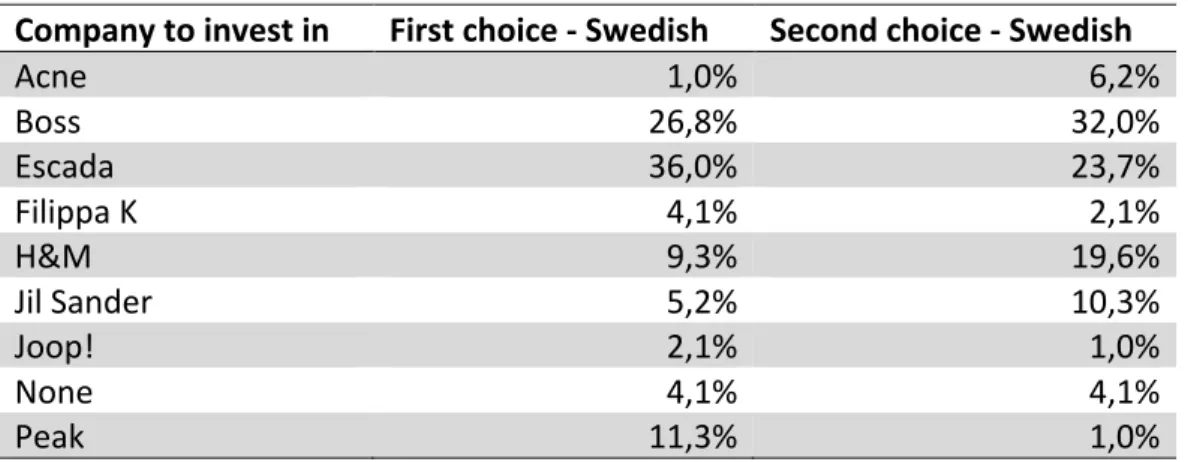
Table 4.2: Investment choices by the entire Swedish group.
Company to invest in First choice -‐ Swedish Second choice -‐ Swedish
Acne 1,0% 6,2% Boss 26,8% 32,0% Escada 36,0% 23,7% Filippa K 4,1% 2,1% H&M 9,3% 19,6% Jil Sander 5,2% 10,3% Joop! 2,1% 1,0% None 4,1% 4,1% Peak 11,3% 1,0%
The Swedish answers differed some from the German students. Also here Boss (26,8 per-cent) and Escada (36,0 perper-cent) were the companies most invested in in the first choice and also here all the companies got some votes. The largest difference however was that most students chose Escada as the first company to invest in. This shows a large irrationality since this is the company with the affect heuristic. Even though it was shown as well in the German answers, it was more visible in the Swedish student’s answers since it was chosen as the best company by a majority of the students.
In their second choice however, Boss Company (32,0 percent) was chosen mostly. But also here Escada (23,7 percent) got a great amount of the votes. It is interesting to see that also here H&M (19,6 percent) got a lot of the votes, exactly the same as in the German group’s second choice. The right answer for the second investment, Jil Sander (10,3 percent), did not get as many votes as it should get. These answers show that also the Swedish students made irrational investment decisions.
The figures presented above shows the investment decisions for the entire group. Howev-er, one of the research questions in this thesis was concerning the investment decisions de-pending on different groups. The different groups that will be studied are regarding: age former studies in finance and work experience in finance.
4.2
Age groups
The first group that will be investigated is the one concerning age. The students have been divided into three age intervals: 18-22 years, 23-27 years and 28-32 years. There were no German students in the first age group, the one from 18 to 22 years old. But in the
Swe-dish group this was the age group that most students were in. So here only the SweSwe-dish students answers can be analysed.
Table 4.3: Investment choices by Swedish students in the age interval of 18-22 years.
Company to invest in First choice -‐ Swedish Second choice -‐ Swedish
Acne 0% 6,7% Boss 25,4% 29,3% Escada 36,0% 25,3% Filippa K 4,0% 2,7% H&M 12,0% 17,4% Jil Sander 5,3% 12,0% Joop! 1,3% 0% None 5,3% 5,3% Peak 10,7% 1,3%
Here in the first investment choice the Escada Company (36,0 percent) received the major-ity of the votes, which shows that in this age group the affect really were shown. Boss Company (25,4 percent) got a lot of the votes, which is good, since it was the best compa-ny. However, 10,7 percent decided to invest in Peak as their first choice may seem a bit strange since it was the sixth best company out of eight. However, this was the company that was made bold in the survey, which can be a reason to why so many students chose it. In their second choice Jil Sander who should have been invested in only got 12 percent of the votes and instead Boss Company (29,3 percent) was chosen mostly. Also here Escada Company (25,3 percent) got a lot of the votes, as well as H&M (17,4 percent).
It seems like this age group really were acting irrational, since all the “tricks” seemed to work on them. The affect heuristic, as well as making Peak bold and H&M cursive. They have chosen the companies that were presented in a specific way in order to fool them to make those decisions.
Next age group that will be investigated is the one from 23 to 27 years. This group is even more interesting since both the Swedish and the German group have students in these ag-es.
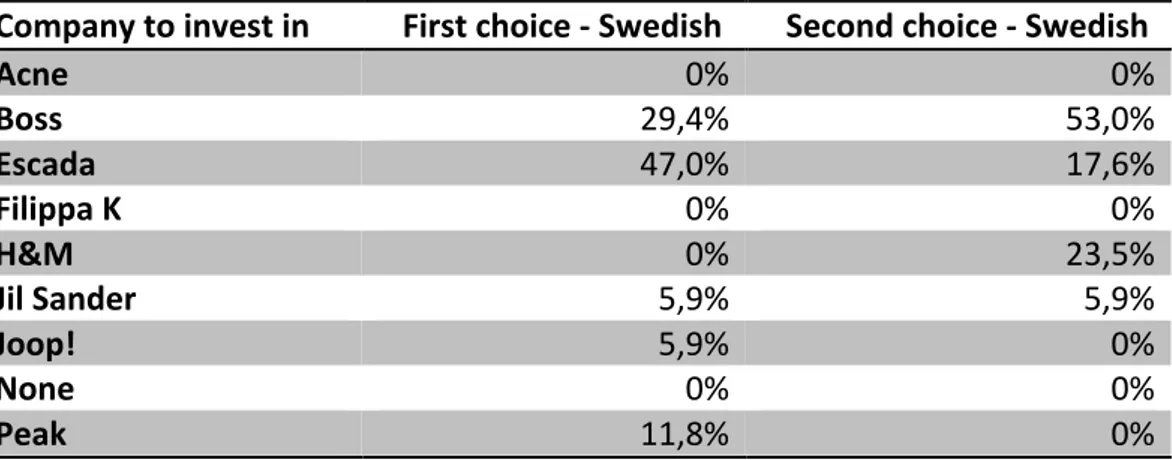
Table 4.4: Investment choices by Swedish students in the age interval of 23-27 years.
Company to invest in First choice -‐ Swedish Second choice -‐ Swedish Acne 0% 0% Boss 29,4% 53,0% Escada 47,0% 17,6% Filippa K 0% 0% H&M 0% 23,5% Jil Sander 5,9% 5,9% Joop! 5,9% 0% None 0% 0% Peak 11,8% 0%
A big difference is noticed in this answer compared to all the previous ones, which was that many of the companies were not chosen by anyone at all. This should usually be the case with everyone but it has not until now. The students in this group seem to choose more similar answers also. A very large affect has been put on the Escada Company (47,0 per-cent) that almost got half of the votes in the first choice. These students are also acting irra-tional since so many of them first of all is choosing Escada as their first choice and also be-cause only 5,9 percent chose Jil Sander as their second investment choice. Also here, a big group has chosen H&M (23,5 percent) as their second investment choice, which probably is because it was made cursive.
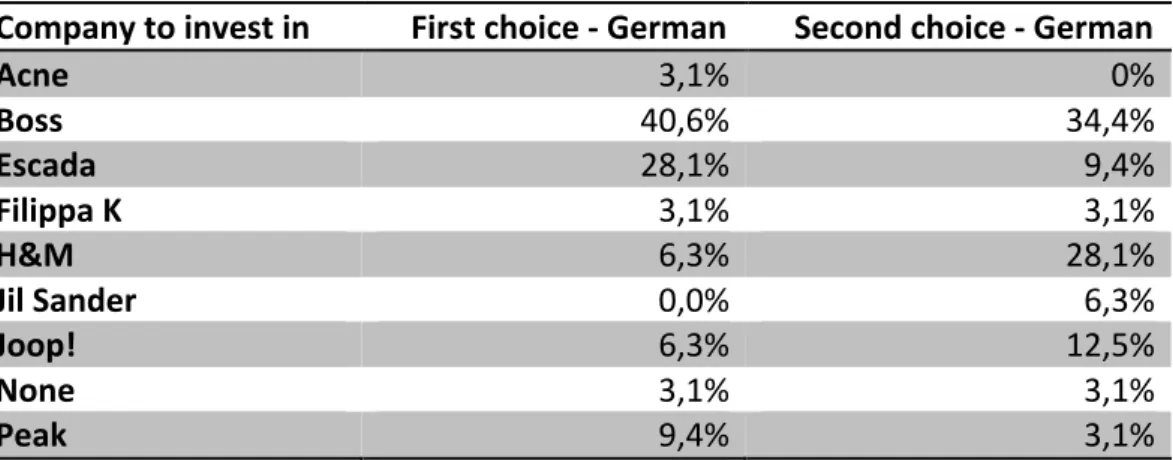
Table 4.5: Investment choices by German students in the age interval of 23-27 years.
Company to invest in First choice -‐ German Second choice -‐ German Acne 3,1% 0% Boss 40,6% 34,4% Escada 28,1% 9,4% Filippa K 3,1% 3,1% H&M 6,3% 28,1% Jil Sander 0,0% 6,3% Joop! 6,3% 12,5% None 3,1% 3,1% Peak 9,4% 3,1%
In the same age group but with the German students, there are not many similarities no-ticed. Here, the Boss Company (40,6 percent) is instead chosen as the best followed by Es-cada (28,1 percent). In the second investment choice, H&M (28,1 percent) is getting a large proportion of the votes. It is interesting to notice that even though they are in the same age group, the answers differs a lot between the Swedish and the German students.
The last age group that will be analysed is the oldest one, students with the age 28-32
years. In the Swedish groups there were only three students in this interval, which means
that it was too few to analyse. Their answers can instead be found in Appendix 5. Instead, the answers of the German students in this age interval will be analysed.
Table 4.6: Investment choices by German students in the age interval of 28-32 years. Company to invest in First choice -‐ German Second choice -‐ German Acne 0% 10,5% Boss 21,1% 47,3% Escada 31,6% 21,1% Filippa K 0% 0% H&M 10,5% 15,8% Jil Sander 10,5% 0% Joop! 15,8% 5,3% None 0% 0% Peak 10,5% 0%