NJVET, Vol. 10, No. 2, 81–105 Peer-reviewed article doi: 10.3384/njvet.2242-458X.2010281 Hosted by Linköping University Electronic Press © The author
Dropout prevention in vocational education:
Evidence from Finnish register data
Ville Vehkasalo
National Audit Office of Finland, Finland (ville.vehkasalo@vtv.fi)
Abstract
A large-scale dropout prevention programme was implemented in Finnish vocational education in 2011–2014. We used detailed register data to evaluate the programme’s ef-fects and to circumvent the attrition bias of pretest-posttest surveys. Our data included approximately 24,000 randomly sampled students, both from the participating schools and the non-participating schools, before and after the programme. We estimated the effect of the programme on study completion and dropping out using pooled cross sec-tions and difference-in-differences regression methods. Both study measures have im-proved during the last decade, but our results suggest that the programme was not ef-fective in increasing study completion or in reducing the number of dropouts. The likely causes for the improved levels of vocational degree completion include recent macroe-conomic fluctuations and legislative changes in teenagers’ eligibility for unemployment benefits.
Keywords: vocational schools, study completion, programme evaluation, register data,
Introduction
The socioeconomic effects of dropping out from secondary education have long been assumed to be negative, leading to unemployment, low income, poor health, and even social exclusion. However, concrete causal evidence has been scarce. A straightforward cross-sectional comparison of economic outcomes among dropouts and among high school graduates is misleading, as dropouts are likely to come from disadvantaged backgrounds. Dropping out is not ran-domly allocated, and missing data on family background characteristics causes bias in cross-sectional estimates.
In a recent study, Campbell (2015) presented new evidence of dropout effects. Using sibling data to control for unobservable background characteristics, Camp-bell found out that dropping out of high school has an independent net effect on economic hardship. Campbell used the income-to-poverty ratio, earned income, and employment as independent variables in his sibling fixed-effect models. Re-sults indicate that the observable differences between dropouts and high school graduates are not entirely attributable to background effects, and dropping out does appear to increase socioeconomic disadvantages (Campbell, 2015, p. 116).
Hence, there are grounds for public programmes and interventions that aim to increase the completion of secondary education. As if in anticipation of reliable scientific proof of dropout effects, numerous such measures have indeed been undertaken during the last decades, in a variety of countries. Whether these dropout prevention interventions produce desired results is another question where we are lacking an unambiguous answer, also due to missing data prob-lems.
Recent large-scale reviews by Wilson et al. (2011) and Hahn et al. (2015) sum up our current knowledge of the effectiveness of dropout prevention pro-grammes. The meta-analysis by Wilson et al. (2011) yields a mean odds ratio es-timate of 1.72, which is interpreted as an 8 percentage point decrease in the prob-ability of dropping out in the treated student groups (N = 317 programmes). Hahn et al. (2015) provide similar calculations for the studies published after the Wilson et al. review and produce a median difference of 6.5 percentage points in the probability of high school completion in intervention compared with control populations (N = 11 programmes).
Both reviews therefore suggest that dropout prevention programmes clearly have beneficial effects. However, a closer inspection of the reviews raises some doubts. Due to limited or non-existent register-based data, most studies included in the aforementioned reviews have used pretest-posttest survey data. In this popular study design, treated and control students complete a questionnaire be-fore and after the treatment.1 With a 100% response rate, such a longitudinal
de-sign yields high-quality, unbiased data. The drawback is usually that a non-neg-ligible number of students are no longer available for the second wave survey.
The reported average attrition rate in the dropout programmes included in the review by Wilson et al. (2011) was 11%, with a standard deviation of 20%. That is, within two standard deviations around the mean there have been programmes that experienced an attrition rate of 50%. Attrition was not reported in 17% of the studied samples.
If subjects are missing at random, even an attrition rate of 50% does not cause significant bias to results according to a simulation study by Kristman, Manno, and Côté (2004). However, if subjects are missing from the post-test survey in a non-random fashion, attrition rates of 20%–30% cause seriously biased estimates (Kristman et al., 2004, p. 757). As pointed out by the authors, the literature sug-gests that missing not at random is the most likely mechanism for loss to follow-up because missing subjects tend to have different outcomes from those that re-main in the programme (Kristman et al., 2004, p. 752).2 Depending on the
associ-ations between the expected outcome and the treatment, bias can be positive or negative. If we assume that the missing students from follow-up surveys are more likely to drop out than those that remain in the programme, our pretest-posttest estimates of programme effectiveness are biased upwards and vice versa. Therefore, a meta-analysis of those estimates, like Wilson et al. (2011), also produces biased results.
In a related article, Kristman, Manno, and Côté (2005) studied the merits of widely used attrition correction methods, e.g. regression imputation, weighting, and multiple imputation. Using simulation studies, they found out that none of the methods was successful in correcting the biased estimates if the subjects were missing not at random and the attrition rate was higher than 25%.
Attrition problems may be circumvented using register data, as in this study. However, register data is not a magic bullet, either. In our case, we are not able to identify individual students who were in treatment; the Finnish National Board of Education did not collect participation information on the treated stu-dents. However, we are able to identify the treated schools and compare the out-comes of students enrolled in those schools with the outout-comes of students en-rolled in non-treated schools using standard difference-in-differences regression methods.
The aim of this study is firstly to evaluate the effectiveness of the vocational education dropout prevention programme of 2011–2014. Previous research on vocational education dropout and dropout prevention programmes is scarce (Cerda-Navarro, Sureda-Negre & Comas-Forgas, 2017). However, Andersen et al. (2018) studied a case similar to ours using Danish register data, and we pare the respective findings in the concluding Section. Secondly, we aim to com-pare our results, which are based on register data, with results from pretest-post-test study designs, which have been prevalent in dropout prevention research.
Our results imply that the dropout prevention programme of 2011–2014 failed to increase study completion or decrease dropping out in Finnish vocational
education. During the last decade, dropout rates have indeed decreased and study completion has improved, but likely reasons for these changes include macroeconomic fluctuations and new criteria for youth unemployment benefits.
The remainder of the paper is constructed as follows. We first give a brief over-view of the Finnish education system, and then outline dropout risk factors and the dropout prevention programme of 2011–2014. We then present our data, methods, and results, followed by a concluding discussion.
Finnish education system
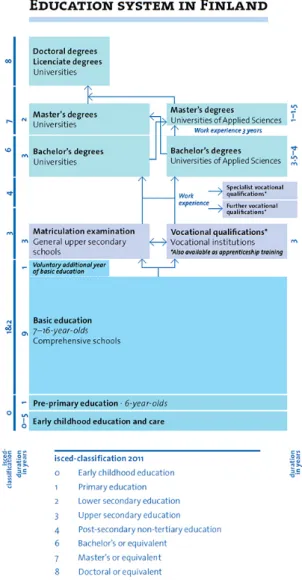
The education system in Finland is similar to those of the other Nordic countries, and the main parts are out-lined in Figure 1. There is a manda-tory nine-year basic education in comprehensive schools, starting at age 7.3 After the basic education,
over 95% of students apply for sec-ondary education in vocational insti-tutions or in general upper second-ary schools. Secondsecond-ary education has a standard duration of three years, but it is also possible to integrate vo-cational education with general up-per secondary education for a com-bined degree, which may then take a longer time.
After secondary education, stu-dents may apply for tertiary educa-tion in universities or start their working careers. Most opt for the lat-ter, although many also continue their studies. According to the latest statistics from the year 2017, in the age group of 30–34-year-olds (N = 352,269), i.e. just above the usual youth age definitions, 16% of popu-lation had completed basic education
Figure 1. Finnish education system (Finnish National Agency for Educa-tion, 2019).
only, 45% had completed vocational qualifications or general upper secondary education, and 39% had completed tertiary education, i.e. a bachelor’s degree or higher (Statistics Finland, 2019).
Dropout prevention
Dropping out of education is not a snap decision. Rather, it is an accumulation of numerous risk factors, the accumulation often starting at an early age. There is extensive theoretical and empirical literature on this disengagement process, and the relevant risk factors are reasonably well understood. For recent risk factor reviews, see Ecker-Lyster and Niileksela (2016), Ripamonti (2018), and Gubbels, van der Put, and Assink (2019).
Dropout risk factors
Broadly speaking, dropout risk factors may be divided into four categories: stu-dent-related, family-related, school-related, and school-environment-related. Ac-cording to the meta-analysis by Gubbels et al. (2019), advanced age, earlier grade retention, low academic achievement, and learning difficulties are significant stu-dent-related risk factors for school dropout. The family-related risk factors in-clude low socio-economic status and low parental involvement, while large clas-ses contribute to dropping out as a school-related factor. Gubbels et al. (2019) also found that involvement with deviant peers – which is related to school environ-ment – is a highly significant dropout predictor. Overall, Gubbels et al. (2019) identified 21 separate risk domains, which had a statistically significant associa-tion with school dropout.
Dropout prevention measures aim to mitigate the presence of these risk fac-tors. Naturally, several predictors – the family’s socio-economic status, for in-stance – are fixed and not within the reach of preventive measures. Nevertheless, schools can decrease student/teacher ratios, offer more intensive student coun-selling, try to improve their education methods, etc. As mentioned in the Intro-duction, current research consensus is that the effects of these efforts are positive on average.
How well preventive programmes reach their objectives could also depend on the implementation quality and programme fidelity. Wilson et al. (2011) con-cluded that programmes which had difficulties with programme fidelity tended to yield smaller effects on dropout than programmes which indicated that no im-plementation problems were present. More recently, Freeman et al. (2015) and Goulet et al. (2018) presented similar findings. These results may have a bearing on our study, as will be explained later.
The dropout prevention programme 2011–2014
To recapitulate, in 2017, one in six 30–34-year-olds had no qualifications or de-grees above basic education in Finland. Since over 95% of each population cohort enrolls in secondary education, there are many who drop out. Dropping out has been a major problem particularly in vocational education, where yearly dropout rates have exceeded 10% in some schools. In order to alleviate this problem, the
Government decided in 2010 to implement a large-scale dropout prevention pro-gramme in vocational education, and allocated 16 million euros for four-year programme grants.4 The programme was administered by the Finnish National
Board of Education,5 and it was implemented in 2011–2014.
The participating schools were not randomly selected to the programme. Ra-ther, the schools (or ‘education providers’, to use the exact term6) applied for the
programme, and the Finnish National Board of Education selected the participat-ing schools based on their grant applications, which had to adhere to the general guidelines of the programme. The actual measures taken were largely decided by the participating schools: some schools aimed to enhance student counselling, while others concentrated on pedagogical improvements. As most large tional education providers participated in the programme, the share of voca-tional students enrolled in the treated schools exceeded 80%.
The treated schools had to provide a final report of the programme activities and outlays, and the Finnish National Board of Education officials audited these final reports. The Finnish National Board of Education also prepared a yearly monitoring report on the programme results. Additionally, an external evalua-tion report on the programme was published (Ahola, Saikkonen & Valkoja-Läht-eenmäki, 2015). The authors of the yearly monitoring reports and the evaluation report mainly used various qualitative methods (surveys, interviews), and statis-tics compiled by the Finnish National Board of Education, but from the partici-pating schools only. The authors did not collect comparison data from non-treated schools and used only descriptive statistics.
Both the yearly monitoring reports and the external evaluation report claim that the dropout prevention programme had beneficial effects on study comple-tion rates and that dropping out decreased during the programme. However, since no comparison data from non-treated schools was analysed or even pre-sented, there are no reasons to attribute these changes to the dropout programme, as a number of external factors could have produced similar changes.
Data and methods
As we mentioned earlier, most dropout prevention studies have used pretest-posttest survey data. However, in the Nordic Countries, the National Statistics Offices gather high quality register data from various fields, including education. Therefore, we decided to exploit register data in our approach, combined with difference-in-differences regression methods for pooled cross sections.
Data
In our study, we used detailed register data from the student registers of Statistics Finland. First, we compiled a list of schools that participated in the dropout pre-vention programme. We then requested Statistics Finland to collect two random
samples of students from the first-year vocational student cohorts of 2002, 2007, and 2012, i.e. six random samples in total. Three samples come from the partici-pating schools and three from non-participartici-pating schools (control schools). We re-stricted our sample to upper secondary vocational education carried out in voca-tional institutions; youth apprenticeship training and adults’ competence-based qualifications were excluded.
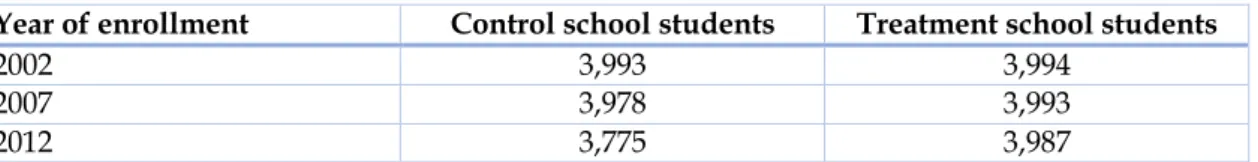
The sample size was determined as follows. Since almost 90% of vocational students were studying in the participating schools, and the size of each enrolling cohort was approximately 50,000 students, roughly 5,000 first-year students were studying in the control schools. Therefore, we requested that the sample size of each random sample should be approximately 4,000 students to achieve a total sample size of 24,000 students. The sample sizes that Statistics Finland delivered are tabulated in Table 1.
Table 1. Sample sizes.
Year of enrollment Control school students Treatment school students
2002 3,993 3,994
2007 3,978 3,993
2012 3,775 3,987
Our data include the following background characteristics of the students: • age at enrolment year
• gender
• grade point average in basic education certificate
• special needs education status (= 1 if student is entitled to special needs education, 0 otherwise)
• socio-economic status of mother • socio-economic status of father • study field.
We had two dependent variables in our study. Both are indicator (dummy) vari-ables:
• whether the student completed his/her studies in three years’ time (= 1 yes, = 0 no)
• whether the student dropped out before the end of third study year (= 1 yes, = 0 no).
The target schedule for study completion in vocational education is three years. Hence, in our data the information on study completion was collected three years after the enrolment year, i.e. from the years 2005, 2010, and 2015 (end of each year). However, some students spend a considerably longer time completing their studies. If a student has not completed his or her studies in three years’ time (i.e. the completion variable above equals zero), but is still enrolled as a full-time student, the dropout variable is valued zero as well. Consequently, our
dependent variables are not perfect complements. That is, it is possible that both are valued zero for some students.
Table 2 presents summary statistics of the background characteristics of both treatment and control school students from the year 2012 student cohort. Note that most students are aged 16 when enrolling to vocational institutions, but in our data there are some new students aged between 20–30 or even older, and the mean age reflects this fact.
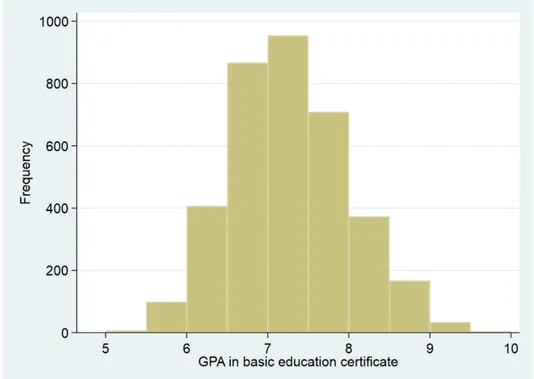
In Finnish basic education, the subject grades range from 4 (‘fail’) to 10 (‘excel-lent’). Among the control school students, the mean GPA was 7.3 in the 2012 co-hort, and among the treatment school students, the mean GPA was 7.2. Figure 2 depicts the distribution of grade point averages of the treatment school students.
Figure 2. Grade point average in basic education certificate, treatment school students, year 2012 cohort (N = 3,621).
Note that data on the grade point averages of several sampled students is missing in Table 2. The reason for this is that the data include only the GPA data supplied by the students’ comprehensive schools. Self-reported grades were excluded as they could be unreliable. Older vocational education applicants have occasion-ally used self-reported grades in their school applications.
Table 2. Summary statistics, year 2012 student cohort.
Variable Control
school students school students Treatment
N 3,775 3,987
Mean age at enrollment 19.5 18.7
Gender: male 46.6% 52.3%
Mean GPA in basic education certificate 7.3 7.2
Special needs education status 11.7% 14.9%
Mother’s socioeconomic status:
Farmer, other entrepreneur 8.9% 7.4%
Senior officials and upper management 8.9% 9.7%
Lower-level employees with administrative and clerical occupations 39.3% 43.7% Manual workers 16.7% 16.6% Students 1.9% 2.1% Pensioners 7.5% 6.0% Unemployed 7.7% 7.9% Other or unknown 9.1% 6.5%
Father’s socioeconomic status:
Farmer, other entrepreneur 16.7% 13.5%
Senior officials and upper management 8.7% 9.9%
Lower-level employees with administrative and clerical occupations 11.1% 13.6% Manual workers 30.7% 30.6% Students 0.9% 0.8% Pensioners 10.2% 8.8% Unemployed 7.5% 10.1% Other or unknown 14.2% 12.7% Study field:
Arts, humanities, education 11.4% 6.5%
Business and administration 18.2% 11.9%
Natural sciences 2.8% 3.3%
Engineering, manufacturing, construction 23.7% 38.4%
Agriculture, forestry, fisheries 13.5% 4.9%
Health and welfare 5.0% 14.0%
Services 25.5% 21.0%
From Table 2, we observe that vocational school students usually come from fam-ily backgrounds where parents are employed in lower-level clerical or adminis-trative occupations (typically mothers) or as manual workers (typically fathers). When we compare the backgrounds of control school students with those of treatment school students, we find only minor differences. However, the study fields are somewhat different in the two groups. We are able to control for these
observable differences by including Table 2 variables in our regression equations as confounders.
Our baseline regressions include all complete observations from the 2007 and 2012 cohorts. As explained earlier, there was no ‘across the board’ treatment, and the participating schools largely decided themselves what they did with the pro-gramme grant. However, the outlays had to adhere to the general propro-gramme objectives outlined by the Finnish National Board of Education. As a result, there was considerable variation in the actual treatments.
In order to account for the most obvious differences in the actual treatments, we classified the treated schools into three major categories according to their final programme reports before submitting the list of participating schools to Sta-tistics Finland:
• projects enhancing student counselling (1,122)
• projects aiming at pedagogical improvements (1,142) • projects improving school infrastructure (89).
Since several schools were involved in multiple (two or more) projects simulta-neously, we also created a fourth category:
• multiple projects (1,634).
The number in parenthesis is the number of treatment school students in each category from the year 2012 cohort in our data. Using this information, we may then also study the effects of each treatment category separately.
Econometric model and identification
In our econometric analysis, we use the 2007 student cohort as the ‘before treat-ment’ sample and the 2012 student cohort as the ‘after treattreat-ment’ sample. As ex-plained above, the year 2007 sample also contains information on study comple-tion and dropping out from the year 2010, and the year 2012 sample contains information on study completion and dropping out from the year 2015. The drop-out programme was implemented during 2011–2014. In our analysis, we pool the 2007 and 2012 cross sections and use standard difference-in-differences regres-sion for pooled cross sections.7 Our estimating equation (1) may be written as:
(1) Y = Xb + d1dropoutprog + d2year2012 + d3dropoutprog·year2012 + e.
The variable dropoutprog equals one if the student was enrolled in a participating school, and zero otherwise. Since we have this information from the pre-treat-ment period (2007) also, dropoutprog essentially controls for unobservable system-atic differences between students enrolling in treatment schools and control schools. Time-invariant differences may still exist even after controlling for the observable background characteristics, namely the variables denoted X (age, gen-der, GPA, etc.). For instance, the participating schools may be located in larger
city areas, which offer plentiful opportunities for truancy compared to quieter rural areas.8
The variable year2012 equals one if the observation is from the latter (treat-ment) period and zero otherwise. This year dummy controls for nationwide five-year changes in legislation, economy, employment, social benefits, and so forth, which may also affect study completion and dropping out.
The interaction term dropoutprog·year2012 measures the effect of the pro-gramme. It equals one for those students enrolled in the participating schools during the latter time period (2012), and zero otherwise. Note that since our de-pendent variables are binary, we are estimating a linear probability model. Therefore, the coefficients measure the percentage point change in the probabil-ity of study completion or dropping out.
The key identifying assumption in difference-in-differences regression models is that of parallel trends. That is, without the treatment, we should observe no differences in response variable development over time when comparing the treated units to the control units. We may test this assumption by using data from earlier time periods, i.e. before the treatment, and running an identical regres-sion. In this case, we should observe an insignificant coefficient for the interaction term. We test this assumption below. Note, however, that the existence of parallel trends is a necessary rather than a sufficient condition for causal inference. There might be unobserved factors that changed simultaneously with the treatment and caused changes in the outcome variables, although the pre-treatment trends were similar.
Since it was the vocational education providers – not the students – that ap-plied for the dropout prevention programme, this exercise resembles a natural experiment where receiving the treatment is more or less random from the view-point of the students. It is unlikely that a student enrolling in 2012 would have applied to vocational institutions solely based on whether the schools partici-pated in the dropout programme or not. More likely determinants for school ap-plications are the available study fields, school locations, and friends’ opinions and choices. As most large education providers participated in the programme, the odds were that the average student enrolled in a participating school.
All student-level data in this study were stored in Statistics Finland’s server and analysed using the Fiona remote access system. The statistics package Stata 15 was used in the estimations.
Results
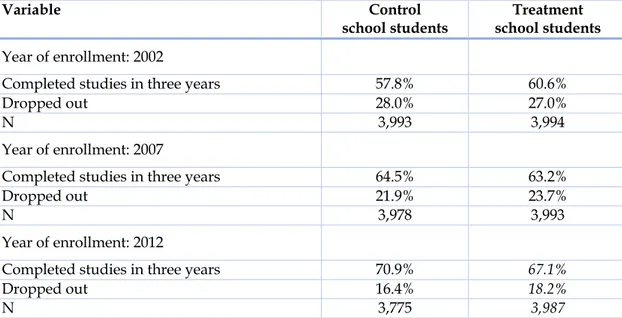
As a first step in our analysis, we tabulate the outcome variables for each enrol-ment year and student group. Combining these tabulations yields the following Table 3. The numerical values of the treated (2012) student cohort are in italics. By design, our data include random samples of students from the treated and
control schools, both before and after the treatment. Note that the percentages do not add up to 100%. There were some students who failed to graduate in three years but did not drop out, i.e. they were still full-time students.
Table 3. Tabulation of outcome variables.
Variable Control
school students
Treatment school students
Year of enrollment: 2002
Completed studies in three years 57.8% 60.6%
Dropped out 28.0% 27.0%
N 3,993 3,994
Year of enrollment: 2007
Completed studies in three years 64.5% 63.2%
Dropped out 21.9% 23.7%
N 3,978 3,993
Year of enrollment: 2012
Completed studies in three years 70.9% 67.1%
Dropped out 16.4% 18.2%
N 3,775 3,987
Table 3 indicates that over the 10-year period 2002–2012, study completion has increased and dropping out has decreased in vocational education. We observe similar development in both student groups. From the year 2002 cohort, 28% of the control school students dropped out. Ten years later, the dropout rate was 16% – an improvement of 12 percentage points. In the treated schools, the year 2002 cohort had a dropout rate of 27%. A decade later, the dropout rate was 18%.
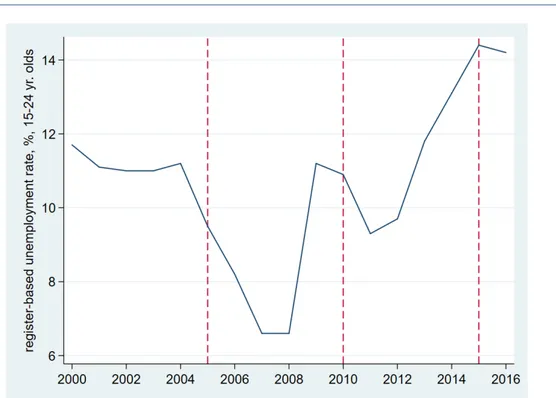
There could be several reasons for these observations. During the years 2002– 2005, when the year 2002 cohort was in vocational education, Finland’s economy and employment were growing rapidly. In these circumstances, there were plenty of alternatives for studying, for instance taking on a full-time job. After the 2008 global financial crisis, Finland’s economy experienced a deep and pro-longed recession. Especially youth unemployment soared, which is depicted in Figure 3. The three vertical lines indicate the years (2005, 2010, and 2015) when the students in our samples should have graduated; i.e. three years after enrol-ling. Additionally, the criteria for youth unemployment benefits were tightened in 2013. Under 18-year-olds without a completed secondary education were no longer eligible for unemployment benefits. In this case, continuing one’s studies despite minor school difficulties could well be worthwhile.
Figure 3. Register-based unemployment rate, percent, 15–24 year olds.
Based on the figures in Table 3, the effect of the dropout prevention programme 2011–2014 is not immediately obvious – in fact, the completion rate increased faster among the control school students than in the treatment schools in the 2007–2012 student cohorts, and the percentage point decrease in dropout rates was equal. However, the simple comparison in Table 3 does not take into account the fact that there were observable differences between the control school stu-dents and the treatment school stustu-dents (Table 2). There might also be unobserv-able systematic differences across time between the two groups of students, for instance related to school locations.
Baseline results
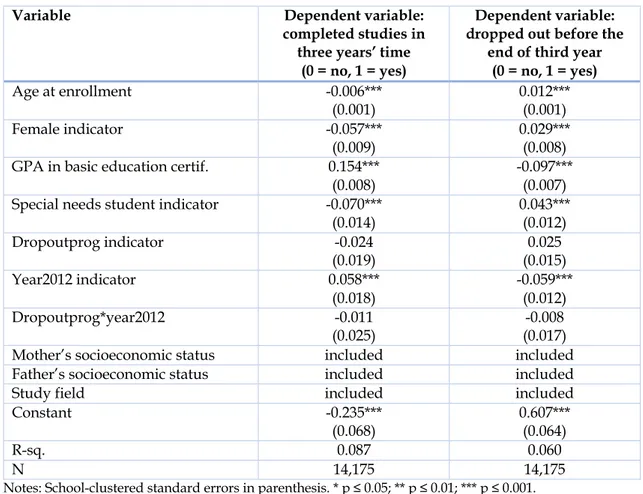
In Table 4, we report the results from our baseline regressions, which include the total available sample from the 2007 and 2012 student cohorts. For brevity, the coefficients on parents’ socioeconomic status and study field indicators are omit-ted and are available on request. As explained above, those enrolled in 2007 be-long to the ‘before the treatment’ cohort and those enrolled in 2012 bebe-long to the ‘after the treatment’ cohort.
Table 4. The effect of dropout prevention program on the probability of study completion and dropping out in Finnish vocational education, baseline difference-in-differences esti-mates.
Variable Dependent variable:
completed studies in three years’ time
(0 = no, 1 = yes)
Dependent variable: dropped out before the
end of third year (0 = no, 1 = yes)
Age at enrollment -0.006***
(0.001) 0.012*** (0.001)
Female indicator -0.057***
(0.009) 0.029*** (0.008) GPA in basic education certif. 0.154***
(0.008)
-0.097*** (0.007) Special needs student indicator -0.070***
(0.014) 0.043*** (0.012) Dropoutprog indicator -0.024 (0.019) (0.015) 0.025 Year2012 indicator 0.058*** (0.018) -0.059*** (0.012) Dropoutprog*year2012 -0.011 (0.025) -0.008 (0.017)
Mother’s socioeconomic status included included
Father’s socioeconomic status included included
Study field included included
Constant -0.235***
(0.068) 0.607*** (0.064)
R-sq. 0.087 0.060
N 14,175 14,175
Notes: School-clustered standard errors in parenthesis. * p ≤ 0.05; ** p ≤ 0.01; *** p ≤ 0.001.
Note that the number of observations is 14,175, which is less than the aggregate N of our pooled samples (3,978 + 3,993 + 3,775 + 3,987 = 15,733). As mentioned earlier, this is due to missing GPA data on some (mostly older) students, who have used self-reported grades in their applications.
The estimates in Table 4 indicate that both study completion and dropping out depend on several observable factors. The student’s advanced age at enrolment has a negative effect on study completion probabilities and a positive effect on dropout probabilities. Female students are more likely to drop out than male stu-dents. Special needs students, who may experience various learning difficulties, exhibit a similar pattern. A high grade point average decreases the probability of dropping out. If the GPA increases by one unit (i.e. from 7.0 to 8.0, for instance), the probability of dropping out decreases by 10 percentage points, ceteris paribus. The GPA in basic education certificate is the most significant independent varia-ble in both equations, with t-values exceeding 10. The socioeconomic status of parents and the study field also have an effect on study completion and dropping
out. The lower the socioeconomic status of parents, the higher the probability to drop out.
We find that the observed characteristics mentioned above account for most of the variation between the control and treatment school students. After control-ling for observable factors, the treatment school students are not systematically different from the control school students. That is, the dropoutprog indicator is not statistically significant. Note that dropoutprog equals one for the participating schools and zero for the control schools, both before and after the treatment.
The year 2012 indicator is highly significant. This variable controls for various nationwide factors that may affect study completion, such as economic fluctua-tions, unemployment, and social benefits. We find that the three-year dropout probability decreased by roughly 6 percentage points from the 2007 enrolment year to the 2012 enrolment year.
We measure the effect of the programme with the coefficient on the interaction term dropoutprog·year2012. This term equals one for the treatment school students enrolled in 2012, and zero otherwise. Overall, the results do not seem very en-couraging: both coefficients are statistically insignificant, by a large margin. Hence, we find zero programme effects on study completion and dropping out in our baseline regressions.
Alternative specifications
The next three Subsections contain statistical specification and identification tests. For a more general discussion, see the concluding Section.
In order to test the robustness of our baseline results, we experimented with various alternative specifications. In our basic equation, there is a single indica-tor, dropoutprog, which controls for unobservable differences between the treat-ment school students (dropoutprog = 1) and the control school students
(drop-outprog = 0). As an alternative, we can use school indicators for each school
sep-arately. Although the identities of schools are withheld in our sample, the data include encrypted school codes, which allows us to estimate school fixed effects. In this case, it is necessary to omit dropoutprog in order to avoid perfect collinear-ity. Our difference-in-differences estimates with school fixed effects are pre-sented in Table 5, Panel A.
As mentioned above, most vocational school students were enrolled in treat-ment schools. Therefore, the probability of being sampled in a 50/50 random sample was somewhat different for the treated students than with the control students. We test whether this could have an effect on our baseline results by using fixed probability weights for both groups in the regression equations. The probability weight for the control school students is 10.5, and the probability weight for the treated students is 1.6. The weights are based on treatment school student enrolment, as reported in the official programme monitoring reports, and
on vocational education statistics. The weighted estimates are reported in Table 5, Panel B.
As a third alternative, we restrict our analysis only to those first-year students who were sixteen years old when enrolling to vocational education. This is by far the largest age cohort in our sample and also the most vulnerable group in many ways. 16-year olds have the least experience in life in general, they may still be in the middle of teenage turmoil, and they are easily led to other pursuits besides studying. Age-restricted estimates are presented in Table 5, Panel C.
Table 5. The effect of dropout prevention program on the probability of study completion and dropping out in Finnish vocational education, alternative specifications, difference-in-differences estimates.
Specification Dependent variable:
completed studies in three years’ time
(0 = no, 1 = yes)
Dependent variable: dropped out before the
end of third year (0 = no, 1 = yes) A. School fixed effects
Dropoutprog indicator (omitted) (omitted)
Year2012 indicator 0.048*
(0.023) -0.060*** (0.018)
Dropoutprog*year2012 -0.005
(0.029) (0.021) -0.005
Control variables as in Table 4 included included
N 14,175 14,175 R-sq. 0.109 0.078 B. Probability weights Dropoutprog indicator -0.021 (0.019) (0.015) 0.024 Year2012 indicator 0.059** (0.018) -0.059*** (0.012) Dropoutprog*year2012 -0.011 (0.025) -0.009 (0.017)
Control variables as in Table 4 included included
N 14,175 14,175
R-sq. 0.083 0.063
C. Sample restricted to students aged 16
Dropoutprog indicator -0.028 (0.022) (0.016) 0.023 Year2012 indicator 0.057* (0.026) -0.053*** (0.015) Dropoutprog*year2012 0.015 (0.033) -0.017 (0.020)
Control variables as in Table 4 included, except for age included, except for age
N 7,543 7,543
R-sq. 0.099 0.057
Regression results in Table 5 align with our baseline estimates, albeit with minor differences in the estimated coefficients. However, the main conclusions remain the same: the programme has had no effects on study completion or dropping out in Finnish vocational education, if we pool the treatment measures and ana-lyse the average effectiveness of the programme.
Effects by treatment category
Next, we further elaborate our programme evaluation and study the programme effects by treatment category. As mentioned above, we classified the treatment measures into three categories, plus one extra category for multiple projects. Re-sults by treatment category are presented in Table 6, Panels A–D. Each sample contains only those treatment school students that were included in a particular treatment category; other treatment school students are omitted. The group of control school students is the same in each regression.
Table 6. The effect of dropout prevention program on the probability of study completion and dropping out in Finnish vocational education, by treatment category, difference-in-differences estimates.
Treatment category Dependent variable:
completed studies in three years’ time
(0 = no, 1 = yes)
Dependent variable: dropped out before the
end of third year (0 = no, 1 = yes) A. Student counselling Dropoutprog indicator 0.021 (0.023) (0.018) -0.009 Year2012 indicator 0.058** (0.018) -0.058*** (0.012) Dropoutprog*year2012 -0.075* (0.033) (0.025) 0.023
Control variables as in Table 4 included included
N 8,857 8,857 R-sq. 0.092 0.059 B. Pedagogical improvements Dropoutprog indicator -0.086*** (0.020) 0.076** (0.023) Year2012 indicator 0.058** (0.018) -0.060*** (0.012) Dropoutprog*year2012 0.040 (0.030) -0.054* (0.027)
Control variables as in Table 4 included included
N 8,763 8,763
C. School infrastructure Dropoutprog indicator 0.021 (0.011) -0.061*** (0.008) Year2012 indicator 0.057** (0.018) -0.059*** (0.012) Dropoutprog*year2012 0.149*** (0.020) (0.011) 0.014
Control variables as in Table 4 included included
N 6,893 6,893 R-sq. 0.101 0.061 D. Multiple projects Dropoutprog indicator -0.021 (0.031) 0.023 (0.023) Year2012 indicator 0.058** (0.018) -0.060*** (0.012) Dropoutprog*year2012 -0.009 (0.035) 0.002 (0.021)
Control variables as in Table 4 included included
N 9,849 9,849
R-sq. 0.092 0.058
Notes: School-clustered standard errors in parenthesis. * p ≤ 0.05; ** p ≤ 0.01; *** p ≤ 0.001.
Examining the results in Table 6, we observe that disaggregating the treatment measures and analysing the treatment categories separately unmasks several in-teresting findings. However, the evidence on the effectiveness of the dropout pre-vention programme seems to be far from clear-cut. The results suggest that when we analyse the probability of study completion, school infrastructure projects ap-pear to be effective – the coefficient on the interaction term is +0.15, i.e. an in-crease of 15 percentage points, with a p-value smaller than 0.001. The drawback is that in our sample, only 89 students were enrolled in schools that participated in infrastructure projects. Hence, this positive result hinges on a relatively small number of observations.
On the other hand, when we study the effects on dropout probabilities, treat-ments aiming to pedagogical improvetreat-ments seem to fare well. The coefficient on the interaction term is -0.054, and the coefficient is statistically significant at the 5% level. Teaching innovations and improvements therefore seem to have a ben-eficial effect on dropping out, decreasing the dropout probability by 5.4 percent-age points. In addition, the treatment sample in this case is considerably larger (N = 1,142) than in the aforementioned infrastructure projects (N = 89).
However, we obtain contrary evidence when we analyse student counselling treatments (Panel A in Table 6). The results seem to indicate that projects aiming to improve student counselling in fact decreased the probability of study comple-tion by 7.5 percentage points, and the estimate is significant at the 5% level. This result is rather counterintuitive, as we would expect at least a zero effect when doing nothing.
Identification tests
Since we observe beneficial effects among those dropout prevention projects that targeted pedagogical efforts, we should also test whether our identifying as-sumption of parallel trends holds. This would require that we find no differences in trends before the treatment. As our sample contains data from three student cohorts, 2002, 2007, and 2012, we are able to test the existence of parallel trends by using the 2002 and 2007 cohorts in a pooled difference-in-differences regres-sion identical to equation (1).9 The regression is restricted to those schools that
undertook pedagogical improvement projects during the dropout prevention programme.
This identification test yields a coefficient of 0.054 for the interaction term
drop-outprog*year2007.10 The p-value, 0.074, is quite close to the conventional risk level
of 5%. That is, the treated and control schools already had diverging trends prior to the treatment. It is instructive to graph the time series of the three-year dropout rates in the control schools vis-à-vis those treatment schools aiming at pedagog-ical improvements. These time series are presented in Figure 4, where the vertpedagog-ical axis measures the share of students who dropped out before the end of the third study year.
Figure 4. Three-year dropout rates in the control schools (N = 3,775–3,993) and in the treatment schools (N = 1,105–1,321) in the 2002, 2007, and 2012 first-year student co-horts, treatment: pedagogical improvements, implemented in 2011–2014.
In Figure 4, we find unambiguous evidence of diverging trends before the treat-ment, i.e. from the year 2002 to the year 2007. In the control schools, the dropout
rate decreased from 0.28 to 0.22 – an improvement of six percentage points. In those vocational schools that were treatment schools in 2011–2014, the dropout rate was approximately constant during 2002–2007. Therefore, we do not have a credible counterfactual for causal inference in our analysis. This would require that the trends were parallel ex ante.
We may apply a similar test to those schools that undertook student-counsel-ling projects during the 2011–2014 dropout programme. This had a seemingly peculiar effect on study completion according to the results in Panel A of Table 6. That is, we use the year 2002 and 2007 student cohorts, and test whether the coefficient on the interaction term dropoutprog*year2007 is different from zero. If our assumption of parallel trends holds, the coefficient should not diverge from zero. In this case, our interaction coefficient is negative, but statistically insignif-icant, by a large margin. Hence, we observe parallel trends ex ante. Taken at face value, this result implies that the dropout programme caused a decrease in study completion rates in those treated schools that concentrated on student counsel-ling projects.
Discussion
We studied the effects of a large-scale dropout prevention programme in Finnish vocational education. Instead of usual pretest-posttest survey data, we utilized highly detailed register data, and standard difference-in-differences estimators. Overall, our results suggest that the dropout prevention programme imple-mented in 2011–2014 did not succeed in reducing dropping out or increasing completion rates in Finnish vocational education. Our finding is in stark contrast to earlier, positive dropout programme evaluation results reported in the Intro-duction.
Otherwise our results are well in line with earlier research on school dropouts. We find that the student’s advanced age, poor academic achievement, learning difficulties, and low socioeconomic status of parents are statistically significant dropout risk factors. We also observe that nationwide changes in legislation and youth labour demand have had an effect on school dropout. These factors may broadly be classified as school-environment-related risk factors.
However, our focus is on the dropout prevention programme 2011–2014, and according to our results, the programme failed to reach its objectives. There could be several explanations for this unfortunate outcome. Firstly, the dropout pre-vention programme in question may have been poorly planned and executed, and therefore produced insignificant results. Secondly, it may also be true that the dropout programme was in fact superbly managed and implemented by the Finnish Board of Education, but our result is just a random statistical coincidence. Thirdly, our disappointing result could be an outcome of using detailed register data, which has zero attrition rate. As mentioned in the Introduction, there have
been dropout prevention programmes where approximately 50% of study sub-jects were unavailable for the posttest survey. As a result, the evaluation esti-mates of these programmes may have been seriously biased in favour of produc-ing desirable results.
Which of the aforementioned explanations is true? Answering this question is plain guesswork at this stage. Poor programme implementation and intervention fidelity might be reasons for indiscernible effects in our case. As mentioned ear-lier, the participating schools were only obliged to follow the general outlines of the programme (‘aiming to increase study completion’), and the implementation details were largely left to the participating schools to decide. As a result, there was considerable variation in the actual treatments. This may not have been the best policy, since finding out ex post what was being implemented is tricky on the basis of haphazard final reports.
We might assume that a random statistical coincidence is unlikely due to our large sample size (over 14,000 in baseline regressions). In any case, our results could be interpreted as a warning sign when pondering the reliability of pretest-posttest study designs, the mainstay in dropout programme research. One could argue that we definitely need more register-based studies on dropout prevention in order to mitigate attrition bias.
Our methodological approach may be compared with a recent study by An-dersen et al. (2018), who evaluated a vocational education dropout prevention programme aimed at improving participating schools’ social environment in Denmark. Andersen et al. used cross-sectional register data (N = 10,190) and lo-gistic regression to estimate the effect on school dropout. Adjusting for age, sex, ethnicity, parental income, prior school dropout, and type of basic course, they find that after two years, the dropout rate was 36% in intervention schools and 40% in control schools. The difference of four percentage points was significant at the 5% level. Hence, they find desired effects for the dropout prevention pro-gramme.
However, the drawback in the research by Andersen et al. (2018) is that the participating schools were not randomly assigned. Rather, the same four voca-tional schools that had originally developed the intervention were chosen as in-tervention schools, while the control schools were chosen by the researchers to match the intervention schools in size, location, and basic courses. Thus, there might be significant self-selection bias in the estimates, since Andersen et al. (2018) are unable to control for unobservable factors due to cross-sectional data. That is, they have no observations from the intervention and control schools prior to the programme.
However, our study is not totally without good news. During our 10-year study period, dropout rates have decreased, and study completion rates have in-creased in Finnish vocational education – by several percentage points. Probable factors and causes for these beneficial changes include the prolonged economic
recession after the 2008 global financial crisis, and the tightened criteria for youth unemployment benefits, which were implemented in 2013. After the year 2013, teenagers without a secondary education could no longer apply for unemploy-ment benefits. Both occurrences have created economic incentives to stay in vo-cational education despite minor school difficulties.
Our study also demonstrates the importance of rigorous evaluation practices. In the official evaluation report of the programme (Ahola et al., 2015), only data from intervention schools were analysed. Improvements in study completion rates during the programme were then erroneously attributed to the dropout pre-vention programme. Since similar development occurred in the non-interpre-vention schools as well, the probable causes were the nationwide economic fluctuations and the legislative changes in unemployment benefits. Counterfactual designs effectively unmask these and other similar confounders.
Our recommendations concern mainly future dropout programme implemen-tation. The participating classes or schools should collect lists of participants, preferably students’ social security numbers. This would enable evaluators to combine participants and detailed register data, avoiding the attrition problem of pretest-posttest designs. The drawback of this study is that we were unable to identify individual students who actually participated in the dropout prevention projects, as this information was not collected by the intervention schools. The implementation of school programmes should be as uniform as possible; in the present case, the schools largely decided themselves what they did with the grant. In retrospect, it may be difficult to decipher what the treatment actually entailed.
Endnotes
1 A simpler design follows the treated group only, but single-group designs were
ex-cluded from the Wilson et al. (2011) and Hahn et al. (2015) review studies.
2 For an illustration related to school programmes, see for instance Weisman and
Gott-fredson (2001).
3 Note that the cutoff point is the end of each calendar year, so that those born in
Sep-tember–December start their school at age 6.
4 The programme’s official name in Finnish was Ammatillisen koulutuksen läpäisyn
te-hostamisohjelma.
5 The current name of the organisation is the Finnish National Agency for Education. 6 Unfortunately, the Finnish education system is plagued with professional jargon. In
this paper, we mainly use the old-fashioned term ‘school’ instead of ‘education provider’ or ‘institution’.
7 For details, see for example Wooldridge (2010), Chapter 6.
8 Note that Statistics Finland withheld the identities of students and schools in our data.
Likewise, tabulating the minimum or maximum values of GPAs is not allowed to protect the students’ identities.
9 The only difference is that the special needs education status dummy is not available
for 2002. This has no effect on the results, since the dropout prevention estimate in Table 6, Panel B is nearly identical if special needs education status is omitted from the model.
10 Full results are available on request.
Note on contributor
Ville Vehkasalo is a Principal Performance Auditor in the National Audit Office of Finland, specialising in regional policies, employment policies, and education policies.
References
Ahola, S., Saikkonen, L., & Valkoja-Lähteenmäki, L. (2015). Ammatillisen
koulutuksen läpäisyn tehostamisohjelma – Arviointiraportti [Programme for
improving graduation rates in vocational education – Evaluation report]. Helsinki: National Board of Education. (In Finnish with an English abstract.) Andersen, S., Rod, M., Holmberg, T., Ingholt, L., Ersböll, A., & Tolstrup, J. (2018).
Effectiveness of the settings-based intervention Shaping the Social on preventing dropout from vocational education: A Danish non-randomized controlled trial. BMC Psychology, 6:45, 1–11.
Cerda-Navarro, A., Sureda-Negre, J., & Comas-Forgas, R. (2017). Recommen-dations for confronting vocational education dropout: A literature review.
Empirical Research in Vocational Education and Training, 9:17, 1–23.
Campbell, C. (2015). The socioeconomic consequences of dropping out of high school: Evidence from an analysis of siblings. Social Science Research, 51, 108– 118.
Ecker-Lyster, M., & Niileksela, C. (2016). Keeping students on track to graduate: A synthesis of school dropout trends, prevention, and intervention initiatives.
The Journal of At-Risk Issues, 19(2), 24–31.
Finnish National Agency for Education. (2019). Education system in Finland. Retrieved 10. June, 2019, from
https://www.oph.fi/english/education_system
Freeman, J., Simonsen, B., McCoach, D.B., Sugai, G., Lombardi, A., & Horner, R. (2015). An analysis of the relationship between implementation of school-wide positive behavior interventions and supports and high school dropout rates.
The High School Journal, 98(4), 290–315.
Goulet, M., Archambault, I., Janosz, M., & Christenson, S.L. (2018). Evaluating the implementation of Check & Connect in various school settings: Is intervention fidelity necessarily associated with positive outcomes? Evaluation
and Program Planning, 68, 34–46.
Gubbels, J., van der Put, C.E., & Assink, M. (2019). Risk factors for school absenteeism and dropout: A meta-analytic review. Journal of Youth and
Adolescence, 48, 1637–1667.
Hahn, R.A., Knopf, J.A., Wilson, S.J., Truman, B.I., Milstein, B., Johnson, R.L., Fielding, J.E., Muntaner, C.J.M., Jones, C.P., Fullilove, M.T., Moss, R.D., Ueffing, E., & Hunt, P.C. (2015). Programs to increase high school completion: A community guide systematic health equity review. American Journal of
Preventive Medicine, 48(5), 599–608.
Kristman, V., Manno, M., & Côté, P. (2004). Loss to follow-up in cohort studies: How much is too much? European Journal of Epidemiology, 19, 751–760.
Kristman, V., Manno, M., & Côté, P. (2005). Methods to account for attrition in longitudinal data: Do they work? A simulation study. European Journal of
Epidemiology, 20, 657–662.
Ripamonti, E. (2018). Risk factors for dropping out of high school: A review of contemporary, international empirical research. Adolescent Research Review, 3, 321–338.
Statistics Finland. (2019). Educational structure of population. Retrieved 10. June, 2019, from http://pxnet2.stat.fi
Weisman, S.A., & Gottfredson, D.C. (2001). Attrition from after school programs: Characteristics of students who drop out. Prevention Science, 2, 201–205. Wilson, S.J., Tanner-Smith, E.E., Lipsey, M.W., Steinka-Fry, K., & Morrison, J.
(2011). Dropout prevention and intervention programs: Effects on school completion and dropout among school-aged children and youth. Campbell
Systematic Reviews, 7(1):8, 1–61.
Wooldridge, J.M. (2010). Econometrics of cross section and panel data (2nd ed.).