Age differences
in women’s shopping for clothes
behavior
Gotland University Spring semester 2011
Subject: Bachelor Thesis in Business and Economics 15 ECTS Program: EKO08
Author: Oxana Shchudro Supervisor: Eva Sjöqvist
2
Table of Contents
Abstract ... 4
1. INTRODUCTION ... 5
1.1BACKGROUND AND PROBLEM DISCUSSION ... 5
1.2RESEARCH QUESTION AND AIM ... 6
2. THEORETICAL FRAMEWORK AND HYPOTHESES DEVELOPMENT ... 8
2.1THE CONSUMER’S CULTURE ... 8
2.1.1. The teen market, 14-20 ... 9
2.1.2. Market segment between 21 and 29 ... 10
2.1.3. Market segment between 30 and 44 ... 10
2.1.4. Market segment between 45 and 64 ... 10
2.1.5. Market segment from 65 and older ... 10
2.2THE PSYCHOLOGICAL CORE ... 11
2.2.1. Motivations ... 12
2.2.2. Values ... 13
2.2.3. Frequency ... 13
2.3THE PROCESS OF MAKING DECISIONS ... 14
2.3.1. Information source ... 14
2.3.2. Store selection criteria ... 15
3. METHODOLOGY ... 16
3.1QUESTIONNAIRE ... 16
3.2LIMITATIONS AND CRITICISM ... 18
4. STUDY RESULTS ... 20
5. ANALYSIS OF THE RESEARCH RESULTS AND DISCUSSION ... 25
5.1ANALYSIS OF THE HYPOTHESIS 1 ... 25
5.2ANALYSIS OF THE HYPOTHESIS 2, HYPOTHESIS 3 AND HYPOTHESIS 4 ... 25
5.2.1 Analysis of motivations ... 26
5.3ANALYSIS OF THE HYPOTHESIS 5, HYPOTHESIS 6 AND HYPOTHESIS 7 ... 28
5.4.ANALYSIS OF THE HYPOTHESIS 8 ... 30
5.5.ANALYSIS OF THE HYPOTHESIS 9 ... 30
5.6.ANALYSIS OF THE HYPOTHESIS 10 ... 31
5.7.ANALYSIS OF THE HYPOTHESIS 11 ... 32
5.7.1 Store selection criteria ... 32
6. CONCLUSIONS ... 33
6.1FURTHER RESEARCH ... 34
References ... 35
3
ANNEX 2. Questionnaire (in Swedish) ... 36 ANNEX 3. Tables ... 39 ANNEX 4. Regression analysis ... 40
4
Abstract
The main aim of this research was to investigate the differences of women’s consumer behavior when shopping for clothes. To investigate these differences quantitative approach was used. In order to collect data for analysis a questionnaire was developed. During the study the following aspects were analyzed: frequency of shopping and expenditure, women’s values, store selection criteria, motivations and sources of information women usually use.
After reviewing numerous scientific articles, eleven different hypotheses were developed, in order to be tested in the course of this study:
H1: Women’s consumer behavior varies with age H2: Sexual attraction motivation decreases with age H3: Conformity motivation decreases with age
H4: Fashion expression motivation decreases with age H3: The importance of comfort increases with age H6: The importance of quality increases with age
H7: The importance of knowledgeable staff increases with age H8: Younger women shop clothes more often
H9: The influence of impersonal sources of information increases with age H10: Younger shoppers are more price-conscious
H11: It is important for older consumer to be known or recognized in the store To test these hypotheses, the data from fifty nine women was collected with the help of the questionnaire. Then, all respondents were divided into five age cohorts in order to structure the results and analyze differences in every age cohort.
After having analyzed all the gathered data, five hypotheses were confirmed, while other six hypotheses were rejected. Hypothesis 1 was rather general and it was confirmed in the very beginning. All the other hypotheses were analyzed with the help of regression analysis in Excel. After testing every hypothesis, author of the thesis came to the conclusion that hypothesis 2, hypothesis 5, hypothesis 8 and hypothesis 10 are be confirmed, while hypothesis 3, hypothesis 4, hypothesis 6, hypothesis 7, hypothesis 9 and hypothesis 11 are rejected.
5
1. INTRODUCTION
Shopping is an activity that every one of us faces nearly every day. We shop for food, books, cars, newspapers, clothes and any other thing that one might need. When it comes to shopping each of us has his own attitude towards it. Someone sees it as a leisure activity, pleasure,
entertainment and opportunity to spend time with friends, while, at the same time, someone else might see it as a necessity or even boredom or torment.
We all have a different point of view, preferences, likes and dislikes – all of it creates our unique consumer behavior. Solomon (2010) notifies that consumer behavior covers many issues such as processes involved when individuals or groups select, purchase, use or dispose of products as well as ideas or experiences to satisfy needs and desires. Though Munter (2004) underlines the fact that consumers at different age have different needs and wants, Perkins (1993) informs that people who belong to the same age group tend to share a set of values and common cultural experiences that they carry throughout life.
According to Statistics Sweden (SCB, 2010) one of the top expenditures of Swedish households in 2009 was clothes. Furthermore, according to the separate statistics for men and women (SCB 2010b, SCB 2010c) women tend to spend 70% more money on clothes than men. Which makes it more interesting and important to analyze women’s shopping for clothes behavior. Thus, as time is an issue when writing a bachelor thesis, the following study will analyze only women’s and not men’s shopping for clothes behavior.
1.1 Background and problem discussion
Engel et. al. (1995, p. 12) writes the following: “Understanding and adapting to consumer motivation and behavior is not an option – it is an absolute necessity for competitive survival”. Furthermore they inform that by understanding consumer’s motivations and behavior one can lessen the risk of marketing failure.
Solomon (2010) emphasizes that understanding consumer behavior is good business. He further explains that since firms exist to satisfy needs they can only satisfy those needs to the extend they know and understand people or organizations who will use the products and services that they are trying to sell. Which simply means: the more you know your customer the more you can earn.
Hoyer and MacInnis (2000) identify four different groups that might benefit from studying consumer behavior: marketing managers, ethicists, public policy makers and regulators, and consumers. They inform that in order for marketing to be effective, managers have to clearly understand customer’s needs and wants and that the study of consumer behavior provides critical information for developing marketing strategies and tactics. Ethics can also be an issue when studying consumer behavior. Some marketing practices can stimulate customers in negative ways, for instance, advertisements that show smoking as a “cool” habit might stimulate people to smoke. To prevent these tendencies we should examine what influence the costumer and what consequences it has. Therefore, consumer behavior can be useful for regulators and government agencies in developing laws and policies designed to protect customers.
6
Brettman’s research in 1979 has shown that consumers better understand how products differ when they get to see a matrix, chart or a grid, comparison of different brands and their
characteristics. It means that consumer reports help people to choose a product or make a decision whether to by one or not.
There are numerous studies that examine one or another part of the consumer behavior. Shopping motivations have become one of the central topics in consumer behavior research. Many academics such as Chen-Yu and Seock (2002), Kim Y., Kim E. Y. and Kang (2003), Martin (2009) focused their researches on the motivation issue. For instance, Kim et al. (2003) indicated five dimensions for shopping motivations: service motivation, economic motivation, diversion motivation, eating-out motivation, and social motivation. They also suggested directions for marketers and educators to follow in establishing positive programs to provide social support for teens.
In 2009 Martin examined consumption motivations and perceptions of malls of mothers and daughters; in the course of the research he found significant differences in their consumer motivations. Mothers exhibit a significantly greater objective motivation to consume while daughters exhibit a significantly greater social motivation to consume, but the difference in the perception of malls wasn’t found.
Joung and Miller (2007) studied the effect of shopping on older female consumers and as the result they found that the variables such as age, fashion involvement, frequency of participation in leisure and informal social activities, and a few more, contributed to their life satisfaction. There are various studies that focus also on some other aspects and implications of consumer behavior, such as decision-making process when shopping (Mitchell, 2004) or exploring differences (Moye, 2003) or information sources (Chen-Yu, 2002; Kim, 2003) or brand
sensitivity (Lachance, 2003); generally they describe one particular age group and the majority of them examine adolescence group, age 13 to 19. Since women tend to spend a lot of money on clothes at every age (SCB, 2010c) it is important to understand their consumer behavior at every age, by dividing them into different age groups.
1.2 Research question and aim
The purpose of this thesis is to examine consumer age differences in behavior of Swedish women when shopping for clothes. Consequently, the research question of the thesis is:
How does women’s consumer behavior differ at different age?
Based on the review of the numerous scientific articles on consumer behavior, it was decided to focus on the following five aspects of consumer behavior: frequency, expenditure, purchase motivations, information sources and store selection criteria. It is important to understand whether women of a certain age group see clothes shopping either as a leisure activity or as a necessity. It is also important to know how much time they are willing to spend on shopping in general or maybe in one particular store. It is also good to know what sources of information customers relay on or consider when choosing a certain product. Through understanding of motivations marketers and fashion industry, in general, could understand better what their target customers are looking for and though efficiently satisfy their needs. Examining store selection
7
criteria we could say which features create value for the customer and which do not, and though concentrate the effort on the things that are important.
Since consumers tend to want as much value as possible for their money, Rahul Jacob in 1993 suggested that a defense against this trend could be price-stripping by eliminating the costs that don’t add value for the customer while focusing on the elements that do make a difference for a customer. Since this thesis is supposed to provide some valuable information for people within fashion industry and marketers, another important question to be answered is:
Which additional attributes add value for the customer and which do not, at different age? As women at different age might want different things when shopping for clothes, the thesis is aiming to define the main differences in women’s consumer behavior and try to outline the attributes that influence or create a big difference for them at different age.
Engel et al (1995) writes that all managers must become absolute analysts of consumer
motivation and behavior, which means that the results of the research can be used by managers. It can also be used by marketer, especially in the fashion industry to apply them to a female customer in a more efficient way since it is always good to know as much as possible about the customer.
8
2. THEORETICAL FRAMEWORK AND HYPOTHESES DEVELOPMENT
Hoyer and MacInnis (2000) claim, that consumer behavior means more than just how a person buys products – it also includes consumer’s use of services, activities and ideas. Furthermore, authors write that consumer behavior involves understanding whether, why, when, where, how, how much, how often, and how long consumers will buy, use, or dispose of an offering. Mowen and Minor (1998) define consumer behavior as a study of the buying units and the exchange processes involved in acquiring, consuming, and disposing of goods, services, experiences, and ideas. This definition suggests that the exchange process involves a series of steps, beginning with the acquisition phase, moving on to the consumption phase, and ending with the disposition of the product or service. When investigating acquisition phase, researches analyze the factors that influence consumers’ product and service choice. In investigating the consumption phase researches analyze how the product or a service is being used and what experiences this process obtain. The disposition phase reflects what consumers do with the product or a service once they are finished using it. (Mowen & Minor, 1998)Hoyer and MacInnis (2000) divide consumer behavior into four different domains (see
illustration 2.1): the consumer’s culture, the psychological core, the process of making decisions and consumer behavior outcomes. The consumer culture covers age, gender, household
influences, social influences, personality, values and lifestyle. The psychological core is the source of information upon which consumers’ decisions can be based. The process of making decisions covers problem recognition and information search, judgment and decision making, and post-decision processes. Consumer behavior outcomes concern symbolic consumer behavior as well as adoption of, resistance to and diffusion of innovations. (Hoyer and MacInnis, 2000)
Illustration 2.1. Four domains of consumer behavior
2.1 The consumer’s culture
Hoyer and MacInnis (2000) claim that cultural environment, age, gender, friends, family and social class affects the way people process information, the kind of decisions they make as well as it affects their values and lifestyle.
Solomon et al. (2010) affirm that as people grow older, their needs and preferences change in unison with others, who are close to their own age. It means that age significantly influences our identity, and as the result, our consumer behavior, which means that people are more likely to have some things in common with others from the same age cohort.
9
Solomon et al. (2010) define term “age cohort” as group, that consists of people of a similar age, that usually share similar experiences, memories and perceptions. They further report that marketers usually target one or several age cohorts, since they understand that the offering will not appeal to people of any age while it can be interesting to a certain age cohort.
2.1.1. The teen market, 14-20
Solomon et al. (2010) support the statement that teen market totally rules. European youth has a spending capacity of more than 61 billion euros per year which makes it a powerful demographic and an important culture to understand for marketers in order to maintain business’ relevance in the future. According to Gunter and Furnhamn (1998), teenagers have revealed to be rather sophisticated consumers; and clothes are teenagers’ top spending category. Gunter and Furnham (1998) have also indicated that adolescents spend most of their money on clothes, records, stereo equipment and travel. The study of Stoneman (1998) has confirmed, as well, that clothes were the top spending category for teens.
For teenagers puberty can be the best and the worst time. At this age teens are facing a lot of changes since they leave a role of a child and prepare to adopt the role of an adult. These changes create a lot of uncertainties in the minds of teenagers. At this age they are struggling to find their unique identity and, at the same time, they have a great need to belong to something. That is why, at this stage of their life, “looks” and choices of activities are crucial for social acceptance. Teenagers and their perception of the “right” way to look and behave are greatly affected by cues that they receive from their peers and advertising. (Solomon et. al. 2010)
A study, conducted by Tootelian and Gaedeke (1992), indicated that the thing, teens like most of all about shopping, is being with their friends. They have also suggested that marketing efforts should target opinion leaders of the teen groups. Solomon (2003) informs that advertising, which targets teenagers, is typically action-oriented and depicts a group of “cool” teenagers that uses the product. Solomon (2003) further writes that teenagers use products to express their identities, explore their newfound freedom and to rebel against the authority of their parents and other social agents. Hoyer and MacInnis (2000) affirm the fact that clothes are very important for teens because they have a great symbolic value. In fact, clothes establish an identity and a way of labeling people as jocks, part of the in-crowd, freaks or dweebs.
According to Solomon (2003), teenagers want to find their independence so they try to break free from their parents, but at the same time they are afraid of being alone so they try to attach themselves to a support culture, for instance, their peers. At this phase, an individual faces a lot of contradictions: teens feel a need to rebel against social standards of behavior and appearance, while they still want to be accepted by others. Kim (1993) assert that teens can be self-centered, obsessed with their looks and needs, but on the other hand, they feel a need to connect with others on a meaningful level.
Solomon (2010) writes that throughout time, teens had to come with family authority and peers pressure and nowadays many teenagers also have to cope with additional household pressure, where they have to take responsibility for cooking, cleaning and shopping. That is why nowadays adolescents are far more experienced shopper than teens of the twenty years ago. According to Engel and MacInnis (2000) teens are very particular about how they spend their money and will shop extensively for sales and bargains.
10 2.1.2. Market segment between 21 and 29
The cohort of consumers between ages of 21 and 29 is a powerful force in years to come. The income of this cohort might be below expectations of the marketers but nevertheless they still constitute a significant market segment. The partial reason for this, is the fact that many of people at this age still live at their parents’ home and as the result have more disposable income. Europeans at their twenties are estimated to have a spending power of 90 billion euros per year. This age cohort is essential for the companies that sell beer, fast food and cosmetics. (Solomon, 2010)
Solomon (2010) also informs that since people at their twenties have been doing the family shopping for a long time now, marketers consider them to be a more sophisticated about evaluating advertisement and products.
2.1.3. Market segment between 30 and 44
Younger people of this segment usually face the time in their life when they form a family, buy their first home and their first new car. This is also the age when young families borrow heavily to duplicate the kind of standards of living their parents achieved. All of it means that they have a smaller amount of the disposable income, since they have to pay the mortgage or other credit payments. As the result they often buy from value-oriented retailers. (Engel et. al., 1995) This is a diverse group the individuals of which are sometimes portrayed as being alienated. There are also some members of this group who are still afraid not to match or surpass their parents’ level of success, which makes them feel disillusioned and less materialistic than other age groups.
2.1.4. Market segment between 45 and 64
People at the age between 45 and 64, are often called “baby boomers” or “boomers”. People in this age cohort are the source of many fundamental cultural and economic changes. As teenagers this generation created a revolution in style, politics and consumer attitudes. As they have aged their collective will has been behind many cultural changes. And as they are older they still influence the culture. (Hoyer & MacInnis, 2000)
Solomon (2010) informs that this group, in its mid-forties and early sixties, exerts the most impact on consumption patterns. Nowadays, these people, who are moving into their peak earning years, are responsible for the most of the market growth. They have different emotional and physiological needs from the generation before them. They are rethinking their role in the retirement and they see themselves not so much in chronological age but as simply entering a new life stage which brings them new experiences and opportunities. Wolfe (1994) affirms that mature consumers value the bonds they have with their friends and family. Harris (2000) claims that they want to feel younger, take on new opportunities and be technology-literat.
2.1.5. Market segment from 65 and older
The stereotype about an old widowed woman that sits in her chair, living a lonely and color-blind life is long broken. Until recently, many marketers had this image of this segment. But, nowadays, people are healthier and live longer. The newer and more accurate image of an elderly is created. Nowadays, it is an active and interested in what life has to offer individual. People at
11
this age are enthusiastic consumers with a possibility and desire to buy many products and services. (Solomon, 2010)
Solomon (2010) confirms that this segment will continue to grow steadily, since baby boomers are aging. Solomon (2010) also claims that elderly are trying to keep a healthy lifestyle and care about their nutrition. They are multidimensional and more active than we might think. Many either continue to work or do volunteer work or engaging in taking care of their grandchildren. This segment is not only growing but it has large amounts of discretionary income, since by this time of their live, they are most likely to finish paying the mortgage, so they, probably, own the place where they live; they no longer have to spend money on rising their kids or paying for their education. Gardyn (2002) suggests that, often, it is a best target group for luxury products. In 1994 Wolfe conducted a study, where the key values that are relevant to older consumers were identified. These values are: autonomy, connectedness, altruism and personal growth. Autonomy means that older consumers have a strong need to remain independent; they want to lead an active life and to be self-sufficient. Connectedness responds to the fact that older consumers do not relate well to their own age group. Most elderly reports that people of their age act “to old” and that they feel themselves, in average, ten years younger than they really are. Altruism means that elderly want to give something back to the world. Personal growth reflects the elderlies’ desire to try new things, experience something new and develop their potential. (Wolfe, 1994) Solomon (2010) emphasizes the fact that this segment is diverse, which means that we should neither assume that all elderly are active, happy and ready-to-spend consumers nor that they are a group of senile, poor and immobile people.
From the existing age research, it is possible to suggest that some aspects of women’s consumer behavior will vary with age. Therefore, the following general hypothesis is developed:
H1: Women’s consumer behavior varies with age.
2.2 The psychological core
The psychological core covers motivation, ability, opportunity, exposure, attention and perception, attitude formation, memory and retrieval. These are the source of capabilities and information upon which consumer’s decision will be made. (Hoyer & MacInnis, 2000) Motivation, ability and opportunity to make an acquisition are the key factors whether a
consumer will pay attention to the displayed information, how they will form their attitudes and how much effort they are willing to put into the information search and product choice (Hoyer & MacInnis, 2000).
Motivations are enhanced when they regard something that is personally relevant or consistent with our values, goals and needs. The ability to achieve a goal depends upon consumer’s knowledge and experience, intelligence, education, age and money resources. The achievement of a goal also depends on consumers’ opportunity to attain them. The opportunity to achieve a goal is determined by the time, distractions, amount of information, complexity and repetition. (Hoyer & MacInnis, 2000)
12 2.2.1. Motivations
Solomon et.al. (2010) write that motivation refers to the process that causes people to behave as they do. Authors further claim that motivation occurs when a need is aroused that the consumer wishes to satisfy. Mullen and Johnson (1990) write that, in the context of consumer behavior, the result of motivations is a consumer’s need or desire for the product. Hoyer and MacInnis (2000) claim that motivated consumers are ready and are willing to engage in the goal-relevant
activities, for instance, information search or making a decision. Bohdanowicz and Clamp (1994) write that motivations provide consumer with the reason to buy.
Evans (1964) conducted a study that investigated adolescents clothing motivations and had found that the need for recognition and conformity were the top shopping motivations for them. 50% of the respondents expressed that the most important motivation for them was the desire for recognition and 38% indicated the desire to conform. (Evans, 1964)
Chen-Yu and Seock (2002), when researching motivations of adolescents, have found that the strongest motivations for shopping clothes for teens were recreation and sexual attraction motivations and after that, it was conformity and recognition motivations. Sproles (1979) confirms the fact that clothes stimulate sexual consciousness and attraction between people. Laver (1969) affirmed that people often wear arousing clothing to win a mate or to sustain the interest of their spouses. Hausman (2000) agrees that clothes are an important element in competing with each other in terms of attractiveness. Hausman (2000) further highlights that shopping for clothing also satisfies hedonic motivations such as need for fun, novelty and variety.
Belk and Pollay (1985) identified the important role of clothing in presenting a desired image and lifestyle. In the study of Birtwistle and Tsim (2005) it was established that mature women believe that garments were an expression of their personality. The researches have also
confirmed that women in age between 45 and 54 were more interested in fashion and considered shopping as a leisure activity than the older age groups. Nevertheless, the study of Tongren in 1988, proved that older women consider themselves to be fashion conscious.
The study of Nam et. al. (2007) has shown that older women, at age 65 or older, shop more for need and pleasure than conformity. They also established that despite the suggestion that fashion is important for women over 65 as well as for mature women, their decision were heavily
influenced by fit and comfort.
All of the above gives a ground to formulate the following hypotheses:
H2: Sexual attraction motivation decreases with age. H3: Conformity motivation decreases with age. H4: Fashion expression motivation decreases with age.
13 2.2.2. Values
Hoyer and MacInnis (2000) assert that consumers are more motivated to engage in a buying process when the product or service corresponds to their values. Hoyer and MacInnis (2000, p. 60) identify values as “beliefs that guide what we regard as important or good.”
Taylor and Cosenza (2002) point out that self-expression is extremely important for adolescents, that is why clothing style, fit and look are three, most important, criteria when evaluating clothes and making a purchase decision.
Birtwistle’s and Tsim’s (2005) study of mature women’s preferences determined that quality and comfort are the key values for them when choosing clothes. Most interviewees wanted garments to incorporate key fashion trends but not be too fashion forward that they could not be worn for a number of seasons. Nam’s et.al. study in 2007 confirm that comfort as well as fit are the most important characteristics to mature women, moreover this features plus quality are more
important to them than fashion, when making a purchase decision. The research of Lu and Shih (1997) about consumer values, suggests that comfort value increases with age.
Many older women consider them to be fashion conscious. Fashion consciousness refers to a person’s degree of involvement with the styles or fashion of clothing. An individual does not have to be either a fashion opinion leader or a fashion innovator to be considered fashion conscious. Furthermore the perception of what is fashionable may vary with age. (Nam et.al. 2007)
The research of Birtwistle and Tsim (2005) showed that for women in their forties early fifties quality was more important than for older women, whereas the comfort factor became more important with age. Nevertheless, Tongren (1988) emphasizes that women do not want specially designed elderly features, because they do not like to be reminded of their age.
The study of Birtwistle and Tsim (2005) has shown that mature women were fabric-conscious. They preferred natural fabrics, such as cotton, silk, wool and linen. Women of this age cohort have also a lot of service requirements, such as, smiling, friendly and knowledgeable staff that provides honest appraisal. Tongren (1988) confirms that mature women enjoy personalized shopping. Birtwistle and Tsim (2005) write that most respondents stressed the importance of being offered assistance, yet they wanted to be left to browse if they declined the assistance. After reviewing all the scientific articles mentioned above, it can be hypothesized that:
H5: The importance of comfort increases with age. H6: The importance of quality increases with age. H7: The importance of knowledgeable staff increases with age.
2.2.3. Frequency
Examining the frequency we are aiming to investigate how often a person shop in a certain period of time. The research of adolescents’ consumer behavior, conducted by Chen-Yu and Seock in 2002, has shown high frequency of shopping in the teenager’s cohort. 44,1 % of
14
females answered that they shopped for clothes two to three times a month, 27,9% shopped once a month and 13,2% shopped once a week.
Tongren (1988) claims that older women shop less frequently for clothes than the younger ones. The study of Nam et. al. in 2007 indicated that younger retirees shop more often than the older ones, for instance, younger part of the over-sixty-five cohort shop 3-5 times a year while the older part of the cohort indicated that they usually shop 1-2 times a year. Therefore, it is hypothesized that:
H8: Younger women shop for clothes more often.
2.3 The process of making decisions
Element of the psychological core triggers the problem recognition and information search. The search for information gives a person an insight into where one might go, what one might look for, what stores one will prefer, how much it might cost and when the best travel time might be. (Hoyer et. al., 2000)
According to Solomon et.al (2010), information search is the process when a person scans his environment for appropriate data in order to make a reliable and reasonable decision.
2.3.1. Information source
All the information sources can be divided into two kinds – internal and external sources (Engel et.al., 1995; Hoyer et. al., 2000; Solomon et.al., 2010). Internal search suggests the memory retrieval while the external search involves collection of data from the external environment, for instance, family, marketplace or friends (Engel et.al., 1995). Usually internal search is the first source of information. Each consumer has a set of knowledge and experience that can be recalled in order to make a decision.
According to Engel et. al (1995), external source of information can be broken down into two groups personal and impersonal sources. Chen-Yu and Seock (2002) summarize various personal and impersonal data sources in their study. Personal sources are: friends, boyfriend/girlfriend, mother, father, sibling, grandparents and salesperson. Impersonal sources are the sources without a direct contact with another human being, for instance, magazines, books, television, internet, celebrities or street-wear observations. (Chen-Yu & Seock, 2002)
More and Moschis (1978) revealed the fact that younger consumers tend to rely on personal sources of external information when purchasing something. Koeser and May (1985) found out that parental influence on purchasing of youth decreases with age while the influence of siblings, friends and impersonal sources of information increases. The study of Lachance et. al. (2003) indicates that friends are the strongest influence and the most important source of information among teenagers. Moore and Moschis (1978) have also found that younger people tend to spend less time on an overall information search than older ones.
The study of women of age 65 and older has shown that the main sources of extern information about new fashions were encountered via catalogue illustrations, social gatherings, window displays and friends (Nam et al. 2007). Kaiser and Chandler (1985) observed that the over-sixty-five cohort use television as the source of information about appearance and fashion. Greco and
15
Paksoy (1989) suggest that consumers that are more interested in fashion rely more on mass media information sources that the ones who are not very fashion-conscious.
Thus it is possible to suggest that the influence of impersonal sources of information, such as books, magazines, internet and so on, increases with age.
H9: The influence of impersonal sources of information increases with age.
2.3.2. Store selection criteria
According to Ko (1995), store selection criteria are the appealing features of the store that draw customers into the store. There were made numerous studies that confirmed the fact that store image has a direct impact on consumer’s behavior and purchasing patterns (Samli, 1989; Sirgy et al., 2000). Scott (1985) identifies store selection criteria as the criteria that consumers consider when making a decision where to shop.
Some studies have shown that different stores might have different store selection criteria for their customers. For instance, specialty store customers value the most expertise of the salesmen and the variety of brands, while the customers of department stores might value the most the store location and warranty policies. (Schiffman, Dash & Dillon, 1977)
Shim and Kotsiopulos (1992), when examining store attributes and their importance for
customers, came to the conclusion that consumer’s shopping orientation was the most important determinant. For instance, consumes that are fashion conscious value the brand name of the store, its visual image and service it gives. Meanwhile, shoppers that are time and convenience conscious, value good location and ease of access. Consumers that are price conscious, place high importance on frequent sales, low prices and excellent return policies. The study of Bellenger et. al. (1977) showed that people, who shop for recreational reasons, value store decorations, product variety and product quality. Lumpkin’s study in 1985 has shown that active shoppers, who purchase frequently, place high importance on brand name, location of the store and shopping ease, while, economic shoppers look for low price and high quality.
Gunter and Furnham (1998) found that adolescents tend to shop in a wide variety of retail outlets; they also tend to compare prices and brands in different stores and only then make a purchase. Moore & Moschis (1978) write that price and brand name have shown to be the most important store-choice criteria for adolescents.
The study of Nam et. al. (2007) showed that women over 65 years old shop more frequently in specialty stores and department stores. The study of Tongren (1988) identified that older women often shop in the stores where they are known but at the same time they might shop elsewhere. Nam et. al. (2007) have found that catalogue shopping and shopping in discount stores are also popular among this age cohort, while, on the other hand, Internet is a very rare choice of a place to shop.
Therefore, it is hypothesized that:
H10: Younger shoppers are more price-conscious.
16
3. METHODOLOGY
The following research is concentrated on finding the differences of consumer behavior among females of different age and to underline the factors that create the most value for them. To do so the quantitative approach was used. The quantitative approach was chosen because of its
possibility to enhance generalization and a possibility to process a wide sample of respondents. This thesis is also based upon deductive method. First, relevant theory was gathered to give a perspective and to formulate hypotheses that in the further analysis will be either confirmed or rejected.
To conduct the following research and collect data, the questionnaire was used. Creswell (2009) states that survey research provides numerical description of trends, opinions and attitudes of a population, by studying a sample of that population. According to Bryman and Bell (2007) surveys are easier and faster to administer, furthermore respondents are not being influenced by researcher’s personal characteristics, which gives us an opportunity to get more precise and honest answers.
According to Hair et. al. (1995), the minimum recommended sample-size for multivariate analysis is a ratio of 1:10 between items measured and the number of cases. This means that at least ten women, who belong to one age cohort, should be asked – in order to be able to make any kind of generalizations. As the result, in the course of the research fifty nine women filled in the questionnaire. All of them were chosen randomly in the library or in the street.
Afterwards, when all the data was collected, the regression analysis was used. Regression analysis analyzes the relationship between several variables, more precisely, between one dependent variable and one or more independent variables. In other words, regression analysis helps to understand how the value of the dependent variable varies when the value of the independent variable changes. To perform regression analysis Excel’s Analysis ToolPak was used.
3.1 Questionnaire
The questionnaire opens up with a brief introduction that explains the reason and the aim of the research. It is done in order for respondents to know why they have to answer the questions, where the questions come from and why their responses are important.
To improve the layout of the questionnaire it was decided to divide all the questions into 3 parts. The first part contains five general questions, among which four closed questions and one open question. Four closed questions concern age, frequency of shopping and expenditure of the respondent, while one open question investigate the spontaneous feeling about shopping. The open question comes in the beginning in order to capture the unusual and unexpected answers of the respondents. Even though open questions provide more qualitative data they are more
fastidious, difficult and time-consuming for a respondent to answer. That is why mostly closed questions were used in the questionnaire, moreover closed questions are easier to code and analyze.
17
The second part of the questionnaire contains two questions. The first question is about
information sources that women use when they make a purchase decision. This question suggests the list of twelve different information sources, both personal and impersonal. Personal sources are: a friend, partner, mother, father, sibling, grandparents or a salesperson. The following impersonal sources are suggested: magazines, books, television, Internet, celebrities and street observations. The respondent is also given an option to add her own source of information that wasn’t mentioned in the given alternatives. Afterwards, women are asked to identify the level of influence of every information source from one to seven, where one is “not influenced by the source” and seven is “strongly influenced by the source”. The second question in the second section was developed to investigate and analyze women’s values when selecting a particular piece of clothing. Based on the researches that were mentioned in the previous chapter of this thesis “Theoretical framework and hypotheses development”, eleven different values that might be important to women were picked out. These values are: quality, comfort, fit, fashion, natural fabrics, smiling and friendly staff, famous brands, visually good looks, clothing style, personal assistance and a possibility to wear for a number of seasons. The respondents are asked to identify how important every value is to them from one to seven, where one is “not important at all” and seven is “extremely important”.
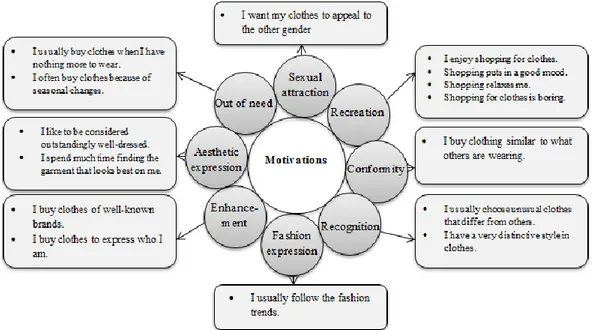
The third part of the questionnaire contains two questions as well. The first question of the third part was designed to measure shopping motivations of every respondent. Based on the theory that was collected and further summarized in the previous chapter of this thesis, eight different shopping motivations were established. These motivations are: recreation motivation, conformity motivation, sexual attraction motivation, recognition motivation, aesthetic expression
motivation, enhancement motivation, fashion expression motivation and out of need motivation. Furthermore, in order to measure these shopping motivations fifteen different statements were developed and respondents had to indicate the level of their agreement or disagreement with each of the statements. Six of these statements were adopted from the previous study of Chen-Yu and Seock (2002) and the other nine statements were developed by the author. Illustration 3.1 shows all fifteen questions and what kind of motivation they measure
18
And finally, the second question in the third part was developed to determine which store selection criteria are important for women when choosing a store. This question includes fifteen different store features, summed up from the previous studies that were mentioned in the second chapter of this thesis. Every responded was asked to indicate the importance of each store feature, from one to seven, where one was “not important at all” and seven was “extremely important”. In order to structure all the features we place them four different categories,
developed by the author of this thesis: physical features, content features, intangible features and financial features. Questionnaire suggested four physical features of the store: store layout, attractive window display, visual image of the store and store’s location. Six features of the store’s content: variety of brands, variety of styles, vintage variety, one particular brand, product quality and wide variety of different products. Store intangible features: expertise of the
salesmen, local ownership, store reputation and being recognized or known in the store. And, finally, financial features: low prices, frequent sales and excellent return policies.
In general the process of filling in the questionnaire takes from five to ten minutes. That is why questionnaire were collected, mostly in the library, since there people could sit and take their time to answer all the questions properly
3.2 Limitations and criticism
The sample of the conducted research is one of the limitations of the study. Since the women who have been questioned during the research live in Sweden, the results of the research represent consumer behavior of Swedish females, which means that the results of the same research in another country may vary.
One of the disadvantages of the questionnaire that Bryman and Bell (2007) underline is the fact that the researcher and the respondents might have different understanding of the key terms used in the questionnaire furthermore it means that the respondents might interpret the questions in their own different ways. Moreover, since the thesis is written in English the questionnaire was also developed in English, but after further considerations, it was decided to translate
questionnaire into Swedish, because Swedish women are going to answer it and foreign language could suggest some language barrier or misunderstanding of the key terms for respondents, especially for the older ones. Though, translation overcomes the problem of language barrier for respondents, it might cause some loose of meaning when translating the answers back into English for further analysis.
In order to facilitate the answering process for the respondents the questionnaire contains closed questions, which, according to Bryman and Bell (2007), create a loss of spontaneous answers. To overcome this problem, to some degree, in the very beginning of the questionnaire one open question is asked.
Questionnaires should not contain many questions, because when too many questions are asked, respondents are most likely to get bored and speed up the process, which reflects negatively on the quality of the research. If the questionnaire is to long respondents might even refuse to answer or finish answering the survey. As the result some of the detailed questions had to be cut out.
19
When analyzing the data, researcher assumes that respondents gave honest answers which sometimes might not be the case. Bryman and Bell (2007) affirm that some respondents might answer from the perspective of the social standards or desirability. Furthermore when answering the survey respondents might not remember some details that are important for the study.
Usually it is the case that a questionnaire cannot reflect all the complexity of the investigated issue. Some would suggest the qualitative approach for the research but then it would not be possible to make any kinds of generalizations. Moreover qualitative approach would take an extreme amount of time to make a qualitative interview with every member of the sample.
20
4. STUDY RESULTS
Empirical results of the research consist of 59 surveys that were collected in April, 2011. All the respondents were selected randomly in the street and library. Afterwards all the results were coded, structured and analyzed in order to test the suggested hypothesis and draw conclusions. Bryman and Bell (2007) claim that cross-sectional design suggests that we cannot simply manipulate the variables. At the individual level of analysis, age, ethnicity, gender and social backgrounds are “givens”. So the fact that certain variables are regarded as “givens” gives us a possibility to make causal inferences in cross-sectional research. This means, that if we find a relationship between age and consumer motivations, we could suggest that “age variable” is more likely to be the independent variable.
During the data collection it was noticed that younger women were more eager to participate. Nevertheless the minimum amount of ten people in every age group were asked, which gives us a possibility to draw some conclusions for each age group.
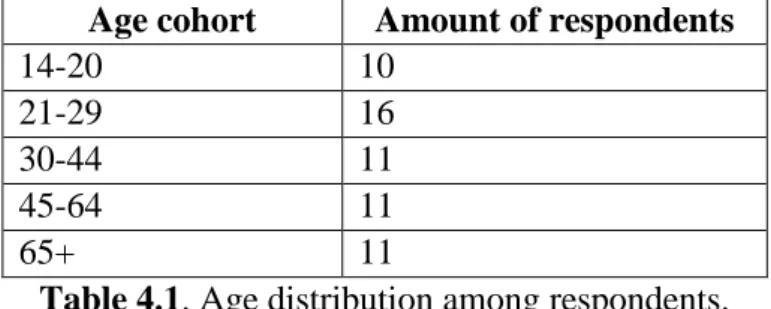
Table 4.1 presents the age distribution among the respondents. Five age categories were used to simplify the analysis of the research. Moreover, the author believes that it also simplifies the choice for women, who might feel uncomfortable when asked about their age.
Age cohort Amount of respondents
14-20 10
21-29 16
30-44 11
45-64 11
65+ 11
Table 4.1. Age distribution among respondents.
After examining the answers of all the respondents it was decided that the answers of two women, of age 30-44 and 65+ will not be taken into consideration since they didn’t answer 36% and 68% of all the questions, respectively. Furthermore, some of their answers were
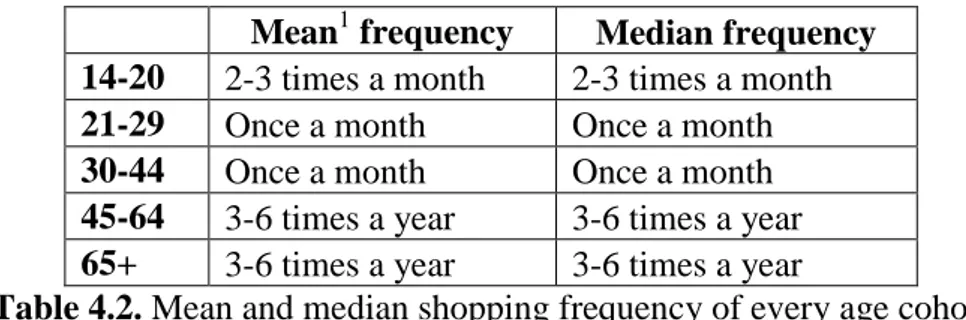
contradictory. It is possible that the non-response was based on disinterest in shopping, both women answered that they shop 1-2 times a year or less; or lack of time on their side. Table 4.2 presents mean and median shopping frequencies of the respondents. Mean simply shows an average value, while median presents the middle value in a sample sorted into
ascending order (Korner, Wahlgren, 1998). The reason for taking into consideration both mean and median is to see whether the mean value is really a typical value for the whole group or, in our case, age cohort.
All respondents were presented with five alternatives of shopping frequencies, from “once a week or more often” to “once or twice a year or less”. In order to find the mean and median frequencies for each age cohort, all the answer-alternatives were coded from one to five respectively. Since the mean value for every age cohort wasn’t an integer, every answer was
21
rounded up to the closest integer. Afterwards, these integers were translated back into their word-meaning and summed up in a table 4.2. To check the numerical values see table 4.2 in annex 3.
Mean1 frequency Median frequency 14-20 2-3 times a month 2-3 times a month 21-29 Once a month Once a month 30-44 Once a month Once a month 45-64 3-6 times a year 3-6 times a year 65+ 3-6 times a year 3-6 times a year
Table 4.2. Mean and median shopping frequency of every age cohort
The fact that mean and median frequencies are the same is very good. It means that there was not a person in every age cohort, who shopped significantly different from others, which could negatively influence the reliability and interpretation of the mean value.
In table 4.3 the results of mean and median expenditure level of each age cohort are given. The values of mean and median expenditure level were found with the help of the same method that was used to find the mean and median frequencies for each age cohort, table 4.2. First the responses were coded, then calculated and, then translated back into their original meaning. For more details check table 4.3 in annex 3.
Age Mean expenditure Median expenditure 14-20 501-1000 kr 501-1000 kr
21-29 201-500 kr 201-500 kr 30-44 501-1000 kr 501-1000 kr 45-64 201-500 kr 201-500 kr
65+ 201-500 kr 201-500 kr
Table 4.3. Mean and median expenditure levels
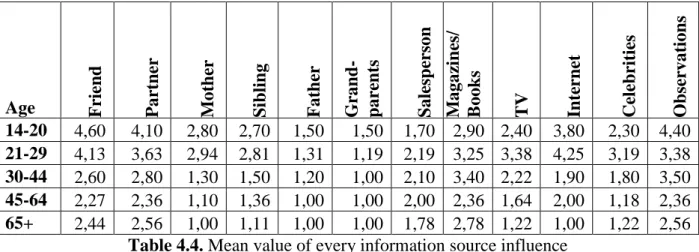
In the questionnaire (see annex 1) every respondent was asked to measure the level of influence of different information sources on their purchase decision. They had to peak a level from one to seven, were one was “not influenced” and seven was “strongly influenced”. They were also given an answer alternative “irrelevant”. One could answer “irrelevant”, when, for instance, one didn’t have a sibling, but had to measure his or her influence on their decision. Afterwards all the irrelevant answers were counted as one, since “irrelevant” also means no influence at all. Table 4.4 presents mean values of respondents’ answers to this question.
In total, there were suggested twelve different information sources, including both personal and impersonal. Personal source of information suggests interaction between two or more people, while impersonal sources are the sources without a direct contact with another human being. The mean values for every information source are presented in the table below.
1 The mean value of each element was calculated with the help of the following formula
N x Mean N i i
1 , where N- isa total number of respondents and
N i i x 1
22 Age Friend Par
tner M ot h er S ib li n g Fat h er Grand - p ar en ts S alesp er son M agaz in es/ B ook s TV In te rn et Ce lebrit ies Ob se rvation s 14-20 4,60 4,10 2,80 2,70 1,50 1,50 1,70 2,90 2,40 3,80 2,30 4,40 21-29 4,13 3,63 2,94 2,81 1,31 1,19 2,19 3,25 3,38 4,25 3,19 3,38 30-44 2,60 2,80 1,30 1,50 1,20 1,00 2,10 3,40 2,22 1,90 1,80 3,50 45-64 2,27 2,36 1,10 1,36 1,00 1,00 2,00 2,36 1,64 2,00 1,18 2,36 65+ 2,44 2,56 1,00 1,11 1,00 1,00 1,78 2,78 1,22 1,00 1,22 2,56
Table 4.4. Mean value of every information source influence
Furthermore, diagram 4.1 and 4.2 present a visual picture of influence of both personal and impersonal sources of information, respectively, that were examined in this thesis. Every column presents the average influence of personal and impersonal information sources in every age group.
Diagram 4.1. Influence of personal information sources
Diagram 4.2. Influence of impersonal information sources
The second question of the second part of the questionnaire was developed to measure customer values. Meaning, what customers value when they buy a certain garment. Eleven different values were adopted from the theory. These values are: quality, comfort, fit, fashion, natural fabrics, smiling and friendly staff, famous brands, visually good looks, clothing style, personal assistance and a possibility to wear for a number of seasons. Every respondent was asked to measure
value’s importance from one to seven, where one was “not important at all” and seven was “extremely important”. The answers of every age cohort were checked for outliers. Outlier is an unusually small or an unusually large value in a data set (Korner and Wahlgren, 1998). It is important to check for outliers since it can influence the result significantly, without being a typical or natural value in the line of observations. To determine the outliers z-method2 was used. And then if |z|>3, we could say that a particular value was an outlier.
2 A data value with a z-score less than -3 or greater than 3 might be considered an outlier. Z-score was calculated
with the help of the following formula
N i i N i i i x x N x x z 1 2 1 ) ( 1 ) (, where N- number of observations.
0 1 2 3 14-20 21-29 30-44 45-64 65+
Personal information
sources
0 1 2 3 4 14-20 21-29 30-44 45-64 65+Impersonal
information sources
23
After no outliers were found, the mean for every element in every age cohort was calculated. Table 4.5 presents mean results of customer value’s importance in different age cohorts.
A ge Q ual it y C om fo rt
Fit Fashion Fab
ri cs Staf f B rands L ooks Styl e A ss is tanc e D urabil it y 14-20 5,70 5,20 6,67 3,50 3,20 4,70 2,90 5,90 5,30 3,89 5,60 21-29 4,63 5,56 6,31 4,30 3,13 4,25 2,94 5,60 4,60 3,38 4,93 30-44 5,70 5,90 6,78 3,50 4,10 4,00 2,40 5,70 6,10 3,80 4,60 45-64 5,55 6,45 6,40 2,90 5,73 5,45 1,73 5,60 5,20 5,00 6,00 65+ 5,70 6,20 6,40 3,00 5,10 4,11 2,00 5,40 5,50 3,56 6,11 Mean 5,45 5,86 6,51 3,40 4,25 4,50 2,39 5,60 5,03 3,92 5,45
Table 4.5. Importance of different values (range from one to seven)
One of the aims of the research was to examine and analyze shopping motivations of women at different age. Eight different shopping motivations were identified based on the previous
researches, which were highlighted and analyzed in the second chapter of this thesis “Theoretical framework and hypotheses development”. These motivations are: recreation motivation,
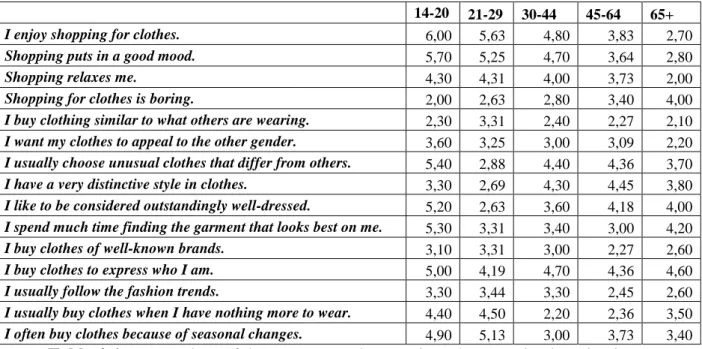
conformity motivation, sexual attraction motivation, recognition motivation, aesthetic expression motivation, enhancement motivation, fashion expression motivation and out of need motivation. To measure these motivations fifteen different questions were developed (see illustration 3.1). In the table 4.6 the mean values of all respondent’s answers are given.
14-20 21-29 30-44 45-64 65+
I enjoy shopping for clothes. 6,00 5,63 4,80 3,83 2,70
Shopping puts in a good mood. 5,70 5,25 4,70 3,64 2,80
Shopping relaxes me. 4,30 4,31 4,00 3,73 2,00
Shopping for clothes is boring. 2,00 2,63 2,80 3,40 4,00
I buy clothing similar to what others are wearing. 2,30 3,31 2,40 2,27 2,10
I want my clothes to appeal to the other gender. 3,60 3,25 3,00 3,09 2,20
I usually choose unusual clothes that differ from others. 5,40 2,88 4,40 4,36 3,70
I have a very distinctive style in clothes. 3,30 2,69 4,30 4,45 3,80
I like to be considered outstandingly well-dressed. 5,20 2,63 3,60 4,18 4,00
I spend much time finding the garment that looks best on me. 5,30 3,31 3,40 3,00 4,20
I buy clothes of well-known brands. 3,10 3,31 3,00 2,27 2,60
I buy clothes to express who I am. 5,00 4,19 4,70 4,36 4,60
I usually follow the fashion trends. 3,30 3,44 3,30 2,45 2,60
I usually buy clothes when I have nothing more to wear. 4,40 4,50 2,20 2,36 3,50
I often buy clothes because of seasonal changes. 4,90 5,13 3,00 3,73 3,40
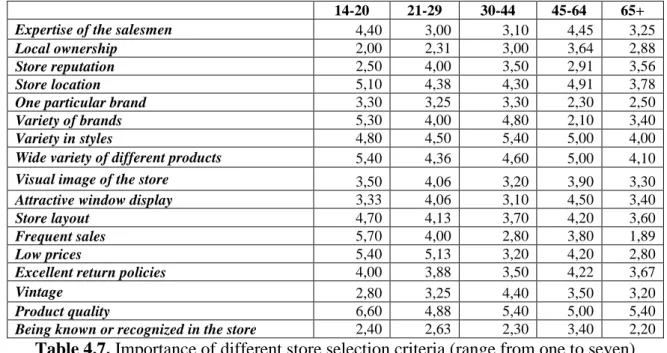
Table 4.6. Mean values of the answers on the questions that examined motivations. In table 4.7 one can see the results of the investigation of the importance of different store selection criteria, which were considered in this thesis. Table 4.7 presents mean values of every criterion at different age.
24
14-20 21-29 30-44 45-64 65+
Expertise of the salesmen 4,40 3,00 3,10 4,45 3,25
Local ownership 2,00 2,31 3,00 3,64 2,88
Store reputation 2,50 4,00 3,50 2,91 3,56
Store location 5,10 4,38 4,30 4,91 3,78
One particular brand 3,30 3,25 3,30 2,30 2,50
Variety of brands 5,30 4,00 4,80 2,10 3,40
Variety in styles 4,80 4,50 5,40 5,00 4,00
Wide variety of different products 5,40 4,36 4,60 5,00 4,10
Visual image of the store 3,50 4,06 3,20 3,90 3,30
Attractive window display 3,33 4,06 3,10 4,50 3,40
Store layout 4,70 4,13 3,70 4,20 3,60
Frequent sales 5,70 4,00 2,80 3,80 1,89
Low prices 5,40 5,13 3,20 4,20 2,80
Excellent return policies 4,00 3,88 3,50 4,22 3,67
Vintage 2,80 3,25 4,40 3,50 3,20
Product quality 6,60 4,88 5,40 5,00 5,40
Being known or recognized in the store 2,40 2,63 2,30 3,40 2,20
25
5. ANALYSIS OF THE RESEARCH RESULTS AND DISCUSSION
5.1 Analysis of the hypothesis 1The first hypothesis: “Women’s consumer behavior varies with age” is a very general
hypothesis. Thus, to confirm or disconfirm hypothesis 1 it will be enough to have a look at the survey results described in the previous chapter of the thesis. As we can see all the results varies significantly depending on the age cohort they belong to. Of course, some results differ
dramatically while others might differ just slightly; nevertheless, the results do differ, which means that hypothesis 1 “Women’s consumer behavior varies with age” is confirmed.
5.2 Analysis of the hypothesis 2, hypothesis 3 and hypothesis 4
In the previous chapters three hypothesis concerning shopping motivations were suggested. Hypothesis 2 suggests that “sexual attraction motivation decreases with age”. Hypothesis 3 suggests that “conformity motivation decreases with age”. And, finally, Hypothesis 4 suggests that “fashion expression motivation decreases with age”.
To accept or reject hypothesis 2, hypothesis 3 or hypothesis 4 collected answers were analyzed the answers that were collected with the help of the questionnaire (annex 1). In order to find any kind of relationship between these three shopping motivations and age, the regression analysis was performed.
Since regression analysis does not process non-numerical values, age groups were coded. One is an age group from 14 to 20, two is an age group from 20 to 29, three is an age group from 30 to 44, four is an age group from 45 to 64 and five stands for an age group over 65. The influence of every motivation was measured from one to seven, where one was “not influenced at all” and seven was “strongly influenced”. In order to confirm hypotheses two, three and four the
influence of conformity motivation, sexual attraction motivation and fashion motivation have to be negatively related to age. Negative relation between these variables means that the influence of sexual attraction, conformity and fashion motivations decreases with age. In other words, the older women are the less important these motivations are for them.
First the relation between sexual attraction motivation and age were analyzed. Age is an independent variable while respondent’s evaluation of sexual attraction motivation is a dependent variable.
Table 5.2.1 illustrates the results of the regression analysis for sexual attraction motivation.
Coefficients
Standard
Error t Stat P-value
Lower 95% Upper 95% Lower 95,0% Upper 95,0% Intercept 3,892657 0,531539 7,323372 1,11E-09 2,827429 4,957885 2,827429 4,957885 Coded age -0,28844 0,165214 -1,74587 0,086417 -0,61954 0,042653 -0,61954 0,042653
Table 5.2.1. Regression analysis of age and sexual attraction motivation (Sexual attraction is a dependent variable)
26
The first thing we will check in this table is the P-value. P-value tells us whether our results are significant enough to draw any conclusions. In this case P-value equals 0,086417, since it is smaller than 0.1, we can say that the result is significant at the 90% significance level.
If we look closer at the results, in the column “coefficients”, we can see that the slope angle of our imaginary line, which reflects the relation between age and sexual attraction motivation, is negative and equals -0.28844. Negative slope means that the relation between sexual attraction motivation and age is negative. The younger the person is the more important sexual attraction is for her. This finding goes in line with hypothesis 2 and it means that hypothesis 2 “sexual
attraction motivation decreases with age” has been confirmed.
Next we analyze hypothesis 3 and hypothesis 4 “conformity motivation decreases with age” and “fashion expression motivation decreases with age”. To check these hypotheses the regression analysis will be used. In order to confirm that conformity motivation and fashion expression motivation fade as aging we will have to find a negative relation between these two variables; if otherwise, hypothesis 3 and hypothesis 4 will be rejected.
After conducting the regression analysis for these two sets of variables in order to check our hypothesis 3 and hypothesis 4, no significant results were found (see annex 4, table 5.2.2 and table 5.2.3). It means that there is no positive relation between age and conformity motivation as well as age and fashion expression motivation. Consequently hypothesis 3 and hypothesis 4 are being rejected.
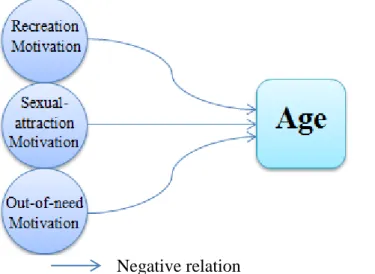
5.2.1 Analysis of motivations
Furthermore, the regression analysis was conducted for each motivation that was investigated in this thesis. For numerical results of this regression analysis check annex 4. Illustration 5.2.1 illustrates the received results.
Negative relation
Illustration 5.2.1. Negative relation between motivations and age
It was found that three motivations: recreation motivation, sexual-attraction motivation and out-of-need motivation fade throughout life. It means that the older a woman gets the less important these motivations are for her. Going in line with these findings we have also establish that the older a women gets the more boring the process of shopping for clothes gets for her (annex 4,
27
table 5.2.5). From table 5.2.2, we can actually see that older women have quite low motivations, in general. The most important motivation to shop for clothes for women over 65 is aesthetic expression motivation and recognition motivation while the least important is conformity
motivation, which means that they don’t feel any pressure from their peers. So we could suggest that older women often buy clothes for themselves, for their self-expression, and aesthetic
expression, overall. It could explain our next finding of regression analysis (annex 4, table 5.2.6), that the older women get the more distinctive style they have. It also goes in line with Birtwistle and Tsim (2005) statement, that for mature women garments are the expression of their
personality.
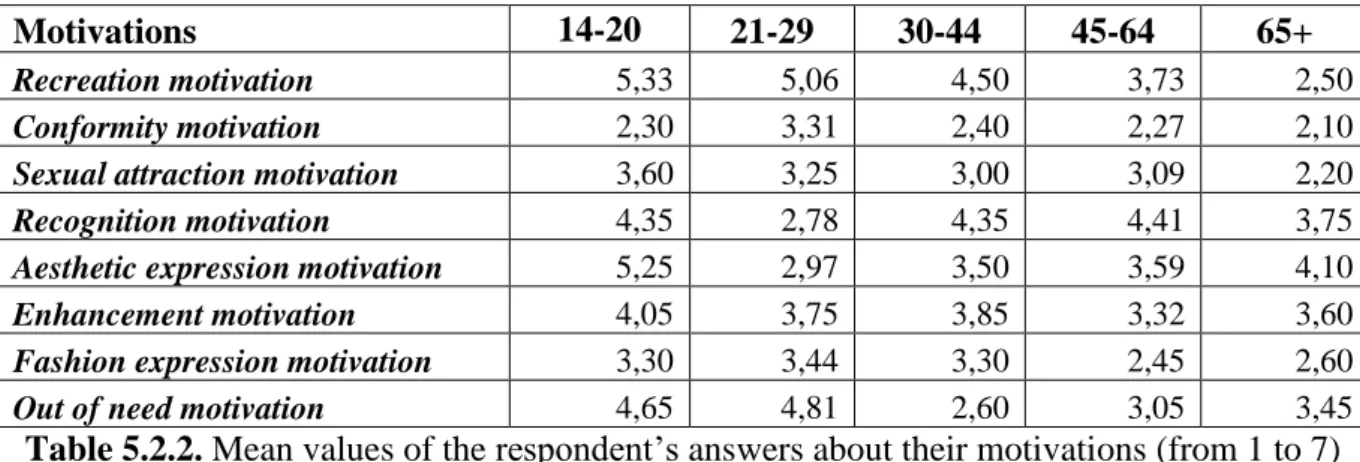
It also might be interesting to have a look at the table 5.2.2 which presents mean values of different motivations that influence women.
Motivations 14-20 21-29 30-44 45-64 65+
Recreation motivation 5,33 5,06 4,50 3,73 2,50
Conformity motivation 2,30 3,31 2,40 2,27 2,10
Sexual attraction motivation 3,60 3,25 3,00 3,09 2,20
Recognition motivation 4,35 2,78 4,35 4,41 3,75
Aesthetic expression motivation 5,25 2,97 3,50 3,59 4,10
Enhancement motivation 4,05 3,75 3,85 3,32 3,60
Fashion expression motivation 3,30 3,44 3,30 2,45 2,60
Out of need motivation 4,65 4,81 2,60 3,05 3,45
Table 5.2.2. Mean values of the respondent’s answers about their motivations (from 1 to 7) From this table we can see that conformity motivation and fashion expression motivation reach their top values at 21-29 years old, and afterwards they start to decrease. Nonetheless,
conformity motivation has proven to be rather unimportant for all women if we compare it to the other motivations.
Based on the table 5.2.2 we can also see that for women between ages of 45 and 64, recognition motivation is the most important while the conformity motivation has shown to be the least important. The fact that recognition motivation and conformity motivation are the highest and the lowest motivations, agrees with each other. Since recognition motivation means being different and distinctive from others; while conformity means the need or desire to fit into a certain frame.
For women from 14 to 44 years old recreation motivation is the highest one, which means that they enjoy shopping and see it as an entertainment. The least important motivation for women from 14 to 20 and from 30 to 44 is conformity. While for the age cohort from 20 to 29,
recognition motivation has the lowest scores.
The finding that recreation is the most important motivation for adolescents goes in line with previous findings of Chen-Yu and Seock (2002). On the other hand, sexual attraction has shown to be not that important as in Chen-Yu and Seock (2002) findings. It could be either because of cultural differences or just because this trend has changed for the past nine years.
28
5.3 Analysis of the hypothesis 5, hypothesis 6 and hypothesis 7
Hypothesis 5: “The importance of comfort increases with age” Hypothesis 6: “The importance of quality increases with age”
Hypothesis 7: “The importance of knowledgeable staff increases with age”
Let us first identify how important quality, comfort and knowledgeable staff are for women at different age. In the previous chapter mean values of comfort and quality importance were given in the table 4.5 and the mean value for the knowledgeable staff was given in table 4.7. The importance of every value was measured from one to seven, where one is “not important at all” and seven is “extremely important”. By looking at the mean values of comfort, quality and knowledgeable staff importance, we can see that comfort is more important than quality and quality is more important than knowledgeable staff. Nonetheless, overall, the most important value for women is fit and then it is comfort, looks, quality and durability. On the other had the least important values among investigated one are brands and fashion. It means that women choose clothes mostly based on their fit, comfort and looks while fashion and brand names are not very important for them when making a decision to buy a certain garment. Illustration 5.3.1 values in order of decreasing importance.
Illustration 5.3.1. Values and their importance
Now, to analyze the relationship between age and importance of values, mentioned in the hypothesis 3, hypothesis 4 and hypothesis 5, regression analysis was conducted. Regression analysis was performed in Excel. Age was coded, exactly as in previous regression analysis. First the relation between age and comfort was examined. In order to confirm hypothesis 5, we need to find positive relation between age and comfort, if otherwise the hypothesis will be rejected. For numerical results of the analysis, see table 5.3.1, below.
Coefficients
Standard
Error t Stat P-value
Lower 95% Upper 95% Lower 95,0% Upper 95,0% Intercept 4,989134 0,441638 11,2969 5,91E-16 4,104072 5,874196 4,104072 5,874196 Age coded 0,292888 0,137271 2,133652 0,037347 0,017791 0,567984 0,017791 0,567984
Table 5.3.1. Regression analysis of age and importance of comfort (Comfort is a dependable variable)
After looking at the results of the analysis we can confirm that hypothesis 5 is true. Positive relation between age and comfort importance was found.
On the other hand, after conducting regression analysis of hypothesis 6 and hypothesis 7, these hypotheses were rejected (annex 4, table 5.3.2 and 5.3.3). No significant results were found,