Concentrations of
Uranium,Thorium and Potassium
in Sweden
SSI Rapport
2005:04
Rapport från Statens strålskyddsinstitut tillgänglig i sin helhet via www.ssi.se
���������������������������������������� ���������������������������������������������������������������������������������� ����������������������������������������������������������������������������������������� ������������������������������������������������� ��������� ���������������������������������������������������������������������������������������� �������������������������������������������������������������������������������� ����� ������������������������������������������������������������������������������������� ������������������������������������������������������������������������������������� ������������������ ����������� �������������������������������������������������������������������������������������� ������������������������������������������������������������������������������������� ��������������������������������������������������������������� ���������������������������������� ��������������������������������������������������������������������������������������� ������������������������������������������������������������������������������������������� ��������������������������������������������������������������������������������������� ������������� ����������������������������������������������������������������������������������������� ������������������������������������������������������������������������������������ ����������������������������������� ����� �������������������������������������������������������������������������������������������� ����������������������������������� ���������������� ����������������������������������������������������������������������������������� �������������������������������������������������������������������������� ��������� ���������������������������������������������������������������������������������� ���������������������������������������������������������������������������������������� ������������������� ����������� ������������������������������������������������������������������������������������������ ������������������������������������������������������������������������������������������� ��������������������������������������������������������������������������������������� ������� ����������������������������������������������������������������������������������������� ����������������������������������������������������������������������� ���������������� �������������������������������������������������������������������������������������������������� �������������������������������������������������������������������������������������� ���������������������� ����������������������������������������������������������������������������������������� �������������������������������� ���������������������� �������������������������������������������������������������������������������������� ��������������������������������������������������������������������������������������� ���������� ��������������
����������������������
SSI rapport: 2005:04 april 2005
ISSN 0282-4434 AUTHOR/ FÖRFATTARE: Bo Thunholm1, Anders H. Lindén1 och Bosse Gustafsson1.
1. SGU
DEPARTMENT/ AVDELNING: Department of Waste Management and Environmental Protection/ Avdelning för Avfall och miljö.
TITLE/ TITEL: Concentrations of Uranium,Thorium and Potassium in Sweden/ Koncentrationer av uran, torium och kalium i Sverige.
SUMMARY: This report is largely a result of the Swed-ish contribution to an IAEA co-ordinated research programme (CRP) on the use of selected safety indi-cators in the assessment of radioactive waste disposal. The CRP was focusing on the assessment of the longterm safety of radioactive waste disposal by means of additional safety indicators based on data from natural systems with emphasis on description of existing data on radioactive elements and radionuclides. A major part of the work was focused on collecting data on geophysics as well as geoche-mistry and groundwater chegeoche-mistry; mainly uranium (U), thorium (Th) and potas-sium (K). Data were interpreted resulting in maps and statistical description. SAMMANFATTNING: Den här rapporten återger det svenska bidraget till IAEA:s koordinerade forskningsprogram om användningen av säkerhetsindikatorer vid utvärdering av förvar för radioaktivt avfall. Forskningsprogrammet fokuserade på utvärdering av långtidssäkerhet. Säkerhetsindikatorer baserade på data från naturliga system studerades. Tyngdpunkten låg på att beskriva existerande data för radioaktiva ämnen och radionuklider. Huvuddelen av arbetet fokuserade på att samla in geofysik, geokemi och grundvat-tenkemi data för U, Th och K. Data presenteras i rapporten i form av kartor och tabeller.
Författarna sva rar själ va för innehållet i rapporten.
The con clu sions and view points pre sen ted in the rep ort are those of the aut hors and do not ne ces sa ri ly coin ci de with tho se of the SSI.
i
Contents
Introduction... 3
Safety indicators... 3
What has been done ... 3
Objective ... 3
Concentrations – Overview ... 3
Sources of data... 4
Results ... 5
Study sites in the Uranium Archive... 13
Masugnsbyn ... 15 Pleutajokk... 15 Kvarnån... 16 Björkråmyran... 16 Lilljuthatten... 17 Sågtjärn... 17 Ranstad... 18 Västervik... 18
Interpretation and application of data... 19
Conclusions... 20
References... 21
3
Introduction
Safety indicators
A safety indicator has been defined as “a calculable, time-dependent quantity, integrated over all nuclides, which allows a statement on the safety of the total repository system by comparison with suitable, safety-related reference values” (Becker et al., 2002). The most commonly used safety indicators in this context are dose and risk. Within the IAEA a co-ordinated research programme (CRP on the use of selected safety indicators in the as-assessment of radioactive waste disposal) was started in the year 2000. The main idea was to test the use of concentrations and fluxes of radionuclides as safety indicators comple-mentary to dose and risk. Such safety indicators can be used for qualitative evaluation of safety rather than for quantitative definition of safety limits.
What has been done
Estimates of natural concentrations of radioactive elements and radionuclides have been presented in various reports such as the UNSCEAR (2000). The possibility to use concen-trations and fluxes as safety indicators complementary to dose and risk has been dis-cussed in a number of papers over the last 10 years, e.g. Wingefors et al. (1999), “Nordic Flag Book” (2000) and Miller et al. (2002). In relation to these reports a Co-ordinated Research Programme (CRP) within IAEA started where different countries, including Sweden, presented data on natural concentrations on radioactive elements and radionu-clides. This programme was finalised in the beginning of 2003 and the present report is largely based on the outcome of the CRP (IAEA, 2004). Within the EC SPIN project (Testing of Safety and Performance Indicators) various safety indicators have been evalu-ated (Becker et al., 2002).
Objective
The objective was to compile data of natural abundances of radioactive elements and radionuclides in Sweden, and to obtain ranges of concentrations and calculated radionu-clide fluxes with emphasis on uranium, thorium and potassium in the overburden, bed-rock and groundwater. In addition, data of Ra-226 and Rn-222 in groundwater are given. Most of the natural radioactivity is caused by radionucluides in the decay series starting with uranium-238, uranium-235, thorium-232 and potassium-40. Data of uranium, tho-rium and potassium are generally sufficiently abundant to be used for reference purposes. These data are supposed to contribute to the development of safety indicators by relating natural conditions to possible leakage from a radioactive waste repository. However, the approach for the development of such safety indicators is not included in this report.
Concentrations – Overview
Most of the data on concentration of elements are stored in databases at the Geological Survey of Sweden (SGU). All data are publicly available, although there is a policy to cover the cost for usage and distribution of data. Data from airborne measurements, petrophysical investigation and geochemical sampling are included in the regular
map-ping (e.g. Fredén, 1994), while most of the data on groundwater have been collected dur-ing certain investigations. If no reference is given the data source is the Geological Sur-vey of Sweden.
Element concentrations are given in ppm or ppb for soil and bedrock and mg/L for groundwater whereas concentrations of radionuclides are given in Bq/kg or Bq/L.
Sources of data
When evaluating the presented data the difference in methods for sample preparation and analysis should be considered. A common method for geochemical analysis is Induc-tively-Coupled Plasma-Mass Spectroscopy (ICP-MS). X-Ray Fluorescence (XRF) has also been used but with a lower degree of accuracy. The quality of bulk analysis (made by XRF) is considered to be good for potassium while not quite satisfactory for uranium and thorium. For those elements, the analysis made by ICP-MS after acid extraction is far better but does not provide the total content.
For the airborne measurements gamma spectrometry has been used. This method has also been used for on-site measurements of outcrops and for petrochemical measurements on bedrock samples. When using gamma spectrometry the estimated content of uranium is based on measurements of Bi-214 that is assumed to be in a state of equilibrium with both Ra-226 and U-238. This assumption is somewhat uncertain, especially for the overburden due to the possible leakage of Rn-222. The estimated content of uranium when using this approach is denominated equivalent uranium (eU).
Airborne gamma-ray spectrometric measurements of equivalent uranium (eU), thorium and potassium have been made since the late 1940’s. Digital data with spectral resolution are available from 1968. About 80 % of Sweden is covered with a spatial resolution of 200 x 40 m2. However, the resolution has been improved and the present value is 200 x 16 m2. Data from a total number of more than 40 million points are available in digital
format.
Petrophysical data are based on in-situ gamma-ray spectrometric measurements from about 6000 outcrops with a total of about 20 000 observations. Measurements have been made for equivalent uranium (eU), thorium and potassium and other elements.
Petrochemical sampling and analyses have been made in connection with the regular mapping of the bedrock that is made by the Geological Survey of Sweden. A total amount of about 8000 observations is available, while the amount of data on equivalent uranium (eU) and thorium is limited to about 300 observations.
Geochemical analysis of uranium and other elements in glacial till has been made since 1982. Sampling is made with 1 sample per about 7 km2. During the period 1987-1997 a
low-density sampling of one sample per 40 km2 was used. Sampling depth is about 1 m below the ground surface i.e. well below the zone which are influenced by anthropogenic activity and climatic conditions. Data before 1995 have a detection limit of 5 ppm, which should be taken into account. After 1995 the detection limit has been 0.1 ppm. A total amount of 26 000 observations are available. High-density data covers about 40 % of Sweden, whereas the low-density data covers about 50 %.
5
Groundwater data with emphasis on countrywide reference values can be divided into four groups:
1. One study was made in 1981 where 42 samples were collected in various types of groundwater bodies in different parts of Sweden (Aastrup, 1981). The objective was to find average values of uranium, radium and radon.
2. A second group of data is currently being processed within a research project at SGU. This study is focused on uranium, thorium and other elements in groundwater with emphasis on the crystalline bedrock (Ek, 2003).
3. Another group of data consists of about 2000 analyses of radon (Geological Survey of Sweden). The sampling process for this group of data is focused on a spatial distribu-tion without any bias. Thus the data are fairly evenly distributed over Sweden and could be regarded as randomly chosen. This group of data has been collected within the coun-trywide mapping of groundwater with some additional data from various investigations. 4. A fourth group of data consists of analyses of radon and radium in groundwater, accounting for 499 samples (Kulich, 1988, Swedjemark, 1993). Within this group a total amount of 54 wells were selected for analyses of uranium (Östergren, et al., 2003).
Results
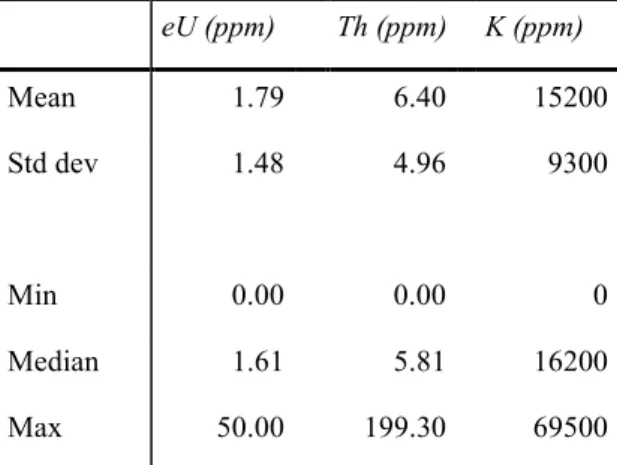
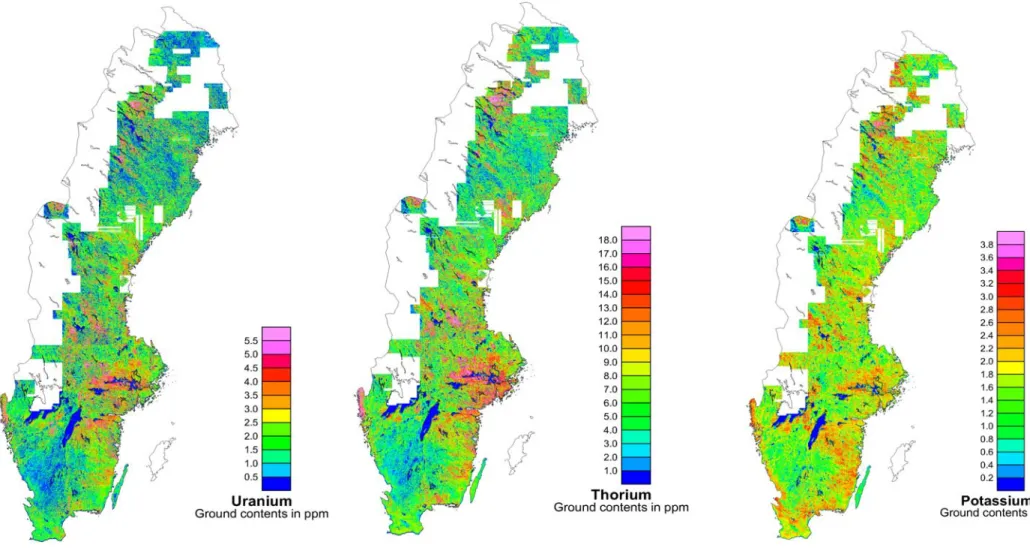
Airborne gamma-spectrometric measurements of equivalent uranium, thorium and potas-sium show variations in concentrations with fairly high values in some areas of Sweden (Table 1, Figure 1). The data represents mainly the upper part of the overburden with minor influence of outcrops. The overburden in Sweden, for the main part, consists of till made up of the local bedrock, and thus the concentrations of elements in the overburden are representative for the concentrations in the underlying bedrock.
The petrophysical measurement values should be fairly representative for the Swedish Precambrian bedrock (Table 2). The values are somewhat higher than the corresponding airborne data that represents mainly the upper part of the overburden. This is natural as the data from the airborne measurements represent average readings from measurements over till, clay, silt, sand, gravel, bare rocks, bogs, march and other wetlands (measure-ments over lakes and the sea are not included).
Another source of data, a database on petrochemistry (i.e. chemical analyses of the bed-rock) gives similar results as the petrophysical database for the minimum, median and maximum values (Table 3). This database has about 300 observations for uranium and thorium whereas about 5000 observations are included for potassium. The mean value and standard deviation are fairly high owing to a few samples with extremely high values.
Table 1. Statistical data for airborne gamma-ray spectrometric measurements of uranium
(eU), thorium (Th) and potassium (K). Media: Overburden (mainly till), bedrock wetlands (data from Geological Survey of Sweden).
eU (ppm) Th (ppm) K (ppm) Mean 1.79 6.40 15200 Std dev 1.48 4.96 9300 Min 0.00 0.00 0 Median 1.61 5.81 16200 Max 50.00 199.30 69500
Table 2. Statistical data for gamma-ray spectrometric measurements on outcrops .
Concen-trations of uranium (eU), thorium (Th) and potassium (K). Media: Bedrock (data from Geo-logical Survey of Sweden).
eU (ppm) Th (ppm) K (ppm) Mean 5.06 16.10 32200 Std dev 9.03 21.43 13400 Min 0.00 0.00 0 Median 3.56 11.82 33000 Max 460.40 596.41 79000
Table 3. Statistical data for petrochemical measurements on rock samples. Concentrations of
ura-nium (eU), thorium (Th) and potassium (K). Media: Bedrock (data from Geological Survey of Swe-den). eU (ppm) Th (ppm) K(ppm) Mean 129.6 24.1 27000 Std dev 1384.9 215.0 19000 Min 0.0 0.0 0 Median 2.0 6.7 27000 Max 18807.0 3603.1 120000
7
Geochemical characterisation of the overburden (Table 4-8, Figure 2) shows different results depending on methods used. The analysis made by ICP-MS after acid extraction is better but does not provide values on the total content. However, there is a strong correla-tion between the values after extraccorrela-tion and the total content, which means that the total content may be estimated from the values of the extracted samples.
The data in Table 6 – 7 could be compared with airborne data (Table 1), which largely have the same origin as the geochemical data (i.e. data from the upper part of the over-burden).
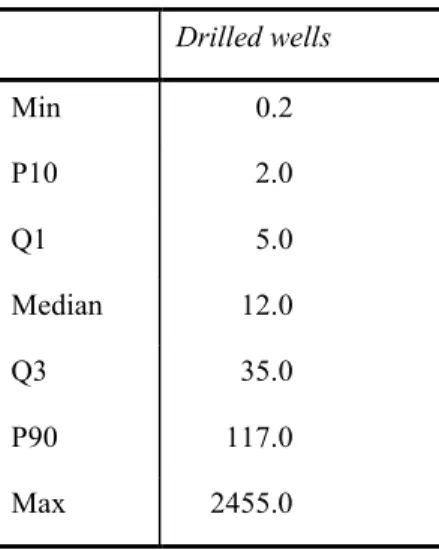
The first group of data with a countrywide investigation of uranium and radium in groundwater shows that uranium ranges from 0.1 to 43.5 mg/L and that the radium-226 activity ranges from 0.5 to 1900 mBq/L with generally higher values in the Precambrian bedrock (Table 8). The second group of data showed very low values for thorium (Table 9). The third group of data including 499 randomly chosen drilled wells shows a median value of 12.0 mBq/L for radium-226 (Table 10, Figure 3). Radon in groundwater (based on about 2500 samples) shows median values for different media in the range 20 - 85 Bq/L (Table 11, Figure 3).
Table 4. Comparison between methods for chemical analysis of uranium (U, ppm). Media:
Overburden, mainly till (data from Geological Survey of Sweden).
Percentile Total content (XRF) Acid extraction (ICP-MS)
0 <5 0.20 10 <5 0.89 20 <5 1.05 25 <5 1.11 30 <5 1.17 40 <5 1.30 50 <5 1.44 60 <5 1.62 70 <5 1.87 75 5 2.04 80 5 2.25 90 6 2.97 95 7 3.92 100 44 31.70
Table 5. Comparison between methods for chemical analysis of thorium (Th, ppm). Media:
Overbur-den, mainly till (data from Geological Survey of Sweden).
Percentile Total content (XRF) Acid extraction (ICP-MS)
0 <10 1.1 10 <10 4.3 20 <10 5.0 25 <10 5.4 30 <10 5.7 40 <10 6.3 50 <10 7.0 60 <10 7.7 70 11 8.5 75 12 9.0 80 12 9.6 90 16 11.8 95 19 14.0 100 57 49.4
Table 6. Bulk analysis on uranium (U), thorium (Th) and potassium (K )with XRF. Media:
Over-burden, mainly till. (data from Geological Survey of Sweden).
U (ppm) Th (ppm) K (ppm) Min <5 <10 3100 P10 <5 <10 19800 Q1 <5 <10 21800 Median <5 <10 24100 Q3 5 12 27200 P90 6 16 29000 Max 44 57 56200
9
Table 7. Concentrations after acid extraction for uranium (U) and thorium (Th) with ICP-MS. Media
Overburden, mainly till (data from Geological Survey of Sweden).
U (ppm) Th (ppm) Min 0.20 1.1 P10 0.89 4.3 Q1 1.11 5.4 Median 1.44 7.0 Q3 2.04 9.0 P90 2.97 11.8 Max 31.70 49.4
Table 8. Median values of uranium (U) and radium-226 (Ra-226) in different rock type aquifers. Based
on 42 samples. Media: Groundwater (Aastrup 1981).
Bedrock type Aquifer U (µg/L) Ra-226( mBq/L)
Sedimentary bedrock Quaternary de-posits
1.0 6.0
Bedrock 0.3 2.5
Precambrian bedrock Quaternary de-posits
0.6 3.5
Bedrock 2.3 97.0
Table 9. Concentrations of uranium (U) and thorium (Th) in groundwater. Drilled wells in
crystal-line bedrock Media: Groundwater in crystalcrystal-line bedrock. (data from Ek, 2003.)
U (µg/L) Th (µg/L) Min 0.10 0.01 P10 0.48 0.01 Q1 1.72 0.02 Median 7.23 0.04 Q3 21.05 0.12 P90 40.50 0.28 Max 141.94 1.14
The group of 54 wells (group 4, selected from 499 wells) showed a median value of 2.6 mg/L for uranium (Östergren, et al., 2003). Another investigation of uranium in ground-water in 269 drilled wells in Uppsala municipality (Lewin and Simeonidis, 1998) showed a median of 12 µg/L with an approximate range between 0.2 and 246 µg/L. These values could be considered as fairly typical for uranium in groundwater in Swedish Precambrian bedrock. This could be compared with earlier estimations of uranium content of about 3 µg/L in springs, which should be similar to uranium content of the groundwater bodies in the overburden. Uranium content in surface waters has been estimated to be lower than 1µg/L.
Table 11. Statistical data for radon-222 (Rn-222, Bq/L) in randomly chosen springs, dug wells and
drilled wells. Based on 2500 samples. Media: Groundwater (Kulich, 1988, Swedjemark, 1993 and data from Geological Survey of Sweden )
Springs Dug wells Drilled wells
Min 1 1 0 p10 10 4 10 Q1 20 8 30 Median 39 20 85 Q3 85 49 220 P90 153 96 565 Max 845 947 9289
Table 10. Statistical data for radium-226 (Ra-226, mBq/L) in randomly chosen drilled
wells. Based on 492 samples. Media: Groundwater (data from Kulich, 1988, Swedjemark, 1993) Drilled wells Min 0.2 P10 2.0 Q1 5.0 Median 12.0 Q3 35.0 P90 117.0 Max 2455.0
Figure 1 Concentration of equivalent uranium (ppm), thorium(ppm) and potassium (%) in the upper 0.2 meters of the ground (soil, bedrock and
peat). The data are based on airborne gamma-ray spectrometric measurements.
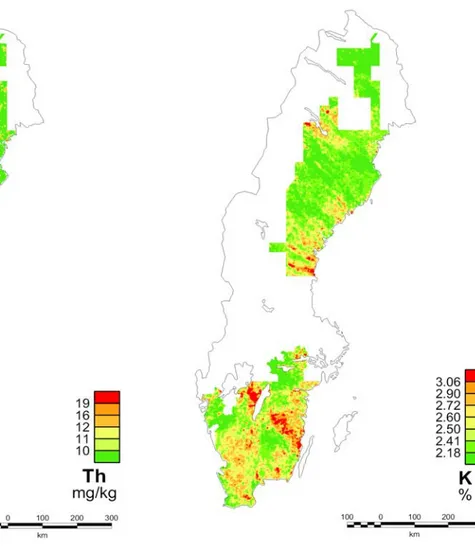
Figure 2 Geochemical concentrations of uranium (ppm), thorium (ppm) and potassium (K, %).
13
Figure 3 Locations of wells with analysis of radium (left) and radon (right.)
Study sites in the Uranium Archive
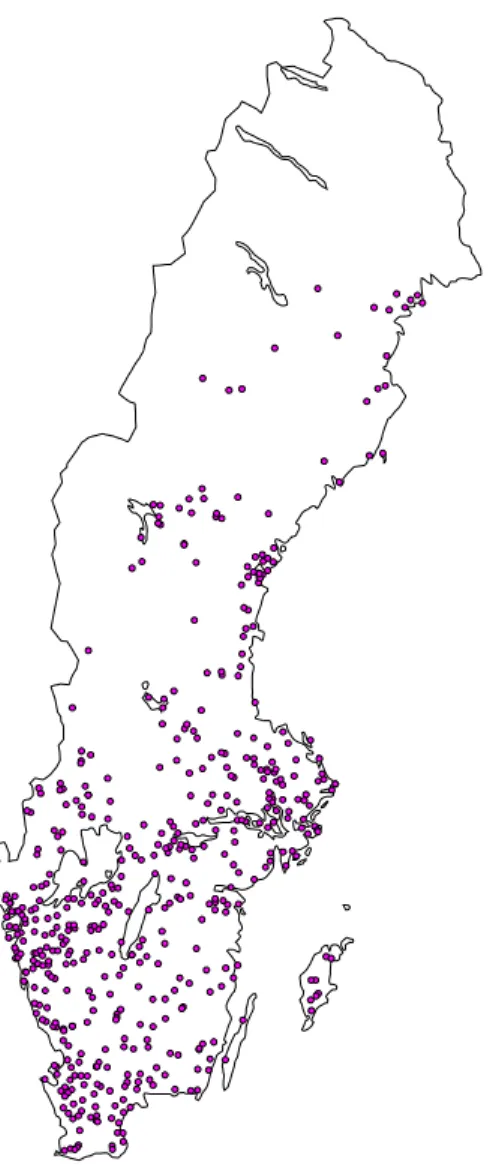
As a result of former uranium exploration in Sweden the Uranium Archive was estab-lished (Gustafsson, 2001). The Uranium Archive contains information from about 2000 sites with various amount and quality of data such as data from airborne gamma meas-urements, geochemistry and drillings. Data collection was focused on exploration thereby information about concentration in groundwater and fluxes is limited. Eight objects have been selected to show naturally extreme concentrations of uranium (Figure 4, Table 12). An extended list of uranium occurrences is given in the appendix.
Figure 4 Selected objects from the uranium archive
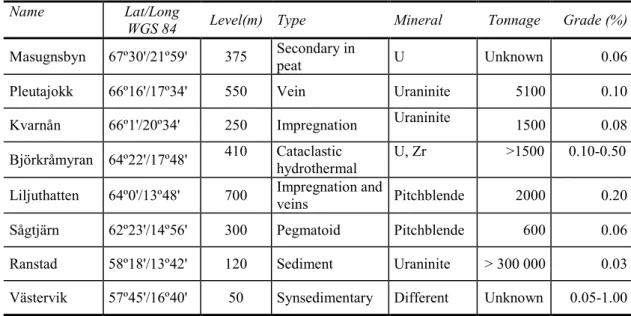
Table 12. Data from selected objects from the uranium archives
Name Lat/Long
WGS 84 Level(m) Type Mineral Tonnage Grade (%)
Masugnsbyn 67º30'/21º59' 375 Secondary in peat U Unknown 0.06 Pleutajokk 66º16'/17º34' 550 Vein Uraninite 5100 0.10 Kvarnån 66º1'/20º34' 250 Impregnation Uraninite 1500 0.08 Björkråmyran 64º22'/17º48' 410 Cataclastic hydrothermal U, Zr >1500 0.10-0.50 Liljuthatten 64º0'/13º48' 700 Impregnation and veins Pitchblende 2000 0.20 Sågtjärn 62º23'/14º56' 300 Pegmatoid Pitchblende 600 0.06 Ranstad 58º18'/13º42' 120 Sediment Uraninite > 300 000 0.03 Västervik 57º45'/16º40' 50 Synsedimentary Different Unknown 0.05-1.00
15
Masugnsbyn
About 4.5 km NW of the village Masugnsbyn (67º27'N/22º2'E) the bog Laurivuoma is situated. In 1958 springwater and peat in the bog were found to contain spots strongly enriched in uranium. The bog consists mainly of sedge peat but changes gradually to the north to a mire type. It is 5 km long and 1 km wide but only small spots of it are enriched in uranium. Dwarf spruce and birch dominate the vegetation. It has been suggested that the uranium has been transported by intra-bedrock water as uranylcarbonate complexes and reduced by the anaerobic organic component when reaching the peat bog. The aver-age uranium content of the organic component from the enriched parts is estimated at 900 ppm U. Up to 30,000 ppm U has been registered in air-dried peat. Radiometric maps from surface measurements show no spot bigger than 5 x 40 meters. No tonnage data is avail-able.
During the late 50’s AB Atomenergi carried out extensive geochemical research on ura-nium in the area by means of water, peat and plants. No bedrock uraura-nium occurrence has been found in the near surroundings.
Pleutajokk
The Pleutajokk uranium deposits are located 30 km NW of Arjeplog at an altitude be-tween 450 to 600 m above sea level. They occur in the valley of the Pleutajokk (Blåuda-jåkkå on modern maps) stream. The terrain is smoothly sloping towards the Lake Hor-navan 1.5 km away. The whole uranium target area measures about 3 x 5 km but due to the glacial drift the radioactive and uranium anomaly area is of about the double size. The landscape is characterised by the transition between the alpine birch and pine forest with open bogs. There are a few outcrops in the area, some with uranium mineralization. The mineralizations occur in strongly recrystallized acid volcanites and are all of vein type. The size of each vein seldom exceeds one centimetre and is mainly filled with quartz with a thin uraninite cover on the walls. Minor amounts of uranium titanate are present. The veins form fan shaped clusters. Wall rock alteration is characterised by al-bitization that extends several meters from the veins. The age of the mineralization is 1.74 Ga and of the surrounding barren granites 1.69 Ga.
Altogether eight localities of uranium mineralization have been identified. One has been found to be of economic interest and has been subject to exploration mining. It was cov-ered with about 5 m of till and it is tied and oblique to a strike-slip fault. It is known down to -500 meter and seems to continue further down with consistent quality. Its lateral extension is about 400 meters. The amount of uranium is calculated at 2000 tonnes of 1,000 ppm.
Geochemical investigations have been performed by sampling of peat at the peat bog margins as well as sampling of the stream water. Gamma spectrometry measurements have been performed on surface near till in the distal parts of some of the boulder trains as well as radon surveys.
Other investigations in the area comprise boulder tracing, mineralogical studies, geologi-cal mapping, geophysigeologi-cal measurements (ground and airborne), trenching, diamond drill-ing includdrill-ing loggdrill-ing and test-mindrill-ing with refinery tests.
Kvarnån
The Kvarnån uranium deposits are located 55 km WNW of Boden at an altitude of ca. 250 m above sea level. The landscape is forested spruce and pine on rather flat glaciflu-vial sediment with a narrow canyon along the Kvarnån River. The mineralization itself is partly naked in the bottom of this canyon where as well the exposed till contains several uranium bearing boulders.
The mineralization consists of rather patchy disseminations forming bands in the transi-tion zone between metasediments and metavolcanites where the former dominates. The overall length is about 600 meters, the dip is around 350 and is known down to -200 me-ters but continues further down. The bands are orientated in the general structural trend of the supracrustals. The dominating uranium mineral is uraninite often enclosed by apatite. Small amounts of copper-sulphides have been observed. Some increase in potassium goes with the mineralization. The age is unknown but is probably Precambrian.
The uranium amount is 1400 tonnes at 700 ppm. One richer part has been calculated to 268 tonnes uranium at 3900 ppm uranium. The highest grade parts are associated with clorite-biotite bands which can be up to 20 meter wide with grades of 1,000 to 2,000 ppm U. Mineralization of 500 to 1,000 ppm U can reach 60 meter width.
Eight km SE of Kvarnån a minor uranium mineralization of the same type has been found. In addition two prospects with uranium bearing boulders in the glacial drift are known from the area but have been left in the exploration due to low uranium content. Radon measurement is the only applied geochemical method.
Other investigations on the deposit are boulder tracing, mineralogical studies, geological mapping, geophysical measurements (ground and airborne), drilling (107 diamond drill- holes - DDH) including logging, trenching and refinery tests.
Björkråmyran
The Björkråmyran uranium deposits are located 40 km NE of Åsele at an altitude of ca. 410 m above sea level. The terrain is flat with forests of spruce and pine and open bogs. There are no outcrops in the area. The mineralization is partly covered by till and partly by bogs.
The mineralization is situated in an area of Precambrian rocks of Svecokarelian age. The host rock is a course porphyric Revsund granite and metasupracrustals of mainly grey-wacke type. The mineralization occurs close to and partly in a fault zone. It is overlaid and partly transacted by an open fracture zone. The uranium is located in a metamict U-Zr-silica compound. The mineralization is characterized by strong sodium enrichment and is almost devoid of potassium. They are divided into at least three different bodies but have no known limitation horizontally or vertically.
Similar but less known uranium mineralization is found 3 km to the SE at Abborrviken. Conducted geochemical investigations are sampling of peat at the peat bog margins and deep moraine/sub-outcrop radiometry.
Other investigations on the deposit are boulder tracing, mineralogical studies, geological mapping including tectonic, geophysical measurements (ground and airborne), drilling (87 DDH) including logging.
17
Lilljuthatten
The Lilljuthatten uranium deposit is located some 150 km NW of Östersund at an altitude of about 700 m above sea level and mainly above the tree line. The area is characterised by sparse vegetation and relatively well exposed bedrock.
The mineralization is situated in a pre-Cambrian “window” within the central Swedish Caledonides. Light grey, course grained and porphyric Olden granite dominates the bed-rock. Dolerite dykes often intrude the granite. The uranium occurs in form of pitchblende and appears within the granite as impregnation and occasionally up to 5 mm joint filling along a mafic-rich crush zone. The textures within the granite are typical for a hydro-thermal breccia with dark coloration. It is dated to an age of 420 ± 3 Ma (late Caledonian age). The ore estimations have proved at least 2,000 tonnes uranium with an average grade of 2,000 ppm U.
Within the Olden-Hotagen area there exists several other mineralizations, located on the western and eastern margin of the Olden window (Lilljuthatten is situated on the eastern margin).
Conducted investigations are geochemical sampling of peat from stream banks and peat bog margins as well as hydrogeological investigations including ground water level ob-servations, water injection tests, test pumping in drill holes and water analysis.
Other investigations on the deposit is boulder tracing, detailed geological mapping, min-eralogical studies, tectonic studies, geophysical measurements (ground and airborne), drilling (98 DDH) including logging and seismic tests.
Sågtjärn
The Sågtjärn uranium deposits are located 7 km W of Haverö at an altitude of ca. 270 m above sea level. The area is forested with a thick till cover and a few outcrops. Planted pines dominate the forest. The relief is moderate. The uranium occurrence, which covers about 700 x 400 meters, is situated in a broad valley bottom with numerous small lakes and marshes. A small part of it is exposed but most of it is covered with till.
The bedrock is a paragneiss of amphibolite facies. It has been derived from alternating argillitic and arenitic sediments. An arcose to subgreywacke environment has been sug-gested. The structure is a synformal open fold. Basic dykes, granitic dykes and pegmatites cut the gneiss. Uranium is found as impregnation in pegmatite neozomes, especially the biotite rich ones. There is a skarn horizon in the gneiss suggested the whole sequence to be a banded iron formation (BIF) affinity. The skarn contains minor amounts of scheelite, arsenopyrite, pyrrhotite and traces of chalcopyrite.
The uranium mineralization contains uraninite, monazite, molybdenite and chalcopyrite. Uranium is the only metal of economic interest. The uranium rich pegmatites occur as irregular sheetlike zones in the gneiss. The dip is around 500. An estimate of the resources
gives 620 tonnes of uranium at 600 ppm U, or 400 tonnes at 1,000 ppm U.
Similar but smaller uranium mineralizations are found along a regional fault structure in NNW direction over a distance of 20 km.
Other investigations on the deposit are boulder tracing, mineralogical studies, geological mapping including tectonic, geophysical measurements (ground and airborne), drilling (43 DDH) including logging.
Ranstad
In the Billingen Mountain in the Västergötland county a huge but low grade uranium deposit is located in Upper Cambrium alum shales. The mountain consists of undisturbed and flat lying sediments with basalt on top. It is covered by forest and pasture and is widely seen surrounded by low flat farmland. The uranium-bearing layer is found in the lower part of the Peltura scarabæoides zone. The layer is exposed in the slope of the mountain. The main sub-outcrop area of this zone has been at Ranstad where 200 tonnes uranium was mined in an open pit during the period 1965 – 1969. A refinery test plant for uranium was constructed to treat the ore. The resource is calculated to 250 Mt containing 75,000 t uranium with an average uranium grade of 340 g/t. In a thin culm-bearing layer the grade can reach 5,000 ppm U. Thickness is reported to be 3.6 meter. Other trace ele-ments are V (680 ppm), Mo (270 ppm), rare earth eleele-ments (REE) (410 ppm). The ura-nium phase is very fine grained and it has not been possible to identify any uraura-nium bear-ing mineral but there is a positive correlation between uranium and the organic component and in some places also phosphorite.
The ore calculation is restricted to the vicinity of Ranstad covering about 28 km2. The
total alum shale area in Billingen is around 500 km2 of which most of it is covered by younger phanerozoic rocks. The main composition of the alum shale is 68 % silicates, 12 % sulphides and 20 % kerogen. Biogen pyrite is the main sulphide. The oil content is about 1.8 %. Farmers have used the shale (especially the uranium rich culm layer) for burning limestone and heating up houses. Though Billingen was one of the first known uranium occurrences in Sweden still a lot of drilling remains to be done to get a reason-able good idea of the lateral uranium distribution.
Other alum shale hosted uranium occurrences in Sweden are found mainly in Östergöt-land, Närke, Kinnekulle and Halle-Hunneberg in VästergötÖstergöt-land, northern Dalarna and Jämtland.
Västervik
In the Västervik-Gamleby area around 85 minor uranium occurrences have been identi-fied. Many of them occur in meta-arenites and can be characterised as former heavy-sand type. Some still occur as distinct thin horizons other as impregnation or fissure fillings in the meta-arenite.
The most advanced investigated one is situated under the Old Water Tower in the town of Västervik. During the 50’s the Johnson Company drilled about 15 DDH. The result from their exploration is still confidential and stored at their Engelsberg archive.
The well-exposed bedrock consists of quartzite. The uranium occurrence is stratigraphicly controlled partly in heavy-sand layers, partly in fissures and partly dispersed distributed. The anomaly radioactive area on surface is 100 x 80 meter big. The strongest radioactiv-ity is found in the heavy sand layers. Those are a few mm wide, strongly deformed and winding. The minerals found here are hematite, ilmenite, zircon and rutile-anatas. Ura-nium occurs in uraninite, davidite and brannerite. Tucholite is found in fissures. UraUra-nium
19
grade is around 100 – 600 ppm. In the heavy mineral bands it can be as much as 15,000 ppm U. The U:Th ratio exceeds 10:1.
Interpretation and application of data
The data presented are intended to be used for reference purposes and to support the de-velopment of safety indicators.
Concentration data for uranium, thorium and potassium are generally sufficiently abun-dant to be explored as references for safety indicators. However, it should be noted that the amount of data for Th in groundwater is somewhat limited. Sampling and analysis methods have to be considered when using the data. The total concentration is most rele-vant, but some methods can only measure a fraction of this.
Concentration data could be used for other applications than development of safety indi-cators. One possibility is to use data from mapping of radioactive elements to identify areas with possible risk for human health. Another possibility is the use of data from groundwater to develop criteria for drinking water quality.
The estimations of element fluxes for uranium, thorium and potassium were based on element concentration and data on runoff ranges (Raab and Vedin, 1995). The runoff was assumed largely to occur as groundwater runoff (i.e. precipitation – evapotranspiration). Thereby the element flux was estimated as element concentration x groundwater runoff. In addition, data on water fluxes and concentration data on potassium for a few river were used (Swedish Environmental Protection Agency).
The flux of potassium by groundwater is estimated to range between 100 and 400 kg/km2/year. This estimate is based on median values of measured concentrations and
possible ranges of groundwater runoff together with concentration data and studies on weathering rates (Olsson et al., 1993). Most of this flux is assumed to originate from weathering processes in the upper part of the soil. Values are generally higher in the south-western parts of Sweden mainly due to higher values on runoff. It should be noted that potassium is an important plant nutrient, which means that the flux is influenced by land use and vegetation. Data on total potassium concentration in some rivers indicate fluxes in the magnitude of 200 – 500 kg/km2/year.
A rough estimate of uranium fluxes by using data on concentration together with data on groundwater runoff gives values of 0.2 – 2 kg/km2/year. This is based on median values on concentration of uranium in groundwater (Table 9) and data on runoff ranges. Fluxes of thorium have not been estimated due to a very limited amount of data, which indicates very low values, below 0.1 mg/L. In general attempts to estimate fluxes proved to be difficult for various reasons. One difficulty is uncertainties owing to processes that are not in a steady state condition. This is largely due to the glaciation that ended about 10 000 years ago which means that the weathering processes are in an early stage compared with other parts of the world with no glaciation. Other difficulties are associated with the spatial scale. The fluxes of elements within the unsaturated zone could differ considerably from the corresponding catchment area. In addition, fluxes are supposed to vary between small catchments whereas a large river basin provides an average value for all catchments within the river basin as well as the contribution from deep flow paths within the basin. The uranium archive can be used to get information about natural extreme values of ura-nium in the bedrock. This means that a possible leakage from a repository can be related
to natural anomalies. However any data on groundwater within the anomalies are not known.
Conclusions
Data on concentrations of uranium, thorium and potassium are extensive and may be used in the development of references for complementary safety indicators. However, useful data on fluxes are difficult to obtain, mainly due to problems in the treatment of spatial scales and non-steady state conditions of erosion processes. Additional difficulties could be found in the approach for comparing natural fluxes with possible fluxes from a leach-ing repository.
21
References
Aastrup, M. 1981. Naturligt förekommande uran-, radium-, och radonaktiviteter i grund-vatten. SKBF/KBS TR 81-08, Stockholm.
Becker, D.-A., Buhmann, D., Storck, R, Alonso, J., Cormenzana, J.-L., Hugi, M., van Gemert, F., O’Sullivan, P., Laciok, A., Marivoet, J. , Sillen, X., Nordman, H., Vieno, T. and Niemeyer, M. 2002. Testing of Safety and Performance Indicators. Final Report of SPIN project. EUR report 19965 EN.
Ek, B.-M. 2003. FoU-seminarium vid SGU 11-12 mars 2003 – dokumentation. SGU – rapport 2003:4.
Fredén, C. (ed.). 1994. National Atlas of Sweden – Geology.
Geological Survey of Sweden. Information from databases. http://www.sgu.se.
Gustafsson, B. 2001. SGU Uranium Archive. Review, Present Status, Measures to be done. SGU report MINK 0026.
IAEA, 2004. Natural Safety Indicators for Use in relation to Radioactive Waste Disposal: Synthesis of CRP Results. IAEA-TECDOC (in press).
Kulich, J., Möre, H., and Swedjemark G.-A. 1988. Radon och radium i hushållsvatten. SSI-rapport 88-11.
Lewin, L. and Simoenidis, A. 1998. Mapping of Radon, Fluoride and Heavy Metals in Drilled Wells within Uppsala Municipality. Uppsala Kommun, Miljökontoret.
Miller, B., Lind, A., Savage, D., Maul, P. and Robinson, P. 2002. Natural elemental con-centrations and fluxes: their use as indicators of repository safety. SKI report 02:3, SSI report 02:02.
Nordic Radiation Protection and Nuclear Safety Authorities. 1993. Disposal of High-Level Radioactive Waste. Consideration of Some Basic Criteria.
Nordic Radiation Protection and Nuclear Safety Authorities. 2000. Naturally Occurring Radioactivity in the Nordic Countries – Recommendations.
Olsson, M., Rosén, K and Melkerud, P.-A. 1993. Regional modelling of base cation losses from Swedish forest soils due to whole-tree harvesting. Applied Geochemistry, Suppl. Issue No 2. pp 189-194.
Raab, B. and Vedin, H. (eds.) 1995. National Atlas of Sweden – Climate, Lakes and Riv-ers
Swedish Environmental Protection Agency. Information on environmental monitoring. http://www.naturvardsverket.se/.
Swedjemark, G. A. Radon och radium i vatten. Underlag för bestämmelser. SSI-rapport 93-34.
Wingefors, S., Westerlind, M. and Gera, F. 1999. The use of safety indicators in the as-sessment of radioactive waste disposal, Proceedings of the International Symposium on Radioactive Waste Disposal: Health and Environmental Criteria and Standards, Stock-holm, 1999. pp. 263-268.
UNSCEAR, 2000. Sources and Effects of Ionizing Radiation, United Nations Scientific Committee on the Effects of Atomic Radiation. UNSCEAR 2000 Report to the General Assembly, with Scientific Annexes, Volume I: Sources.
Östergren, I., Falk, R., Mjönes, L., and Ek, B.-M. 2003. Mätning av naturlig radioaktivitet i dricksvatten. Test av mätmetoder och resultat av en pilotundersökning. SSI-rapport 2003:07.
23
Appendix. Table with data from uranium occurrences in Sweden.
Uranium occurrences in Sweden. Coordinates are given in RT90 2.5 GON W
Municipality Name of object Coordinate-North
Coordinate-East
County Topographic map Radia-tion (µµµµR/h) U (ppm) Th (ppm)
Björkvattnet 7111200 1378400 Jävsöhatten SO: 21D
SO
Arjeplog Arresåive 7281900 1594450 Norrbottens län Sorsele NO: 24H NO
Arjeplog Måffe 7346900 1594600 Norrbottens län Arjeplog NO: 25H NO
Arjeplog Virka 7305300 1605100 Norrbottens län Stensund SV: 25I SV 600
Arjeplog Rebraur Västra 7340400 1607300 Norrbottens län Stensund NV: 25I NV
Arjeplog Pleutajokk D 7353000 1580900 Norrbottens län Jäkkvik SO: 26H SO
Arjeplog Pleutajokk B 7353200 1579150 Norrbottens län Jäkkvik SO: 26H SO
Arjeplog Pleutajokk A 7353300 1579950 Norrbottens län Jäkkvik SO: 26H SO
Arjeplog Pleutajokk C 7353850 1580450 Norrbottens län Jäkkvik SO: 26H SO
Arjeplog Grutaure 7355400 1570350 Norrbottens län Jäkkvik SV: 26H SV
Municipality Name of object Coordinate-North
Coordinate-East
County Topographic map Radia-tion (µµµµR/h) U (ppm) Th (ppm)
Arjeplog Pleutajokk F 7356100 1582050 Norrbottens län Jäkkvik SO: 26H SO
Arjeplog Autjak 7356800 1566500 Norrbottens län Jäkkvik SV: 26H SV
Arjeplog Pleutajokk G 7357050 1581000 Norrbottens län Jäkkvik SO: 26H SO
Arjeplog Harrejokk 7360000 1573900 Norrbottens län Jäkkvik SV: 26H SV
Arjeplog Labbas 1 7370000 1573900 Norrbottens län Jäkkvik SV: 26H SV
Arjeplog Sjiunjanjaure 7370500 1597300 Norrbottens län Jäkkvik SO: 26H SO
Arjeplog Blocklund 7375800 1599900 Norrbottens län Jäkkvik NO: 26H NO
Arjeplog Viepsajokk 1 7378400 1576200 Norrbottens län Jäkkvik NO: 26H NO
Arjeplog Vuotsas 7378700 1599600 Norrbottens län Jäkkvik NO: 26H NO
Arjeplog Akkapakte 7394700 1585100 Norrbottens län Jäkkvik NO: 26H NO
Arjeplog Skuppesavon S S 7372600 1600000 Norrbottens län Luvos SV: 26I SV
Arjeplog Skuppesavon S 7373500 1600200 Norrbottens län Luvos SV: 26I SV
Arjeplog Skuppesavon N 7374400 1600200 Norrbottens län Luvos SV: 26I SV
Arjeplog Gervåive 1 7318200 1600900 Norrbottens län Stensund SV: 25I SV
25
Municipality Name of object Coordinate-North
Coordinate-East
County Topographic map Radia-tion (µµµµR/h) U (ppm) Th (ppm)
Arjeplog Plättik2 7316700 1617500 Norrbottens län Stensund SV: 25I SV
Arjeplog Gervåive 7312950 1602550 Norrbottens län Stensund SV: 25I SV
Arvidsjaur Björklund östra 7269690 1624325 Norrbottens län Storavan SV: 24I SV 1760
Arvidsjaur Björklund väst 7269790 1624175 Norrbottens län Storavan SV: 24I SV 1970
Arvidsjaur Björklund centrala 7269790 1624225 Norrbottens län Storavan SV: 24I SV 920
Arvidsjaur Rävaberget 7284600 1632400 Norrbottens län Storavan NO: 24I NO 700
Arvidsjaur Långträsk 7293750 1633250 Norrbottens län Storavan NO: 24I NO 490
Arvidsjaur JärntjärnbäckenÖst-ra
7294700 1637900 Norrbottens län Storavan NO: 24I NO 1143
Arvidsjaur Sör Döttern 1 7296150 1633200 Norrbottens län Storavan NO: 24I NO
Arvidsjaur Sör Döttern 2 7296500 1633800 Norrbottens län Storavan NO: 24I NO
Arvidsjaur Liessetjåkke 7298000 1634550 Norrbottens län Storavan NO: 24I NO
Arvidsjaur Norr Döttern 2 7298600 1634900 Norrbottens län Storavan NO: 24I NO 30000
Arvidsjaur Kikkejaure Västra 7299655 1636655 Norrbottens län Storavan NO: 24I NO
Municipality Name of object Coordinate-North
Coordinate-East
County Topographic map Radia-tion (µµµµR/h) U (ppm) Th (ppm)
Askersund Kattegruvorna 6526520 1461770 Örebro län Finspång NV: 9F NV
Askersund Vilhelmsgruvan 6526770 1461730 Örebro län Finspång NV: 9F NV
Askersund Fräkengruvan 6526790 1461680 Örebro län Finspång NV: 9F NV
Askersund Hästgruvan 6526800 1461640 Örebro län Finspång NV: 9F NV
Askersund Västerby Fsp-brott 6523750 1458250 Örebro län Finspång SV: 9F SV 1200
Askersund Wihelmsgruvan 6526760 1461700 Örebro län Finspång NV: 9F NV
Askersund Stegehällsgruvor-na(Fe)
6523400 1461450 Örebro län Finspång SV: 9F SV 250
Bengtsfors Långvattnet 6545160 1301500 Västra Götalands
län
Mellerud NV: 9C NV
Bengtsfors Åsnebogruvan 6545300 1301000 Västra Götalands
län
Mellerud NV: 9C NV
Bengtsfors Gruvan-1 6545160 1301500 Västra Götalands
län
Mellerud NV: 9C NV 3000 3100 20
Bengtsfors Gruvan-2 6545160 1301500 Västra Götalands
län
Mellerud NV: 9C NV 3000
27
Municipality Name of object Coordinate-North
Coordinate-East
County Topographic map Radia-tion (µµµµR/h) U (ppm) Th (ppm) län
Bengtsfors Hällarna-2 6545480 1302640 Västra Götalands
län
Mellerud NV: 9C NV 1300 950 100
Bengtsfors Tjäderkullen 6545750 1301320 Västra Götalands
län
Mellerud NV: 9C NV
Bengtsfors Härserud 6545480 1302640 Västra Götalands
län
Mellerud NV: 9C NV
Bengtsfors Skolhusberget 6537000 1303900 Västra Götalands
län
Mellerud NV: 9C NV 700
Bengtsfors Åsnebo 6545030 1301130 Västra Götalands
län
Mellerud NV: 9C NV 800 40 70
Bengtsfors Gruvan-3 6545300 1301450 Västra Götalands
län
Mellerud NV: 9C NV 1300
Bengtsfors Dammeruddsbäcken6545335 1302170 Västra Götalands
län
Mellerud NV: 9C NV 400
Bengtsfors Predikstolen 6545515 1302980 Västra Götalands
län
Mellerud NV: 9C NV 3000
Municipality Name of object Coordinate-North
Coordinate-East
County Topographic map Radia-tion (µµµµR/h) U (ppm) Th (ppm) län
Bengtsfors Stångmyrberget 6545600 1302850 Västra Götalands
län
Mellerud NV: 9C NV 1500
Bengtsfors Tjäderkullen 6545750 1301320 Västra Götalands
län
Mellerud NV: 9C NV 1200
Bengtsfors Hansebotjärnet-1 6546350 1301530 Västra Götalands
län
Mellerud NV: 9C NV 400
Berg Klövsjö 6936650 1417120 Jämtlands län Rätan NV: 17E NV
Berg Handsjö 6932000 1448000 Jämtlands län Rätan NO: 17E NO
Berg Åviken 6972500 1363000 Jämtlands län Storsjö SV: 18D SV
Berg Skålan 6948130 1417420 Jämtlands län Rätan NV: 17E NV
Berg Storhallen 6954280 1419040 Jämtlands län Hackås SV: 18E SV
Berg Tossåsen 6983600 1370250 Jämtlands län Storsjö NV: 18D NV
Berg Sölvbacktjärn 6968600 1369100 Jämtlands län Storsjö SV: 18D SV
Berg Tossåsberget 6954960 1427630 Jämtlands län Hackås SO: 18E SO
29
Municipality Name of object Coordinate-North
Coordinate-East
County Topographic map Radia-tion (µµµµR/h) U (ppm) Th (ppm)
Berg Oviken 6990000 1430000 Jämtlands län Hackås NO: 18E NO
Bjuv Billesholm
sten-kolsgruva
6217400 1323400 Skåne län Helsingborg SV: 3C
SV
250
Boden Brännspiken 7328000 1717000 Norrbottens län Harads NV: 25K NV
Boden Kvarnån 7332600 1715900 Norrbottens län Harads NV: 25K NV
Bollnäs Långmyrtjärnberg 6786000 1519400 Gävleborgs län Ockelbo NV: 14G NV
Bollnäs Nissamyrbäcken 6833000 1540200 Gävleborgs län Bollnäs NO: 15G NO
Bollnäs Nybodavallen 6834000 1537000 Gävleborgs län Bollnäs NO: 15G NO
Bräcke Höksjön 6972050 1450200 Jämtlands län Bräcke SV: 18F SV 2200
Degerfors No name 6566000 1421450 Örebro län Karlskoga SV: 10E SV
Degerfors No name 6566225 1421480 Örebro län Karlskoga SV: 10E SV
Degerfors Bergtjärn 6566225 1421475 Örebro län Karlskoga SV: 10E SV 400
Dorotea Tåsjö 7150000 1492000 Västerbottens län Risbäck SO: 22F SO
Dorotea Onbäcken 7151060 1500000 Västerbottens län Vilhelmina SV: 22G
Municipality Name of object Coordinate-North
Coordinate-East
County Topographic map Radia-tion (µµµµR/h) U (ppm) Th (ppm)
Enköping Koholmen 6592300 1589800 Uppsala län Strängnäs NO: 10H
NO
400
Enköping Holstervik 6593450 1589800 Uppsala län Strängnäs NO: 10H
NO
350
Enköping Torsvi 6596450 1586600 Uppsala län Strängnäs NO: 10H
NO
400
Eskilstuna NE Tallholmen 6573250 1509800 Södermanlands
län
Eskilstuna SV: 10G SV
1000
Eskilstuna Degersten 6574800 1558000 Södermanlands
län
Strängnäs SV: 10H SV 800 130 40
Eskilstuna SE Falla 6571050 1516400 Södermanlands
län Eskilstuna SV: 10G SV 1000 1080 20 Eskilstuna Tandtorp-Ladubråten 6566500 1517600 Södermanlands län Eskilstuna SV: 10G SV 2000 6840 270
Eskilstuna NV Myrstugan 6572450 1514400 Södermanlands
län
Eskilstuna SV: 10G SV
1000
Eskilstuna N Tallbacken 6573250 1512600 Södermanlands
län
Eskilstuna SV: 10G SV
31
Municipality Name of object Coordinate-North
Coordinate-East
County Topographic map Radia-tion (µµµµR/h) U (ppm) Th (ppm)
Falkenberg V Korsbyn 6335550 1308645 Hallands län Ullared NV: 5C NV 900 580 20
Falkenberg Håkerud 6338000 1308915 Hallands län Ullared NV: 5C NV 400
Finspång Fläskgruvan 6520900 1482400 Östergötlands län Finspång SO: 9F SO
Finspång Klinta 6524200 1520950 Östergötlands län Katrineholm SV: 9G
SV
400 180 60
Flen Gryt 6535650 1549550 Södermanlands
län
Katrineholm NO: 9G NO
1200
Gislaved Ingelsbo 6367700 1363100 Jönköpings län Gislaved SV: 6D SV 3000
Gällivare Meuresvare 7414200 1720000 Norrbottens län Nattavaara SV: 27K
SV
Hallsberg Römossen 6545350 1458250 Örebro län Finspång NV: 9F NV 3000
Hallsberg Samsala järngruva 6547240 1462560 Örebro län Finspång NV: 9F NV 1000 450 100
Hallsberg Lundby 6557500 1477000 Örebro län Örebro SO: 10F SO 200
Hallsberg S Karlsdal 6533480 1485200 Örebro län Finspång NO: 9F NO 800
Hallsberg E Bjurhytta 6537720 1479600 Örebro län Finspång NO: 9F NO 1000
Municipality Name of object Coordinate-North
Coordinate-East
County Topographic map Radia-tion (µµµµR/h) U (ppm) Th (ppm)
Hallsberg Ormhult 6546340 1462050 Örebro län Finspång NV: 9F NV 1000
Hudiksvall Lingarö 6846500 1576200 Gävleborgs län Hudiksvall NO: 15H
NO
Hudiksvall Majsaberget 6832000 1550000 Gävleborgs län Bollnäs NO: 15G NO
Härjedalen Staverberget 6913500 1452500 Jämtlands län Ånge SV: 17F SV 12500
Jokkmokk Manak S 7444800 1618750 Norrbottens län Tjåmotis NV: 27I NV 800
Jokkmokk Manak M 7445500 1619350 Norrbottens län Tjåmotis NV: 27I NV
Jokkmokk Manak N 7446000 1619300 Norrbottens län Tjåmotis NV: 27I NV
Jönköping Björket 6434400 1424200 Jönköpings län Jönköping NV: 7E NV 500
Kalix Pålänge 7322000 1824000 Norrbottens län Kalix SV: 25M SV 300
Karlskrona Vingleskär 6213100 1497200 Blekinge län Karlskrona SO: 3F SO
Karlstad Skutberget 6585850 1362800 Värmlands län Karlstad NV: 10D NV 1600 1700
Katrineholm Stentorpshagkärr 6521550 1531200 Södermanlands
län
Katrineholm SO: 9G SO
3000 1150 150
Katrineholm NE Bergnäs 6539050 1537500 Södermanlands
län
Katrineholm NO: 9G NO
33
Municipality Name of object Coordinate-North
Coordinate-East
County Topographic map Radia-tion (µµµµR/h) U (ppm) Th (ppm)
Katrineholm SE Lillmyran1 6558350 1521400 Södermanlands
län
Eskilstuna SV: 10G SV
1200 740 160
Katrineholm Valfallagruvan 6555550 1523175 Södermanlands
län Eskilstuna SV: 10G SV 3000 5030 90 Katrineholm NV Långtjärn 6558950 1525000 Södermanlands län Eskilstuna SO: 10G SO 1000
Katrineholm Stavängsholmen 6549450 1535500 Södermanlands
län
Katrineholm NO: 9G NO
600
Katrineholm N. Skyttorp 6549750 1534300 Södermanlands
län
Katrineholm NO: 9G NO
600
Katrineholm SV Vädret 6565750 1512300 Södermanlands
län
Eskilstuna SV: 10G SV
1000
Kiruna Kopparåsen W 7602250 1608250 Norrbottens län Vadvetjåkka SV: 31I
SV
Kiruna Kopparåsen S 7598200 1608650 Norrbottens län Abisko NV: 30I NV
Kiruna Kopparåsen N 7601050 1608950 Norrbottens län Vadvetjåkka SV: 31I
SV
Municipality Name of object Coordinate-North
Coordinate-East
County Topographic map Radia-tion (µµµµR/h) U (ppm) Th (ppm)
Kiruna Äijärova-N 7517800 1733700 Norrbottens län Vittangi SO: 29K SO
Kiruna Masugnsbyn 7502000 1764000 Norrbottens län Lainio SO: 29LSO 900
Kristianstad Ullarp 6204000 1380000 Skåne län Kristianstad SO: 3D
SO
1000
Kristianstad Ivö klack 6223200 1413300 Skåne län Karlshamn SV: 3E SV 1000
Krokom Buretjakke 7094870 1399550 Jämtlands län Kolåsen NO: 20D NO
Krokom Område 15 7095850 1392500 Jämtlands län Kolåsen NO: 20D NO
Krokom Stensjöån 7099600 1399700 Jämtlands län Kolåsen NO: 20D NO 5200
Krokom Område17 7099850 1398000 Jämtlands län Kolåsen NO: 20D NO
Krokom Kläppibäcken 7095160 1404300 Jämtlands län Hotagen NV: 20E NV
Krokom Område 8 S 7095600 1401150 Jämtlands län Hotagen NV: 20E NV
Krokom Stensjödalen 7096150 1401050 Jämtlands län Hotagen NV: 20E NV
Krokom Tresjöarna 7096150 1402200 Jämtlands län Hotagen NV: 20E NV
Krokom Nöjdfjället SO 7096800 1405300 Jämtlands län Hotagen NV: 20E NV 1000
35
Municipality Name of object Coordinate-North
Coordinate-East
County Topographic map Radia-tion (µµµµR/h) U (ppm) Th (ppm)
Krokom Ravinen 7097300 1402200 Jämtlands län Hotagen NV: 20E NV
Krokom Område 6 7097450 1402100 Jämtlands län Hotagen NV: 20E NV
Krokom Nöjdfjället 7098000 1403450 Jämtlands län Hotagen NV: 20E NV 700
Krokom Lilljuthatten 7099850 1401950 Jämtlands län Hotagen NV: 20E NV 1900
Krokom Långtjärn 7099850 1406300 Jämtlands län Hotagen NV: 20E NV
Krokom Område18 7100000 1397250 Jämtlands län Jävsöhatten SO: 21D
SO
Krokom Spjutsjöarna 7100000 1400500 Jämtlands län Håkafot SV: 21E SV
Krokom Område 5 7101250 1402960 Jämtlands län Håkafot SV: 21E SV
Krokom Klockansexklumpen7102000 1403050 Jämtlands län Håkafot SV: 21E SV
Krokom Område 10 7102030 1400200 Jämtlands län Håkafot SV: 21E SV
Krokom Prästrun 7075100 1404200 Jämtlands län Hotagen NV: 20E NV
Krokom Mahkene 7100100 1385000 Jämtlands län Jävsöhatten SO: 21D
SO
Municipality Name of object Coordinate-North
Coordinate-East
County Topographic map Radia-tion (µµµµR/h) U (ppm) Th (ppm)
Kungsbacka Jöddesgård 6379400 1289520 Hallands län Kungsbacka NO: 6B
NO
3000
Kungsbacka 1 km S. Karsjö 6381300 1285300 Hallands län Kungsbacka NO: 6B
NO
600
Köping Dåvö 6595500 1520850 Västmanlands län Eskilstuna NV: 10G
NV
600 160 90
Laxå V Spännartorp 6554320 1432600 Örebro län Karlskoga SO: 10E SO 1100
Leksand Digerbergsgruvan 6725460 1469230 Dalarnas län Falun NV: 13F NV
Leksand Digerbergsgruvan 6725430 1469200 Dalarnas län Falun NV: 13F NV
Ljusdal Riberget 6839200 1450300 Gävleborgs län Voxna NV: 15F NV
Ljusdal Sandsjöån 6829400 1452850 Gävleborgs län Voxna NV: 15F NV
Ljusdal Tjärdalsmyran 6828400 1466700 Gävleborgs län Voxna NV: 15F NV
Ljusdal Hästtjärn 6828500 1467500 Gävleborgs län Voxna NV: 15F NV
Lund Södra Sandby 6179000 1344000 Skåne län Malmö NO: 2C NO 150
Lund Romelestugan 6169900 1350800 Skåne län Tomelilla SV: 2D SV
37
Municipality Name of object Coordinate-North
Coordinate-East
County Topographic map Radia-tion (µµµµR/h) U (ppm) Th (ppm)
Mellerud Båsane 6522250 1297340 Västra Götalands
län
Dals-Ed SO: 9B SO 190 140 30
Mellerud Ljungbergen 6526075 1298550 Västra Götalands
län
Dals-Ed NO: 9B NO 300
Mellerud Rönningen 6524650 1307450 Västra Götalands
län
Mellerud SV: 9C SV
Mellerud V Berg-Snäcke-Ryr 6526940 1308860 Västra Götalands
län
Mellerud NV: 9C NV 800 240 30
Mellerud Ljungbergen 6526075 1298550 Västra Götalands
län
Dals-Ed NO: 9B NO 2000 20 20
Mellerud Rönningen 6524650 1307450 Västra Götalands
län
Mellerud SV: 9C SV 1200
Motala Tybble 1 6519150 1469200 Östergötlands län Finspång SV: 9F SV
Motala Baggetorp 6510900 1480200 Östergötlands län Finspång SO: 9F SO
Motala Hållingtorp 6497400 1463040 Östergötlands län Linköping NV: 8F NV 500
Motala Harhult - Daldiket 6519000 1466000 Östergötlands län Finspång SV: 9F SV 800
Municipality Name of object Coordinate-North
Coordinate-East
County Topographic map Radia-tion (µµµµR/h) U (ppm) Th (ppm)
Motala Tybble järngruvor 6519150 1469700 Östergötlands län Finspång SV: 9F SV 1000
Munkedal Barhult 6497500 1260200 Västra Götalands
län
Vänersborg NV: 8B NV
500
Mölndal 1,5 km NE Sisjön 6396200 1272200 Västra Götalands
län
Kungsbacka NV: 6B NV
700
Mönsterås Mönsterås 6326000 1538650 Kalmar län Oskarshamn NO: 5G
NO
Mörbylånga NO. Kastlösa 6260800 1539300 Kalmar län Kalmar SO: 4G SO 200 170 70
Nora Gyttorp Ceritgruvan 6599650 1452000 Örebro län Örebro NV: 10F NV 301 1700 20
Norrköping Krokek 6505900 1532000 Östergötlands län Katrineholm SO: 9G
SO
1200 100 60
Norrköping Raggansgruvan 6508250 1534800 Östergötlands län Katrineholm SO: 9G
SO
407 250
Norrköping Skrovsjögöl 6518950 1519050 Östergötlands län Katrineholm SV: 9G
SV
3000 130 80
Norrköping Myckelmossasjön 6520650 1517400 Östergötlands län Katrineholm SV: 9G
SV
39
Municipality Name of object Coordinate-North
Coordinate-East
County Topographic map Radia-tion (µµµµR/h) U (ppm) Th (ppm)
Norrköping Björnkärret 6507600 1530950 Östergötlands län Katrineholm SO: 9G
SO
1600 870 110
Norrköping E Svartgölen 6520250 1519400 Östergötlands län Katrineholm SV: 9G
SV
1500 780 200
Norrköping NE Skrovsjögöl 6519300 1519250 Östergötlands län Katrineholm SV: 9G
SV
600
Nyköping Stavsjöbruk 6511000 1536000 Södermanlands
län
Katrineholm SO: 9G SO
2500
Nyköping Kalkonberget 6513250 1550600 Södermanlands
län
Nyköping SV: 9H SV 3000 1000
Nyköping NE Tidaberg 6513250 1551750 Södermanlands
län
Nyköping SV: 9H SV 3000
Nyköping NV Sofilund 6514000 1551350 Södermanlands
län
Nyköping SV: 9H SV 500
Nyköping Stenbro 6517800 1569850 Södermanlands
län
Nyköping SV: 9H SV 500 160 50
Nyköping Sätterstaberget 6518000 1569200 Södermanlands
län
Municipality Name of object Coordinate-North
Coordinate-East
County Topographic map Radia-tion (µµµµR/h) U (ppm) Th (ppm)
Nyköping SE Myra 6518600 1570550 Södermanlands
län
Nyköping SV: 9H SV 800 300 70
Nyköping Vreta 6522000 1573200 Södermanlands
län
Nyköping SV: 9H SV 200
Nyköping Björkbacken 6523150 1572850 Södermanlands
län
Nyköping SV: 9H SV 400 310 50
Nyköping SE Moga 6504350 1563000 Södermanlands
län
Nyköping SV: 9H SV 500 50 70
Nyköping Björkholm 6512600 1549600 Södermanlands
län
Katrineholm SO: 9G SO
3000 27000 2390
Nyköping Björkholm 6512450 1551735 Södermanlands
län
Nyköping SV: 9H SV 3000 1480 80
Nyköping Stavsjö värdshus 6511200 1534350 Södermanlands
län
Katrineholm SO: 9G SO
3000 1350 450
Olofström Väst Stora Kroksjön 6244000 1414800 Blekinge län Karlshamn NV: 3E
NV
1000 430 540
Olofström Sydost Stora
Krok-sjön
6241850 1415300 Blekinge län Karlshamn NV: 3E
NV