Title: Utility Investment Planning using Risk Analysis: A Case Study of Tanzania’s Power Sector
Author: Mirjam Larsson
Supervisor: Ingela Elofsson, Department of Production Management, Lund University, Faculty of Engineering
Background: Investments in infrastructure projects in developing countries are often seen as risky by private investors and local capital markets are not fully developed. Consequently, financial resources and guarantees are often to a large extent provided by financial institutions. Financial and economic analysis is important in assessing infrastructure investment proposals in order to assure that they are financially sustainable and make the best use of scarce resources. Investments in the energy sector are associated with some special risks, such as uncertainty about hydrology variations, volatile oil prices, future demand etc. Many traditional methods for assessing investment programs are not very well equipped to handle risk.
Tanzania is a development country, which is receiving support from different donor countries and agencies for the purpose of reforming the energy sector and for increasing the access to electricity within the country. At the same time, Tanzania’s and its power sector has been affected by severe droughts, leading to shortage of productive capacity and load shedding.
Objective: The purpose of the thesis is to develop a method which combines quantitative risk analysis with traditional methods for power sector investment appraisal. The method shall be demonstrated by creating a financial model and adapting it to a real case. The model shall be able to consider identified, inherent risk factors and their conceivable impact on the power system.
Methodology: In order to fulfil the purpose of this master thesis, a quantitative case study has been
conducted. The case studied is a capital investment program for Tanzania’s power sector, including identification of inherent risk variables and their effects on the financial viability of the program. Three risk variables are identified as the most critical for the case; (i) the annual contribution of hydro-power to the system; (ii) the price of oil; and (iii) the specific demand for electricity.
The data required for the analysis of this thesis has been collected from multiple sources of information. The main source has been documentation, used for empirical data as well as for the theoretical framework. Further, archival records have been widely used for the study as well as open interviews and personal correspondence with employees at Tanzania’s major power utility, TANESCO. Finally, the author has used direct observational sources of information during her two years of consulting assignment at TANESCO, working with related issues. A financial Excel model has been developed for the case study and is used as a tool
combined with the financial model. The technique used by @Risk is Monte Carlo simulation.
Conclusion: In order to demonstrate the flexibility of the method for quantitative risk analysis, the case was analysed from various angles, i.e. base case analysis, stress analysis and variation of the investment program etc.
The overall advantages of the method can be summarised as follows. Firstly, calculating the probability distribution of the financial indicators enhances the basis for decision and quantifies the company’s risk exposure due to the investment program. Further, as a result of the simulation, the full range of expected outcomes of the risk variables is analysed and the result is presented in a lucid way. For a decision maker, the combined influence of all risk variables can easily be observed. Moreover, the method can easily be extended to more than three risk variables as well as provide information on whether a risk variable is negligible or not. Stress analysis provides the decision maker with additional insight. Finally, risk assessment increases the opportunity of identifying effects of changes in investment plans and comparing them with the base case both in terms of expected benefits and in terms of associated risk exposure.
However, the method has some drawbacks as well. The method involves a difficulty in the identification of risk variables as well as estimating the distribution functions for the variables. Quantitative risk analysis also makes the basis for the investment decision more complex, as the decision is not based on a single net present value.
Case Study Results:
The financial result of the investment plan analysed, based on a real discount rate of 7%, shows a negative net present value (NPV), calculated over a period of 20 years. The negative NPV amounts to almost USD 1 billion for an investment program in the amount of USD 4.7 billion, indicating that the assumed tariffs do not cover all costs, which is essential for an investment program to be financially viable. An analysis of the required tariff level to attain a positive net present value indicates that a 37% tariff increase in the first year of analysis would be needed. There is a significant variation in the NPV as a result of the simulations performed, indicating that the three risk variables, oil price, hydrology and future demand do have a strong effect on the financial outcome of the investment plan.
With regard to unserved energy, the analysis shows that the investments in generation are fully appropriate, and even somewhat excessive, during the first 7 years of analysis, showing virtually no risk for unserved energy during this period. With the assumption of an annual growth in demand of 10% with a variation of 4 % the last years, the demand will most likely not be served after year 2015. For the entire 20 year period of analysis, the proposed investment plan indicates a mean amount of total unserved energy of 28 TWh. This effect appears at the end of the period, with an unserved demand reaching a mean of 25% of the total energy demand in the last year. It can be concluded that there is an unbalance between future demand and generation capacity by the end of the period. The reason for this may be that the assumptions regarding future demand may be too optimistic, however, if this demand is to be met investment in generation need to be
As a result of this observation, an analysis was performed of an expanded investment plan including its effects on both unserved demand and the net present value. The extended investment plan includes a postponement of the Kinyerezi gas plant, and additional investment in both hydro power and coal fired power plants. With these assumptions, the net present value increases substantially at the same time as the amount of unserved demand is significantly reduced. However, even assuming an additional capacity of a total 1600 MW after year 2015, the generating capacity of the system is still not sufficient to meet an increase of demand of 10% annually over the next 20 years.
Key Words: Quantitative risk analysis, power sector, investment planning, investment decision, financial analysis, uncertainties, discounted cash flow, net present value, probability distribution, Monte Carlo simulations.
The author gratefully acknowledges the support from numerous individuals at Tanzania’s Electric Supply Company Limited (TANESCO) for their contribution in the form of advice, access to data and insight into the organisation as well as Tanzania’s power sector. I especially want to thank Mr. K. R. Abdulla, Mr. S. Chilima, Mr. E. Lolubo, Mr. M. Katyega, Mr. M. E. Kingu, Mr. K. Gladstone and Mr. B. Msofe at TANESCO Head Quarters in Dar es Salaam. Further, I would like to express my gratitude to SWECO Energuide AB for granting me the time and opportunity to work on the thesis and for their financial support. Thanks also go to Leif Andersson and Rolf Ruritz for sharing their technical knowledge in the field. Moreover, I would like to thank Anders Hagwall at the Swedish International Development Cooperation Agency (Sida) and Mr. Charles Inyangete at Integrated Risk and Investment Services for their insightful advises and support in the initial phase of the thesis. Many thanks also go to my family for providing support and being patient. Finally, the author wishes to thank Lund’s University and especially Jan Holst, who initiated the work, but unfortunately is no longer with us, and her supervisor Ingela Elofsson at the Department of Industrial Management and Logistics.
1. INTRODUCTION 1
1.1 BACKGROUND AND PROBLEM 1
1.2 OBJECTIVE 2 1.3 TARGET AUDIENCE 2 2. METHODOLOGY 3 2.1 GENERAL APPROACH 3 2.2 RESEARCH STRATEGIES 3 2.3 RESEARCH METHODS 4 2.4 DATA ACQUISITION 5 2.5 AUTHENTICITY 7
2.6 PRACTICAL RESEARCH APPROACH 8
3. THEORETICAL FRAMEWORK 11
3.1 FINANCIAL ANALYSIS OF INVESTMENTS 11
3.2 BENEFITS OF A RISK ASSESSMENT 14
3.3 QUANTITATIVE RISK ANALYSIS 15
3.4 RISK MEASUREMENT AND RISK AVERSION 19
4. TANZANIA’S POWER SECTOR - OVERVIEW 21
4.1 THE UNITED REPUBLIC OF TANZANIA 21
4.2 PRESENT ENERGY SITUATION 21
4.3 TANZANIA ELECTRIC SUPPLY COMPANY LIMITED (TANESCO) 22
4.4 DEVELOPMENT IN THE ENERGY SECTOR 23
4.5 ENERGY RESOURCES 23
5. TANZANIA’S POWER SECTOR - EMPIRICS 27
5.1 HISTORIC ELECTRICITY CONSUMPTION AND GENERATION MIX 27
5.2 FUTURE DEMAND AND INVESTMENT OPTIONS 35
5.3 TANESCO’S FINANCIAL SITUATION 42
6. ANALYTICAL TOOLS 45
6.1 INTRODUCTION 45
6.2
T
FINANCIAL EXCEL MODEL 456.3 @RISK 4.5 FOR EXCEL 48
6.4 MODEL DELIMITATIONS 51
7. ANALYSIS AND RESULTS – EVALUATION OF RISK VARIABLES 53
7.1 IDENTIFICATION OF RISK VARIABLES 53
7.2 FUEL PRICES 53
7.3 HYDROLOGY 57
7.4 ELECTRICITY DEMAND 61
8. ANALYSIS AND RESULTS – FINANCIAL RISK ANALYSIS OF BASE CASE 63
8.1 DEFINITION OF THE BASE CASE 63
8.2 FINANCIAL RESULT 66
8.3 COST COVERING TARIFFS 69
8.4 SUMMARY 69
9. ANALYSIS AND RESULTS – STRESS ANALYSIS OF BASE CASE 71
9.1 HIGH OIL PRICES 71
9.2 RAPID ANNUAL GROWTH IN DEMAND 72
9.3 EXTENDED INVESTMENT PLAN 73
10.2 EVALUATION OF THE METHOD FOR QUANTITATIVE RISK ANALYSIS 77
10.3 EVALUATION OF SELECTION OF CASE 79
10.4 EVALUATION OF ANALYTICAL TOOLS 79
10.5 GENERAL CONTRIBUTION 80
10.6 OTHER FIELDS OF APPLICATION 80
11. REFLECTIONS ON THE CASE STUDY RESULT FOR TANESCO 81
11.1 IMPLICATIONS FOR TANESCO’S INVESTMENT PLANNING 81
11.2 LIMITATIONS OF THE FINANCIAL MODEL 82
11.3 REFLECTIONS ON FINANCING 82
12. BIBLIOGRAPHY 84
ADB Asian Development Bank
AGO Automotive Gas Oil
AREED African Rural Energy Enterprise Development
DCF Discounted Cash Flow
ESMAP Energy Sector Management Assistance Programme EWURA Energy and Water Utilities Regulatory Authority
FRP Financial Recovery Plan
GDP Gross Domestic Product
GJ Gigajoule
GoT Government of Tanzania
GWh Gigawatthours
HFO Heavy Fuel Oil
IDO Industrial Diesel Oil
IEA International Energy Agency
IMF International Monetary Fund
IPP Independent Power Producers
IPTL Independent Power Tanzania Limited
IRR Internal Rate of Return
kWh Kilowatt hours
LNG Liquefied Natural Gas
MEM Ministry of Energy and Minerals MW Megawatt
NBS Net Basin Supply
NBS National Bureau of Statistics
NPV Net Present Value
NSGRP National Strategy for Growth and Reduction of Poverty O&M Operating and Maintenance
PSMP Power System Master Plan
PV Present Value
TANESCO Tanzania Electric Supply Company Limited
TSH Tanzanian Shilling
UNDP United Nations Development Program
1. Introduction
This chapter provides the reader with the background and a problem description as well as the objective of the thesis and the overall approach to the problem. The chapter further delimitates the study and proposes anticipated target audience.
1.1
Background and Problem
The situation for infrastructure investment projects is often different in developing countries from what it is in an industrialised country. The local capital market is small and may be unable to provide long term credits. Investments are often seen as highly risky by foreign private investors. Reasons for this may be of political nature or be related to an uncertain market or the absence of a regulator. For this reason, support and guarantees from multilateral donors or bilateral donors may be required in order to obtain financing. This requires a careful analysis of the investment program to demonstrate that the proposed investment program is financially sustainable under varying assumptions, and represents the best overall economic value to the country.
When assessing an investment program, financial and economic analyses are important; the financial analysis in order to guarantee that the investment program is sustainable, i.e. that the new assets produce a revenue sufficient to cover the full operation and maintenance cost as well as capital costs; the economic analysis in order to verify that the investments makes good sense with regard to the national economy, for example contributing to economic growth and supporting the country’s poverty reduction strategy. The financial and economic analysis should also show that the best alternative has been chosen, i.e. avoiding too expensive and too risky investments.
Investments in the energy sector are associated with special risks such as uncertainty about hydrological variations, volatile oil prices and may also be associated with climate change effects and future costs of emitting greenhouse gases. These uncertainties contribute to high risks in energy sector investments. Moreover the fact that electricity is an irreversibly produced product makes the accuracy of the investment decision more essential1. Investment and investment appraisal in the energy sector worldwide are faced with a major problem; how to handle such uncertainties.
Many traditional methods of assessing investment programs are not very well equipped to handle risk. Risk analysis is usually applied in the form of sensitivity analysis or scenario development. Neither of these methods, which look at one uncertainty factor, or set of uncertainty factors at a time, provides a good picture of the combined risk. Enhanced methods for project appraisal are therefore essential to guarantee long term performance and profitability of the investment.2
During many years following independence, numerous African countries, including Tanzania, invested heavily in hydropower, which is very cheap to operate as long as there is enough water in the rivers. The risk of adverse hydrology and higher variability of rainfalls was not properly taken into account. Tanzania is such a country, which has run out of productive capacity several times. On these occasions, the country has realized how vulnerable the power system is to drought. To compensate for this the country is now investing more in thermal generation, both gas fired power plants fuelled by gas from own resources, and diesel fuelled power plants using imported fuel. This means an increased likelihood that the system will be able to satisfy the demand, although at a higher cost. Performing a risk analysis using Tanzania as a case study is therefore considered highly relevant.
1
Yang and Blyth (2007), p.3 2
In a development country, it is essential to make the best use of scarce investment resources, at the same time as uncertainty about future development is high. This master thesis shall demonstrate how quantitative risk analysis, based on probabilistic methods, combined with the traditional tool of net present value calculation, based on the discounted cash flow method, can assist decision makers in making the right decisions.
1.2
Objective
The purpose of the thesis is to develop a method which combines quantitative risk analysis with traditional methods for power sector investment appraisal. The method shall be demonstrated by creating a financial model and adapting it to a real case. The model shall be able to consider identified, inherent risk factors and their conceivable impact on the power system.
1.3
Target Audience
This thesis is targeted to students and professionals in the fields of engineering and management. Moreover, the results of the analysis are intended to demonstrate the possibility of applying risk analysis when assessing investment projects at TANESCO, which is also applicable to other power utilities. Finally, it is anticipated that the model developed as part of this thesis work and the method used could be developed into a useful tool for other decision makers such as borrowing governments and financial institutions.
2. Methodology
The chapter explains and defines the methodology used for conducting the research. The procedure of the thesis is linked to scientific frameworks, including research methods and strategies, methods for data acquisition and verification of the thesis’ authenticity
2.1
General Approach
In order to develop a method, which combines quantitative risk analysis with traditional methods for power sector investment appraisal, various research strategies and methods have been investigated. It is clear that neither an inductive nor a deductive approach is fully appropriate. The work will have to rely on combination of and interaction between both approaches. For example an inductive method is needed to define the distribution function for the identified risk variables, while a deductive approach produces the final model results. Therefore the general approach can be referred to as an abductive approach. This applies also to the development of the financial model. The practical approach to the research is further elaborated and illustrated in chapter 2.6.
2.2
Research Strategies
There are several research strategies to consider before conducting a research in order to fulfil the research’s purpose. Each strategy has its advantages and disadvantages depending on the type of problem to analyse, the control the researcher has over certain events and the research’s focus on historical, present or future occurrences. In the following, commonly used research strategies are described as well as selection of strategy for the thesis.
2.2.1 Description of Research Strategies3,4
Survey – A survey research comprises a wide and extensive coverage of data compiled and embraces
usually more than one case. The research is focusing on one single point in time. The survey strategy includes empirical research where required data is sought in the field. Generally multiple variables are examined to find related patterns.
Case Study – Case study research is characterised by its concentration on one research object, a single
case, in order to conduct an intensive and detailed survey. The aim is to illuminate the general facts while investigating particular facts. The research is concerned with the complexity and particular nature of the case. The study is focusing on relations and processes and their connection to each other.
Experiment – The purpose of en experimental research is to scrutinise empirical relations and
properties or to verify existing theories. The researcher holds a high level of control in terms of adjusting independent variables in order to observe certain effects on dependent variables. An experiment most commonly uses a quantitative research method based on observations and measurements. The experimental research focuses on the causality of situations.
Action Research – Action research involves a real problem or situation and is distinguished by its
practical implications with development of solution. The strategy emphasises involvement of members of an organisation. The research includes feedback of results.
3
Denscombe (1998), p. 12-71 4
Evaluation Research – An evaluation research focuses on evaluation of such occurrence as
organisational programs, policies, regulations or interventions. The research examines whether an initiative has achieved its anticipated goal.
2.2.2 Selection of Research Strategy
The purpose of this master thesis is to develop a method for power utility investment appraisal in development countries. In order to meet this objective, the case study research strategy has been selected as the most appropriate. The case to be studied will be investment in Tanzania’s power sector over a period of 20 years focussing on identification of inherent risk variables, not controlled by the power utility, and their effects on the financial viability of the investment. The actual case was selected for several reasons. Tanzania power system has for many years been based on mostly hydropower generation. Hydropower is cheap to operate but also very dependent on adequate rainfalls. When rainfalls become unreliable, the country has to compensate for this, and is now investing more in thermal generation, both gas fired power plants fuelled by gas from own resources, and diesel fuelled power plants using imported fuel. This means an increased likelihood that the system will be able to satisfy the demand, although at a higher cost. Therefore, performing a risk analysis, considering these uncertainties is considered relevant and appropriate in order to demonstrate the benefits of the method.
Various power sector expansion options and assumed investment levels for Tanzania’s future investment in the power sector will be assessed in the case study. In order to prepare a well founded investment plan, appropriate risk factors associated with the various investment alternatives will be considered. The investment choice can best be described as; how much should the utility invest, and how should the allocation be made between (i) hydro-power generation; (ii) thermal generation; and (iii) transmission and distribution system expansion.
2.3
Research Methods
Research methods can be distinguished between quantitative or qualitative research. These methods differentiate in general terms of the type of data gathered and the type of analysis of data performed. The diversification of the methods does however not only imply if the data is quantifiable or not. Other issues such as the extent of the research, the focus on a holistic or specific perspective, the involvement of the researcher etc., do differentiate the methods as well.
2.3.1 Description of Research Methods5, 6
Quantitative Research – The definition of a quantitative research is entailed with collection of
numerical data and exhibiting a view of relationship between theory and research as deductive. The method tends to be of a larger scale with a specific focus. The researcher conducting this type of study commonly takes a neutral position where the comprised data is already existing independent of the researcher.
Qualitative Research – A qualitative research is characterised of the words as central analytic tool
rather than numbers. The method has an inductive view of the relationship between theory and research, whereby the former is generated out of the latter7. Mainly the study is of a smaller scale with a holistic perspective i.e. contemplating the relations in their context. The researcher is regarded as the central tool while conducting the study.
5
Denscombe (1998), p. 203-207 6
Bryman and Bell (2007), p.28 7
2.3.2 Selection of Research Method
In order to demonstrate the advantages of incorporating risk variables in the traditional method of investment appraisal in the power sector, a quantitative research method has been chosen. The data used is numerical and existing from the Tanzanian power sector as well as analysed with statistical models. Further, two analytic tools, in form of a computer model and a software program, are used, generating quantifiable results. The research is deductive i.e. the defined method of risk assessment is tested on investment in Tanzania’s power sector in order to exhibit the benefits of the method.
2.4
Data Acquisition
Methods for collection of research data generally differ depending on which research strategy and method is applied on the study. Therefore this section will focus on sources and techniques which are applicable when conducting a quantitative case study. It should however be pointed out that for other research strategies similar sources of information in addition to others may be applied.
2.4.1 Sources of Information8,9
There are several sources of information to use during a research, whereof a few are described here. None of the sources has a complete advantage of the other and it is anticipated to use multiple sources since they can in fact be complementary.
Documentation – This type of information can take many forms, e.g. books, formal studies and
evaluation, proposals, letters, newspapers, internet etc. The most important use of documentation is to verify other sources of information. The use of documentation as a source of information is essential for all research strategies. Not only is it important for the researcher to be aware of already compiled studies of the research topic, it also identifies gaps in existing knowledge in the field. Documents have high accessibility, a broad coverage, they are exact in terms of names references and detail of events and they can be reviewed repeatedly. They may however be influenced by the author or have biased selectivity.
Archival Records – Examples of archival records are computer files and records containing service
records, organisational records, maps and charts, lists, survey data etc. This source is mostly highly relevant when performing quantitative analyses, since these require a large input of numerical data. Archival records have the same strengths and weaknesses as documentation sources although they may have a lower accessibility
Interviews – Interviews are also an essential and insightful source of case study information. They
make it possible to attain a deeper understanding for the subject, since the questions can be targeted to specific topics. In a case study the interviews rather appears to be guided conversations rather than structured queries. To make the interviews as efficient as possible, they can be structured with already formulated questions. This source does not require any specific technical equipment. There are several kinds of interview techniques depending on the information anticipated to obtain and depending on number of persons to be interviewed. The interview can be performed through personal meetings, telephone calls or by email correspondents. Interviews require certain skills from the researcher. The strengths of an interview include the focus on the case study topic although it is important to address the bias the responses may contain and the researchers affect on the answers.
8
Yin (2003), p. 85-96, 9
Direct Observations – Observational sources of information are often useful in providing additional
information about the topic being studied. It focuses on collecting data from real situations, which would have occurred whether the researcher’s presence or not. The direct observation is mostly associated with quantitative data and statistical analysis whereas the participative observation, described below, is of a qualitative nature. When using observation as a source of the observer’s perception plays an extensive role. It can be useful to have more than one observer to increase the reliability of a research. The advantages of this source of information are its ability to cover real time events and the context of them. Direct observations are however time consuming, selective and costly.
Participant Observations – In a participant observation the observer is no longer passive, instead it
plays a role within the case study situation. The technique has mostly been used in observations of cultural and social groups, but is also applicable in observations of organisations of groups. The risk with this kind of observation is the observer’s chance to manipulate events.
2.4.2 Principles of Data Collection10
When collecting data for a case study research, there are three principles which are favourable to follow in order to increase the reliability of the study.
Using Multiple Sources of Evidence – As mentioned earlier it is essential to use more than one source
of information. The use of multiple sources of information allows the researcher to address a wider range of issues. Further, using more than one source of information increases the reliability of the data.
Creating a Case Study Database – A practical tool for analysing different data is to set up a database
where the collected data is organised and documented. The data base should be distinguished from the actual case study report. The database shall be arranged in the manners that a secondary analysis could be performed without and reports by the original researcher. In this way a second investigator can review the evidence directly and not be restricted to the written report. The database increases the reliability of the case study.
Maintaining a Chain of Evidence – The principle of a chain of evidence is to allow the reader of the
report to follow the origin of the information compiled, ranging from the initial problem and purpose to the case studies conclusion. The steps should be traceable in either direction and incorporates also the organised database.
2.4.3 Utilised Sources of Information
The data collected for the analysis of this thesis derive from multiple sources of information. The main source has been documentation for both empirical data as well as the theoretical framework. The documentation includes TANESCO’s internal reports on the power system and reports on similar projects in other countries. Further, archival records have been widely used for the study, these concerns comprehensively the accessibility to TANESCO’s data files on generation, demand, and costs material. The author has also performed open interviews and personal correspondents with employees at TANESCO, in order to collect data. Finally, the author has used direct observational sources of information during her two years of consulting assignment at TANESCO working with related issues. The principles of data collection have been applied in the research work.
10
2.5
Authenticity
A vital part of an empirical research is to verify the authenticity of the data used and its sources of information. The relevance and correctness of the data collected is important, therefore the quality of the research should be tested. Concepts used as tools in order to determine the authenticity are outlined in the following.
2.5.1 Concepts for Authenticity11, 12
Validity – Validity concerns the amount of systematic errors during data collection and data analyses.
The concept of validity is the question whether the study really measures the indicators it intended to. Validity can be distinguished by internal and external validity. Internal validity refers to causal relation and whether they might have underlying influences not identified, whereas external validity concerns generalisations of a study result.
Reliability – The reliability of a research refers to the accuracy of the method. In a reliable research,
errors and biases are minimised. Reliability includes that measures should be stable over time, factors indicating the result should be coherent and the subjectivity in the researcher’s decision shall be diminished. In other terms, reliability means that if the case study were conducted all over by another researcher he or she will arrive at the same result. The principles of data collection described earlier in this chapter are used to achieve augmented reliability of a research.
Objectivity – Objectivity regards the transparency in the method of a research so that the researcher’s
personal biases intrude as little as possible in the process13.
2.5.2 Authenticity of the Thesis
The overall validity of the performed research in this thesis is high since the purpose was determined in the initial phase of the study. Subsequently, the collection and analysis of data is conducted in order to attain the anticipated goal of the study. Although the causal method of identifying risk variables might lead to a lower internal validity, since all risk variables could not possibly have been incorporated in this specific case study. A generalisation of the demonstrated method for risk assessment in investment project for other investments than in the power sector of Tanzania is essential in the thesis, but does however not include the result of the actual case study which is specific for the case analysed.
The data collected for the case study is historical data received from TANESCO’s internal archive and internal reports as well as a number of other similar studies. Yet, in many situations, the same data from different sources diverge significantly. Data has to the most possible extent been confirmed across a range of written sources and personal meetings. However, some assumptions made by the author have been unavoidable. The author has followed the three principles of data collection described earlier in order to increase the overall reliability and transparency of the research and therefore it should be possible for another investigator to conduct the same research and end up at the same result. It should however be addressed that the development of the Tanzanian power sector is progressing rapidly resulting in a low stability of data over time.
The objectivity of the thesis is considered to be high as a quantitative approach was chosen. Numerical empirics and results minimises the effects of subjection by the author. The author is however aware
11
Bryman and Bell (2007), p.162-165 12
Yin (2003), p. 33-39 13
that her experiences and actions may influence the identification of problem and the proposal for solution in the initial stage of the research. As it was necessary for the author to make some assumptions where data was ambiguous, as discussed above, this may be considered to have an affect on the thesis’ objectivity.
Any personal misunderstanding, interpreting of written sources or other errors and omissions are the responsibility of the author.
2.6
Practical Research Approach
The practical approach to conducting the research, starting with the problem identification up to the final results and conclusions is described in the following section. In the initial stage of the research, the problem of how to incorporate uncertainty into traditional financial investment appraisal of energy projects is identified and described. Subsequently, different methods to solve the problem are reviewed and the quantitative risk analysis approach is chosen as the most appropriate for solving the problem. As a first result, the objective of the thesis can be defined.
In order to meet the objective, a case study research strategy is chosen. The case to analyse, investments in Tanzania’s power sector, is proposed based on both the relevance of the case to attain the objectives of the thesis as well as on the author’s present location and sphere of interest. The objective and research method is presented to and fully supported by TANESCO.
The practical approach is illustrated in Figure 1, which describes the interrelationship between the different chapters of the thesis.
Relevant academic literature, reports and articles on financial analysis, and quantitative risk analysis are studied in order to define the theoretical framework as well as the appropriate methodology. The theoretical framework is presented in chapter 3.
Thereafter, the overall structure of the power system is investigated and empirical data for the case study collected. Data derives mainly from TANESCO system reports, data bases and similar studies. Three reports in particular form the basis for the technical as well as the financial empirical information, namely Tanzania Power System Master Plan, PSMP (2003) (update from 1999), East African Power Master Plan Study, EAPMP (2005) and TANESCO Financial Recovery Plan, FRP (2006). The studies are performed by TANESCO or, in the case of the EAPMP, based on information provided by TANESCO. Project reports, studies and similar research conducted by consultants; donor agencies etc. are also examined for supplementary information as well as to verify various sources. The empirical data and its sources are described in chapter 5.
The financial theoretical framework combined with system structure and the empirical data provides the basis for the development of the financial model. It is based on standard financial and technical concepts, adapted for the selected case and implemented as an Excel spreadsheet model. The second analytical tool used for the different analyses is the computer program @Risk, which can be integrated into the Excel program, which gives the financial model the ability to simulate the influence of a set of key variables. These tools are explained in chapter 6.
Three risk variables are identified from the empirical data and analysed following the suggested theoretical method for quantitative risk analysis. The key variables initially chosen are: (i) the annual contribution of hydro-power to the system; (ii) the world market price of oil; and (iii) the specific demand for electricity. The analytical tool @Risk is used to match the data for the risk variables to a suitable distribution function which then is applied in the Monte Carlo simulations performed in the financial model. In chapter 7 the three risk variables are evaluated.
Further, a base case for the analysis is defined based on the empirical data and general assumptions made. Base case data is incorporated in the financial model and the analysis is performed with the statistical variation of the risk variables taken into consideration. The result is presented in chapter 8. With the base case result available, alternative cases may be defined and analysed in an iterative fashion, including e.g. stressing the risk variables and reformulating the investment plan. This is described in chapter 9, where also some additional results are presented.
3. Theoretical
Framework
The theoretical framework, described in this chapter, forms the basis for the study. Initially the essential elements of traditional methods for financial analysis of investments are described. Thereafter, benefits of the extended method of quantifying risk are discussed. Finally the theoretical approach for this method is described. Moreover general probability theory is explained for an enhanced understanding of the theoretical problem analysis.
3.1
Financial Analysis of Investments
In order to assess the financial viability of an investment project from the viewpoint of the operating utility, a financial analysis of the project shall be carried out. A financial analysis is different from an economic analysis, which evaluates a project from the viewpoint of the national economy, however, the methodology for performing these kind of analyses are alike and therefore bibliography studied also include academic books on economic analysis.
The financial analysis is best performed by determining the project’s Net Present Value (NPV) using Discounted Cash Flow (DCF) analysis. This analysis involves essentially identification of all relevant cash flows of the project and discounting them to a certain point in time. The financial analysis can be made on a project level, by calculating the incremental cash flow associated with a certain project, or for the firm as a whole, determining what investment program will give the highest net present value. A calculation of the net present value and the internal rate of return (IRR) are commonly included in the analysis. The DCF approach is a widely used method when it comes to financial investment appraisal.
3.1.1 Discounted Cash Flow Method
A project’s revenues arise from selling a product or providing a service. In order to receive these revenues there are also several costs involved such as payment of investments, salaries, operating and maintenance costs etc. The remaining net earnings, after the payment of costs, constitute the yearly payoff. To calculate present value, the expected future payoffs should be discounted by the rate of return offered by comparable investment alternative14. This rate of return is often referred to as the discount rate or the opportunity cost of capital. It is similar to an interest rate adjusting for the time value of money. The present value (PV) of the cash flow is calculated by summing the discounted annual cash flow over the financial time period.
The statement of cash flow reports cash receipts and payments in the period of their occurrence, classified as to operation, investing, and financing activities. It also provides supplementary disclosures about non-cash investing and financing activities. Cash flow data also help explain changes in consecutive balance sheets and supplements the information provided by the income statement.15
3.1.2 Investment Profitability Measures
Net Present Value
There are several common criteria, which may be applied in assessing what investments a utility should undertake. In this work and in the model developed, the criteria will be the net present value,
14
Brealey and Myers (1996), p. 12 15
based on discounted cash flow. Using discounted cash flow to calculate net present values has several attractive characteristics for investment decisions: (i) it takes into account the time value of money, i.e. that a dollar today is worth more than a dollar tomorrow; (ii) it depends only on the forecasted cash flow from the proposed investment program and the chosen discount rate; and (iii) you can easily compare alternative investment programs by the difference in net present value. The criteria for accepting an investment is that the NPV is positive. When choosing between alternative (but mutually exclusive) investments, the investment with the highest NPV should be chosen. However, calculating an NPV requires a discount rate, which level has a considerable effect on the result. The method is described in detail below:
Calculating NPV – The net present value (NPV) is calculated by adding the project’s initial
investment to the present value of future revenues and costs. However, calculating an NPV requires a discount rate, which level has a considerable effect on the result.
Definition16: t t
r
C
r
C
r
C
C
NPV
)
1
(
...
)
1
(
1
2 2 1 0+
+
+
+
+
+
+
=
’ Where: 0C
= Cash Flow for time period 0 (usually a negative value, representing the investment), = Cash Flow for time period 1,1
C
r= rate of return/discount rate
Discount Rate17 – If the discount rate is stated in nominal terms, it is required to calculate the cash
flow in nominal terms as well. If the cash flow is in real terms, the nominal discount rate should be restated to real term using the following formula:
)
1
)(
1
(
1
+
r
nominal=
+
r
real+
α
i , Where:α
i=inflation rateSalvage Value18 – When an investment has not been fully utilized at the end of the modelling period,
meaning that it can be used to generate cash flow also beyond the final year, a salvage value or terminal value for that investment has to be determined. This is particularly important if there are large investments coming in at the end of the period, as otherwise their entire investment cost will be taken into account when calculating the net present value, although the contribution to cash flow is only for a few years. In the analysis performed here, the salvage value is calculated as the depreciated value of the investment, based on linear depreciation over the assumed economic lifetime of the investment. The salvage value, which represents an estimate of future cash flows, is treated as a positive cash flow at the end of the calculation period. This is applied to the net present value with the following calculation. t Salvage t t
r
C
r
C
r
C
r
C
C
NPV
)
1
(
)
1
(
...
)
1
(
1
2 2 1 0+
+
+
+
+
+
+
+
+
=
16Brealey and Myers (1996), p. 100 17
Brealey and Myers (1996), p. 117 18
Financing Decisions19 – In Brealey and Myers (1996), the importance of separating the investment
from the financing decision, is addressed. It is suggested to initially treat a project as is was equity financed, treating all cash outflows as coming from the stockholders and all cash inflows as going to them. After the NPV has been calculated, a separate analysis of financing can be undertaken.
Income Statements – The purpose of the cash flow analysis is to analyse and compare alternative
investments. Depreciation, which is an accounting entity and not associated with any cash flow, must be calculated in order to determine the corporate profit tax, which does affect cash flow, and the salvage values of various investments. For this purpose annual income statements need to be produced. However, these income statements should be seen only as a means for considering taxes as part of the cash flow analysis when comparing different investment programs, and are not calculated with an accuracy that makes it useful to an accountant.
Other Profitability measures20
The most popular alternatives to net present value are: (i) payback; (ii) return on book value; and (iii) internal rate of return. These methods have certain weaknesses:
• The payback method simply calculates how many years it takes before the sum of yearly cash flows match the initial investment. The investment with the shortest payback is preferred. The method, for example, does not take into account what happens after the payback period. It may prefer short term small investment, rather than the combination of investments that will maximize the value of the firm in the long term.
• The rate of return on book value compares average forecasted profits (after depreciation and taxes) with the average book value of the investment. If the return on book value is higher than the company’s average cost of capital, the investment can be accepted. A weakness of this method is, as for the simple payback period, that it does not take into account the time value of money, and, contrary to the payback period, tends to give too much weight to distant cash flows.
• The internal rate of return (IRR) method, which is a much more used and accepted tool, is defined as the discount rate at which the net present value is zero. If the IRR is higher than the company’s average cost of capital, the investment can be accepted. However, some difficulties in using the method properly are described in Brealey and Myers (1996). The most important for this analysis is that the IRR may be misleading when choosing from mutually exclusive projects, i.e. it may choose a smaller investment with a very high return, rather than a larger investment with an acceptable rate of return and a higher net present value (i.e. choosing to sell to the most profitable customers rather than trying to expand to as many customers as possible, which meet the set profitability criteria). Properly applied, however, it will give the same answer as the net present value.
3.1.3 Financial Modelling
Financial analysis can be performed in many ways; one way is by using a financial model that simulates the project company accounts. A financial model facilitates the analysis of the project in
19
Brealey and Myers (1996), p. 120 20
order to set up a financial structure that meets the requirements of the investor as well as forms a baseline plan for the risk assessment.
The financial analysis hence shows the pattern of cash flow, which the project parts provide over its financial lifetime. It also determines the ability to pay the debt service, operating and maintenance cost streams and brings out any cash flow deficits, which may arise. Ideally the net cash flow should be positive; otherwise other short-term loans have to be used to cover these deficits during the project operation. In evaluating the cash flow, all expenditures such as debt service, operation and maintenance, depreciation, income from sale of electricity are lumped into end of year payments.
3.2
Benefits of a Risk Assessment
The conventional DCF method as described above is the one most commonly used when assessing power investment projects, although it has some drawbacks. The DCF method major weakness is that the approach does not consider uncertainties in future returns, except in the choice of the discount factor. Every investment carries its own risks and it is important that they are known and evaluated. It is therefore not enough to only model the desired behaviour but also the unwanted behaviour. Assumptions on future energy demand, prices and generation output tend to be very hard to predict. In this context, a comprehensive risk assessment appears highly relevant for investment analysis in the power sector.
A risk analysis assesses how uncertainty in the forecast of input parameters affects the outcome of the project as well as gives an indication of the probability of a project failure. By including risks and uncertainties in the financial analysis, the project operators are given an enhanced foundation when choosing between different project alternatives and information on how the project may or may not affect the total business. For project financiers, other than the operating utility, the concept of risk in investment is important in determining terms and conditions of loans and in the structure of the financing plan to optimize the financing resources.
Cash flow uncertainties could be justified by changes of the discount rate with the capital asset pricing model (CAPM)21, however this will not incorporate the real fluctuations in input variables. Further, the CAPM method is reliant on an established and well functioning capital market, and therefore not as relevant for development countries.
Sensitivity analysis is another common approach to deal with uncertainties. The method involves identification of the variables that most influence the project’s net benefits and quantifies the extent of their influence, which consists of testing how percentage increases and decreases in uncertain variables affects the projects financial outputs such as the NPV. Typical variables in analysis of power utility investment programs are: (i) high and low demand growth; (ii) fuel costs; (iii) capital costs of projects; (iv) project timing; and (v) discount rate. This method does not consider the probability of different variations and hence neither the probability of different outcomes of the project. Further, variables usually do not change one at a time22.
Scenario analysis is another method, which tries to capture the interrelationship between uncertain variable. Scenario analysis looks at a limited number of combinations of variables. Further, neither of these methods identifies the correlation between uncertain variables i.e. how their variation is dependent on each other.
21
White, Sondhi, Fried (2003), p. 668 22
Monte Carlo simulation, which is the basis for the quantitative risk analysis, gives the added advantage of looking at a large number of combinations of variables, and of obtaining a full distribution of cash flows. The additional work associated with this approach is that, supplementary to the financial model, distribution functions for the risk variables need to be modelled and incorporated. The benefit of this approach, in addition to being able to handle combinations of variables, each with its specific probability distribution and relation to other variables, is that it may increase the understanding of the investment process and the risks involved.
Even more ambitious theoretical approaches for modelling investment decisions exist, using for example decision trees, as well mathematical tools as linear programming. However, this is out of the scope for this work. Most of the professional analyses made on power utility investments for African countries are still limited to sensitivity analysis and scenario analysis to cope with uncertainty and risk. Risk analysis based on Monte Carlo simulation as applied in this thesis, therefore adds to the tools currently applied, and is intended to provide new insight into utility investment planning.
3.3
Quantitative Risk Analysis
Quantitative risk analysis involves consideration of a range of possible values for key variables (either singly, or in combination), which then results in the derivation of a probability distribution of a project’s expected NPV or IRR or other relevant project measures23. In order to perform a quantitative risk analysis, a risk simulation program has been used, @Risk, which is further described in section 6.3.
3.3.1 Probability Theory
Certain knowledge of probability theory is required, in order to perform a risk analysis. General concepts and definitions are described below.
Probability Distribution
When quantifying risk variables, possible outcomes and probabilities of their occurrence shall be considered. The risk is thereafter summarised using a probability distribution. In Asian Development
Bank (2002) an example of creating a probability distribution is illustrated. In the example the number
of passenger bus trips on a specific route was evaluated. The number of passenger expected on a particular route per week is shown in Table 1.
Table 1: Number of bus trips and their probability of occurrence.
Number of bus trips ('000) 10 20 30 40 50 60 70 80 90
Probability of occurence 2,5% 5,0% 10,0% 20,0% 25,0% 20,0% 10,0% 5,0% 2,5% The probability density function, PDF bases on frequency of observation falling within particular class intervals, for the number of passenger, deriving from the data above is shown in Figure 2. The probability density function are most often also referred to the probability distribution function.
23
The PDF can be described as a statistical function that shows how the density of possible observations in a population is distributed. Definition24: A function with values
f(x), defined over the set of all real
numbers, is called a probability density function (PDF) of the continuous random variable X if and only if :
∫
=
≤
≤
b adx
x
f
b
X
a
P
(
)
(
)
Figure 2: Probability Density Function of Number of Bus Trips25 for any real constants a and b with
.
b
a
≤
There are many forms and types of probability distributions, each of which describes a range of possible values and their likelihood of occurrence.
Cumulative Distribution Function
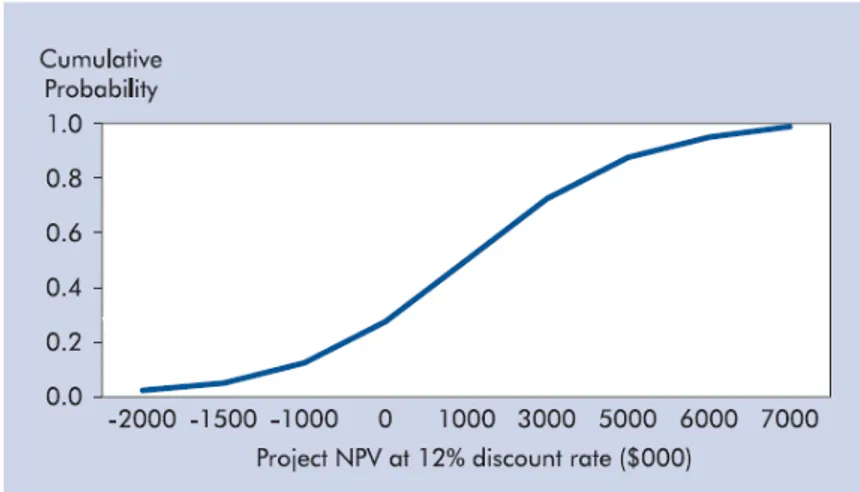
The cumulative distribution function, CDF, plots the probability that the actual outcome will be below a certain level. An example of a
cumulative distribution function is shown in Figure 3. It can be observed from the figure that the likelihood of the NPV to fall under zero is 30%.
Figure 3: Cumulative Probability Distribution of Number of Bus Trips26
24
Blom (1984), p.63 25
Asian Development Bank (2002), p.17 26
Distribution Function Parameters
Distribution parameters can include mean and standard deviation, whereby the mean is the average number of the measured variables and the standard deviation is the average difference between all observations and the mean.
There are different methods for calculating these parameters. @Risk uses the maximum likelihood estimator (MLEs). The MLEs are the parameters of that function that maximize the probability of obtaining the given data set.
Definition27: For any density distribution f(x,
θ
)with one parameterθ
and a corresponding set of sampled valuesx
i, the likelihood function as follows can be defined:) , ( ) ( 1
θ
θ
∏
= = n i i x f LTo find the MLE, L shall be maximized with respect to
θ
.0 =
θ
d dL ,and solved for
θ
.Fit Statistics
Fit statistics measure how good the distribution fits the input data and how confident you can be that the data was produced by the distribution functions. The smaller the value of these statistics, the better the fit. One fit statistic that @Risk makes use of is the Chi-squared Statistic. The Chi-squared statistic is the best known goodness-of-fit statistic28.
Definition: To calculate the Chi-squared statistic, the x-axis domain is broken up in several “bins”.
∑
=−
=
K i i i iE
E
N
1 2 2(
)
χ
where,K = the number of bins
i
N
= the observed number of samples in the ith bini
E
= the expected number of samples in the ith bin.A weakness of the Chi-squared statistic is that there are no clear guidelines for selecting the number and location of the bins.
27
Blom and Holmquist (1970), p.62 28
3.3.2 Evaluation of Risk Variables
The procedure of identifying and defining the risk variables of the project is explained in Asian
Development Bank (2002) 29 and Grey (1995)30. Detailed methods for different kind of “distribution
fitting” is described in Palisade (2005)31
Identifying Key Risk Variables
The key risk variables are the variables that have an unknown future outcome but are expected to affect the project return. Risk variables are defined as variables, of which the likelihoods of outcomes are known, based on historical data or forecast data and for which a probability distribution can be constructed. If distribution functions can not be estimated the variables are defined as uncertainties. Risk variables are most commonly variables over which the investing utility has no influence.
The method for sensitivity analysis as described earlier can also be used to determine which key variables the risk analysis should be based upon.
Assembling Data
After the key risk variables have been identified, data regarding each variable should be collected or estimated. If a historical data set exists, which shows the natural pattern of the variable in the past, the future expected probability distribution can be modelled. If no such data occurs, future expected values have to be estimated, although in this case the estimator should have some sense for in which range the variable is expected to fall.
It shall also be considered which underlying factor the specific risk variable is dependent of and correlated to. This is described more in detail further down.
Modelling Risk Variables
Well tried empirical methods exist for developing probability distributions32;
• Visual impact techniques, Identifies the frequency of value occurrence based on historical data.
• Structured questions to identify key points in a distribution, Identifies the median, quartiles, etc of the data set.
• The application of “smoothing” techniques in situation where a few real data point may be available.
Techniques applied to develop definitions and derivations of probability distributions for individual variables in most cases are likely to depend upon some subjective judgement by an appraisal team.33
29
Asian Development Bank (2002), p. 22 30
Grey (1995), ch. 3 31
Palisade (2005), ch. 6 32
Asian Development Bank (2002), p.22 33
Goodness of the Fit
If the distribution has been fitted to the sampled data, it is essential to evaluate the goodness of the fit. @Risk measures the deviation of the fitted distribution form the input data. The smaller the fit statistic is, the better the fit. The observed significance of the test is called the p-value of the fit and defines the deviation of the fitted distribution from the input data. The P-value is used as hypothesis test if a new set of samples drawn from the fitted distribution would generate the same fit statistic. The closer the P-value is to zero the less it can be trusted that the fitted distribution could generate the original data set. Conversely, when the P-value approaches 1, there is no basis to reject the hypothesis.
Correlation
Correlation between any of the risk variables shall be identified. Correlation is in statistics a measure of strength of the relationship between two variables. It may be used to predict one variable given the value of the other. For example a generated high value of one variable may imply a high value of another variable since these two are positive correlated, i.e. they are depending on the same fluctuation.
Applying the Distribution to the Financial Analysis
Once the result of the fit has been analysed, the fit can be used in the financial model as an input key variable.
3.3.3 Scenario Generator
Generating the underlying distribution and calculating the expected NPV through mathematical analysis is generally impossible. The analyst must rely on computer generated simulation.34 The following step will be the incorporation of the risk analysis in project financial analysis, were a scenario generator (e.g. software program such as @Risk), will be a helpful tool.
The scenario generator comprises models of the PDFs for the identified risk factors affecting the project. The output of the scenario generator is a large number of Monte Carlo paths of all modelled risk factors over the projects financial lifetime. The generator takes into account dependencies among the risk factors and dependencies over time i.e. correlation between the factors. The scenarios reproduce the behaviour of the risk factors to sufficiently account for any extreme individual and joint outcomes.
3.3.4 Output of Analysis
The output of the model will be a detailed quantitative analysis, which provides both statistical and visual information regarding the simulated paths and their distributions. The result will be the simulated distribution function of the project financial indicators and will assess and design the optimal investment program for the project.
3.4
Risk Measurement and Risk Aversion
Through quantitative risk analysis, the investment project’s risk exposure is quantified and measured by appropriate risk measures. These measures include not only the expected return of the project but also the variability of the return and the likelihood that the NPV or IRR falls out of an acceptable
34
range. Although, risk measurements themselves do not give any information on weather a certain project or project alternative should be implemented or not, since these decisions are strictly dependent on the decision makers risk aversion. Risk aversion is the amount of risk that the decision makers are prepared to accept as the trade off for a higher project return.
4.
Tanzania’s Power Sector - Overview
The objective of the following chapter is to provide the reader with an overall picture of Tanzania and its energy sector. It gives a brief introduction to Tanzania’s history, economy and politics. Further, the chapter presents the current energy situation and introduces Tanzania’s major power utility, TANESCO. Finally, Tanzania’s present energy resources are described.
4.1
The United Republic of Tanzania
Tanzania is located on the East coast of Africa just below the equator. Mainland Tanzania, previously Tanganyika, became independent in 1961 and was joined by the Zanzibar in 1964. Tanzania has a population of 38 million, growing at about 2% per year35. Tanzania bounds in the North to Kenya, Uganda, Burundi and Rwanda, in the West to Democratic Republic of Congo and Zambia, in the South to Malawi and Mozambique, and the whole eastern boarder consist of the Indian Ocean coast line. The major city is Dar es Salaam (Port of Peace) on the East coast with more than 3 million inhabitants. The country covers an area of about 945,000 square kilometres, i.e. double the size of Sweden. Tanzania is famous for its national parks, including the Ngorogoro crater and the Serengeti, Africa’s highest mountain Kilimanjaro, still with snow on the top, and the island of Zanzibar.
Tanzania’s economy is still very much reliant on agriculture, which sector contributes to about 50% of the gross domestic product (GDP) and provides employment for 85% of the population36. Other important sectors are manufacturing, mining and tourism. The economy has progressed steadily since the implementation of macroeconomic stabilization and structural reform in the mid-nineties. GDP is now growing at a rate of about 6-7% per year with inflation contained at less than 6% per year. With a per capita GDP of 319 USD, Tanzania ranks as a low income country37.
Tanzania is highly dependent on foreign aid, which accounts for about 40% of the state budget of about 5 billion USD. The budget is intended to support the implementation of the National Strategy for Poverty Eradication (the MKUKUTA in Swahili) and the achievement of the Millennium Development Goals38.
Under its first president, Julius Nyerere, Tanzania’s ruling party was Chama Cha Mapinduzi or the Revolutionary Party, and Tanzania was in fact a one party state. With political reforms undertaken in the nineties, moving away from the socialist economic policies of Nyerere, the constitution was amended and the multi-party system that exists today, although weak, was created. Market economy has been introduced and there is some progress with privatization.
4.2
Present Energy Situation
39Tanzania still relies heavily on wood fuels for cooking and heating. It is estimated that 93% of the total energy consumption in the country comes from different biomass energy resources such as fuel-wood and charcoal. The electricity sector is small; the average per capita consumption of electricity is
35
The World Bank, 10.08.2007 36
Tanzania’s National Website, 09.07.2007 37
The National Bureau of Statistics, 23.08.2007 38
International Monetary Fund, 23.08.2007 39
only about 75 kWh40 per year, compared to Sweden’s 17,000 kWh41 per capita and year. Electricity is also available only to a small part of the population.
Less then 11% of the population in Tanzania have access to electricity and at present, outside the major cities and towns, only the majority of regional headquarters, some district township and a limited number of villages are supplied with electricity, as can be seen in Figure 4.
Only 2% of rural households have access to grid electricity. The lack of basic modern energy services in most rural areas is perceived as being a bottleneck in social and economic development. In Tanzania’s poverty reduction strategy (the MKUKUTA)42, energy is considered as an important component. Increased proportion of the population having access to electricity is one of the main conditions to achieve the millennium goals.
Figure 4: Electricity Access in Tanzania
The demand for electricity in Tanzania is expected to grow at a rate exceeding 10% per year, which would require a heavy investment program in generation, transmission and distribution. In the state budget for 2007/2008, TANESCO’s investment needs, only in order to rehabilitate transmission and distribution lines, over a five-year period are indicated as USD 1 300 million43.
4.3
Tanzania Electric Supply Company Limited (TANESCO)
Tanzania’s major actor in the power sector is the Tanzania Electric Supply Company Limited (TANESCO), which was established in 1964 when the government bought all the shares of two private utilities. The company’s core business is the generation, transmission, distribution and sale of electricity to the mainland and bulk supply to the island of Zanzibar.
The parastatal power company is directed by a Board of Directors. TANESCO is overseen by and reporting to the Ministry of Energy and Minerals (MEM). As the electricity sector regulator EWURA, which was created in 2002, has become operational, it has taken over MEM’s role as power sector regulator, and is thus in charge of approving tariff increases put forward by TANESCO.
At present 98%44 of the country’s electricity supply is provided by TANESCO, who owns and operates the national grid and also owns the major hydro power plants.
40 TANESCO, 23.08.2007 41 Svenska Energimyndigheten, 23.08.2007 42 Tanzania, NSGRP (2005), p.14 43 TANESCO FRP (2006) 44