Map and explain a position in the PC
supply chain
Authors: Johan Dahlgren
Tobias Samuelsson
Supervisors: Bertil I Nilsson, Faculty of Engineering Peter Unelind, VP Operations, FlatFrog AB
Acknowledgement
This Master thesis was written during the spring of 2013 as the final part of our Master’s degree in mechanical engineering at Lund University, Faculty of Engineering. The thesis was performed at FlatFrog Laboratories AB, Lund Sweden with a focus on supply chain design and business development in the consumer electronics market. To participate and act in such leading edge, intense environment has been motivating, fun and most of all gained us valuable experience and new knowledge.
We would like to express our appreciation to our supervisors at FlatFrog. First of all thanks to Peter Unelind for valuable guidance, feedback and sharing of your experience. We would like to thank Jens-Henrik Ringsbo for important comments and giving us insight in this industry. Further, we would like to thank the department of Operations at FlatFrog for taking time to listen and answer our questions. Last but not least, we would like to express our gratitude to Bertil I Nilsson, our supervisor at Lund University, for your time, guidance and pointing us in the right direction.
We hope the reader enjoys the reading as much as we did enjoy the writing! Lund 2012-06-07
Johan Dahlgren
Abstract
Title
Map and explain a position in the PC supply chainAuthors
Johan Dahlgren Tobias SamuelssonSupervisors
Peter Unelind, VP Operations, FlatFrog Laboratories ABJens-Henrik Ringsbo, Sourcing Project Manager, FlatFrog Laboratories AB
Bertil I Nilsson, Adjunct Assistant Professor, Department of Industrial Management and Logistics, Faculty of Engineering, Lund University
Background
Supply chains in low margin, high innovation speed industries with strong customers generate a highly competitive environment. The conditions for such environment are continuously changing and put high demands on its actors.FlatFrog is a case company, which was founded in 2007 and develops a unique touch technology targeting a wide range of screens sizes and applications. External capital from Intel capital, among others, has enabled FlatFrog to aim for integrating their touch solution in the PC market. In order to be able to enter this low margin, highly competitive market, FlatFrog wants to analyze the alternative business models available, e.g. uses a licensing model or taking full product ownership and the risk of initial investments in terms of material and production facilities. The PC value chain and supply chain are tense and there is no space for decreasing economic margins in exchange for additional features. The result is highly competitive environment, which is extremely hard for new actors to enter. Hence, FlatFrog has an interest in investigating their initial position in the supply chain and which possible solutions there are in order to gain good profitability.
Purpose
The purpose of this thesis is to map and explain FlatFrog´s position in the PC touch supply chain and how it implies corresponding ways of making business and enter the market. By research create an understanding of the market, its actors and characteristics.Method
In this thesis, a combination of the system approach and the actors approach was used as scientific approach. The data was collected by interviews, observations, focus groups, a literature review and continuous market research. The analysis was approached by an inductive approach where real life observations, by participating in meetings and studies of the latest trends in the consumer electric market, has been adopted after suitable models and accepted research to create a trustworthy analysis.Conclusion
The choice of business model and supply chain set up not only should consider the characteristics of the specific company. It should also be based on the conditions of the market and the improvement of competition. The choice of model should always be challenged since these conditions continuously are changing. From a theoretical standpoint, a license model would be the optimal choice due to less risk and a fast market entrance. After increased insights and experience of the market and its supply chain it may not be realizable because of the characteristics of the market. Operational reality will always beat best theoretical strategy and a product owner model could even be a requirement to enter the market. Even if it not may result in short term profitability, future benefits generated by greater control could be enjoyed. Hence, it is difficult to determine the most optimal business model and supply chain set up for a specific company. It is in large extent dependent of the current status and agility of the market which will change over time.Keywords
Business Development, Supply Chain Mapping, Supply Chain EnablementTable of Content
ACKNOWLEDGEMENT ... I ABSTRACT ... III TABLE OF CONTENT ... V LIST OF FIGURES ... IX LIST OF TABLES ... XI LIST OF CHARTS ... XIII CONCEPT DESCRIPTION ... XV
1. INTRODUCTION ... 1
1.1 BACKGROUND ... 1
1.1.1 The PC Market ... 1
1.1.2 FlatFrog AB ... 2
1.1.3 Planar Scatter Detection ... 2
1.1.4 Windows 8 ... 3
1.2 PROBLEM DESCRIPTION ... 4
1.2.1 General ... 4
1.2.2 Touch ... 5
1.3 PURPOSE AND GOALS ... 5
1.4 FOCUS AND DELIMITATIONS ... 6
1.5 TARGET GROUP ... 6
1.6 STRUCTURE OF THESIS ... 6
1.7 ROLES ... 7
2. METHODOLOGY ... 9
2.1 RESEARCH METHODOLOGY ... 9
2.1.1 Level of Ambition ... 9
2.1.2 Object to Study ... 10
2.2 SCIENTIFIC APPROACH ... 10
2.2.1 Analytical Approach ... 10
2.2.2 System Approach ... 11
2.2.3 The Actors Approach ... 11
2.2.4 Used Approach ... 11
2.3 DATA COLLECTION ... 11
2.3.1 Interviews ... 12
2.3.3 Survey ... 12
2.3.4 Experiments ... 13
2.3.5 Focus Groups ... 13
2.3.6 Literature Review ... 13
2.3.7 Content Analysis ... 14
2.3.8 Market Research and Updates ... 14
2.3.9 Used Data Collection Methods ... 14
2.4 DATA TYPE ... 15
2.4.1 Primary and Secondary ... 15
2.4.2 Qualitative and Quantitative Data ... 15
2.4.3 Used Data Type ... 16
2.5 ANALYSIS APPROACH ... 16
2.5.1 Induction ... 16
2.5.2 Deduction ... 16
2.5.3 Abduction ... 16
2.5.4 Used Approach ... 17
2.6 CREDIBILITY ... 17
2.6.1 Validity ... 17
2.6.2 Reliability ... 17
2.6.3 Representativeness ... 18
2.6.4 Authors Role ... 18
2.7 SUMMARY ... 19
3. THEORETICAL FRAMEWORK ... 21
3.1 SUPPLY CHAIN MANAGEMENT ... 21
3.2 SUPPLY CHAIN MAPPING ... 22
3.2.1 Reason to Map ... 23
3.2.2 Characteristics of a Functional Mapping ... 23
3.2.3 Risk of Mapping ... 23
3.2.4 Symbolism ... 24
3.3 BUSINESS RELATIONSHIPS ... 26
3.3.1 Supply Chain Relationship ... 27
3.3.2 Vertical Integration ... 29
3.3.3 Outsourcing ... 30
3.3.4 Ownership of Material ... 31
3.3.5 Technology Licensing ... 32
3.4 BUSINESS MODELS ... 35
3.6 PORTER´S FIVE FORCES ... 37
4. EMPIRICAL FRAMEWORK ... 41
4.1 THE PC SUPPLY CHAIN ... 41
4.1.1 Original Equipment Manufacturer ... 42
4.1.2 Original Design Manufacturer ... 44
4.2 THE TOUCH SUPPLY CHAIN ... 46
4.2.1 Touch Module Integrator ... 46
4.2.2 ODM Touch Integration ... 47
4.2.3 Constraints and Issues of the Touch Supply Chain ... 48
4.3 PC SUPPLY CHAIN ACTORS AND STAKEHOLDERS ... 49
4.3.1 Quanta ... 49
4.3.2 Compal ... 50
4.3.3 Wistron ... 50
4.3.4 Pegatron ... 51
4.3.5 Intel – A Supply Chain Enabler ... 51
4.4 FLATFROG AB ... 53
4.4.1 Project PC ... 54
4.4.2 Business Model and Supply Chain ... 55
4.4.3 Manufacturing Partner Assessment ... 56
4.5 COMPANY STUDIES ... 59
4.5.1 The ARM Case ... 59
4.5.2 The Qualcomm Case ... 61
5. ANALYSIS ... 65
5.1 CHOICE OF ANALYZED MODELS ... 65
5.2 OEM LICENSING MODEL ... 65
5.2.1 SWOT -‐ Analysis ... 69
5.2.2 Porter´s Five Forces ... 72
5.2.3 Alternative Partner Selection ... 74
5.2.4 Relationships ... 75
5.2.5 Quantitative Analysis ... 76
5.3 PRODUCT OWNERSHIP ... 80
5.3.1 SWOT -‐ Analysis ... 82
5.3.2 Porter´s Five Forces ... 84
5.3.3 Mitigation Alternatives ... 86
5.3.4 Relationship Analysis ... 86
6. RESULT ... 93
7. DISCUSSION AND CONCLUSION ... 95
7.1 GOAL FULFILLMENT ... 95
7.1.1Evaluation of Research Method ... 96
7.2DISCUSSION ... 96
7.3 CONCLUSION ... 99
7.4 ACADEMIC CONTRIBUTION/RECOMMENDATION FOR FURTHER RESEARCH ... 99
LIST OF REFERENCES ... 101
LITERATURE ... 101
WEB PAGES ... 104
OTHER ... 107
List of Figures
FIGURE 1, PLANAR SCATTER DETECTION ... 3
FIGURE 2, WINDOWS 8 INTERFACE (WINDOWS, 2013) ... 3
FIGURE 3, THE GENERAL PC SUPPLY CHAIN ... 4
FIGURE 4, SUMMARY METHODOLOGY ... 20
FIGURE 5, THEORETICAL FRAMEWORK ... 21
FIGURE 6, THEODORE FARRIS II SUPPLY CHAIN MAPPING FRAMEWORK (THEODORE FARRIS, 2010) ... 24
FIGURE 7, HENKOW AND NORRMAN SUPPLY CHAIN MAPPING FRAMEWORK (HENKOW AND NORRMAN, 2011) ... 25
FIGURE 8, CHOSEN FRAMEWORK OF SUPPLY CHAIN MAPPING ... 26
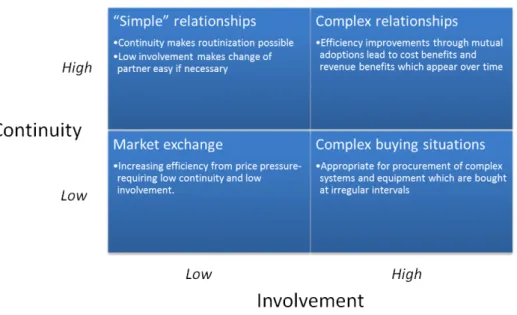
FIGURE 9, RELATIONSHIP MATRIX (GADDE AND HÅKANSSON, 2001) ... 27
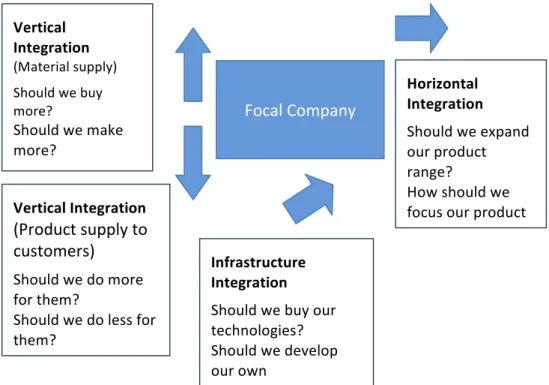
FIGURE 10, VERTICAL INTEGRATION (PHILPOTT ET AL. 2004) ... 29
FIGURE 11, OUTSOURCING BENEFITS (LACITY ET AL. 2008) ... 31
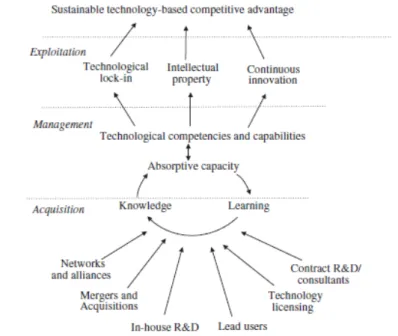
FIGURE 12, EXPLOITING TECHNOLOGY STRATEGY (DAVENPORT ET AL. 2003) ... 34
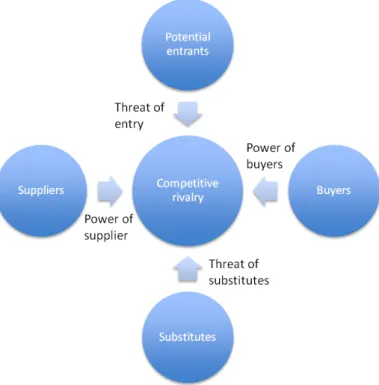
FIGURE 13, PORTER’S FIVE FORCES (JOHNSSON ET AL. 2009) ... 38
FIGURE 14, THE GENERAL PC SUPPLY CHAIN ... 41
FIGURE 15, TMI SUPPLY CHAIN POSITION ... 47
FIGURE 16, TOUCH MODULE VERTICAL INTEGRATION ... 48
FIGURE 17, INTEL AND MICROSOFT MARKET SHARE OF PROCESSORS AND OPERATING SYSTEMS (ISUPPLI RESEARCH, 2012) ... 53
FIGURE 18, ARM BUSINESS MODEL ... 60
FIGURE 19, QUALCOMM BUSINESS MODEL ... 62
FIGURE 20, SUPPLY CHAIN MAP LICENSE MODEL WITH ODM AS MANUFACTURING PARTNER ... 66
FIGURE 21, SWOT -‐ ANALYSIS LICENSE MODEL ... 69
FIGURE 22, MULTIPLE CUSTOMER REACH ... 71
FIGURE 23, SUPPLY CHAIN MAP LICENSE WITH TMI AS MANUFACTURING PARTNER ... 74
FIGURE 24, RELATIONSHIP MATRIX LICENSE MODEL ... 75
FIGURE 25, SUPPLY CHAIN MAP PRODUCT OWNERSHIP ... 80
FIGURE 26, SWOT -‐ ANALYSIS PRODUCT OWNERSHIP ... 82
FIGURE 27, SUPPLY CHAIN MAP PRODUCT OWNERSHIP WITH REVERSE CONSIGNMENT ... 86
FIGURE 28, RELATIONSHIP MATRIX PRODUCT OWNERSHIP ... 88
List of Tables
TABLE 1, SUMMARY OF METHODOLOGY ... 19
TABLE 2, THE OEM/ODM NOTEBOOK SPLIT ... 42
TABLE 3, MANUFACTURING PARTNER ASSESSMENT ... 57
TABLE 4, LICENSE MODEL DEFINITION ... 67
TABLE 5, BOM ANALYSIS LICENSE MODEL WITH ODM MANUFACTURING PARTNER ... 77
TABLE 6, BOM ANALYSIS LICENSE MODEL WITH TMI MANUFACTURING PARTNER ... 79
TABLE 7, PRODUCT OWNERSHIP MODEL DEFINITION ... 81
TABLE 8, BOM ANALYSIS PRODUCT OWNERSHIP ... 90
TABLE 9, BOM ANALYSIS PRODUCT OWNERSHIP WITH REVERSE CONSIGNMENT ... 91
TABLE 10, SUMMARY BENEFITS, QUALITATIVE ANALYSIS ... 93
TABLE 11, SUMMARY OEM TOUCH MODULE PRICE ... 93
List of Charts
CHART 1, NOTEBOOK SHIPMENT BY OEM 4Q2012 ... 43
CHART 2, AIO SHIPMENT BY OEM 2012 ... 43
CHART 3, NOTEBOOK SHIPMENT BY ODM 4Q2012 ... 45
CHART 4, AIO SHIPMENT BY ODM 2012 ... 45
CHART 5, WHO MAKES MONEY OUT OF PC; REVENUE AND GROSS PROFIT PER PC (GARDINER ET AL. 2012) ... 56
Concept Description
AIO All-In-One PC
ASSP Application Specific Standard Product, an integrated circuit that implements a specific purpose and is available by off-the-shelf components.
SCAN IC Application Specific Integrated Circuit, an integrated circuit (IC) customized for a specific use.
IP Intellectual Property
MOU Memorandum of understanding, a document describing a mutual agreement between two parties. It expresses that some interaction will occur between the two parties, used in cases where a legal commitment cannot be implied.
NRE Non-recurring engineering is the initial one-time occurring cost to research, develop, design and test a new product.
ODM Original design manufacturer refers to the platform designer and manufacturer of consumer electric devices.
OEM Original equipment manufacturer refers to brand PC vendor. No manufacturing capabilities, but puts its brand on the produced and sell to end customer.
PCT Projected capacitive touch or technology, the dominating touch technology on the market
PSD Planar Scatter Detection, Flat Frog’s optical-based in-glass touch technology
TMI Touch module integrator, offer touch modules, i.e. glass with touch components integrated/added
Wintel The Microsoft Corp and Intel Corp. alliance.
BOM Bill of material, the list of raw materials, components and their
1. Introduction
1.1 Background
1.1.1 The PC MarketThe personal computer (PC) market has during the last ten years experienced a great period of growth with the personal computer becoming a mandatory feature among the average consumer. Lately, competition has risen in the horizon as low-cost tablets are starting to reinvent the consumer computing (Gardiner et al. 2012). The entire consumer electronic market is currently converging various handheld electronic devices and computers, putting powerful and versatile mobile devices in the spotlight. Especially high-end smartphones and tablets are getting wider adoption among the average consumer. Consumer devices originally designed for a specific purpose are expanding and cover wider areas of use as supplementary features increase. The PC must add additional value on top of this, in order not to become irrelevant and lose market shares to the more innovation focused smartphone and tablet vendors (MarketLine, 2012 Tsai, 2013). PC vendors has stagnating in innovation, comparing a laptop and a mobile phone three years ago, the laptop looks almost the same while the phone is today a completely new device. Simultaneous, the PC vale chain and supply chain are tensed and there is no room for decreasing economic margins in exchange for additional features. The result is a highly competitive environment, which is extremely hard for new actors to enter.
Among many upcoming requirements, two major challenges are facing the conventional PCs to stay competitive in the new and tougher environment. First, to start compete with the nimbler handheld devices adoption to a group of new hardware features such as touch, NAND storage and higher resolution display must be done. Secondly, they need to get much more affordable. These two factors set requirements to keep cost drivers low in the PC supply chain and at the same time starting to add new features to stay competitive against tablets which contains a larger portion of commodity components (Gardiner et al. 2012).
The touch function has been one of the drivers in the convergence, but has now become a mandatory feature which consumers are not willing to pay substantially extra for. The PC supply chain is strained and for a new player, an entrance is more about offering a cost reductive alternative rather than presenting superior features. (Internal FlatFrog material, 2013)
1.1.2 FlatFrog AB
FlatFrog was founded in 2007 and develops a unique touch technology targeting a wide range of screens sizes and applications. FlatFrog’s technique is an optical solution which measures how the flow of light in the glass panel changes as an object touches it. The technology, called Planar Scatter Detection (PSD) enables a multiple touch solution which offers an extraordinary performance and is setting a new standard for optical in-glass technology. By using a large amount of standard components FlatFrog offers a simpler supply chain which means a lower cost for the OEM brand customer (www.flatfrog.com, 28-02-2013). In the spring of 2013, the company is the end of the sourcing process and will in the near future start to ramp up for large scale production (Internal FlatFrog material, 2013).
Until the summer of 2012 the focus of FlatFrog has been on larger touch screens targeting rather low volume, but high margin markets as interactive touch tables in offices, casinos etc. External capital from Intel capital, among others, has enabled FlatFrog to aim for integrating their touch solution in the PC market. In order to be able to enter this low margin, highly competitive market, FlatFrog wants to analyze the alternative business models available, e.g. uses a licensing model or taking full product ownership and the risk of initial investments in terms of material and production facilities. Hence, FlatFrog has an interest in investigating their initial position in the supply chain and which possible solutions there are in order to gain good profitability.
1.1.3 Planar Scatter Detection
FlatFrog’s touch technology is called Planar Scatter Detection (PSD) and differs from the dominating technology on the market, projected capacitive (PCT), in the way that it is an optical in-glass solution. The light is injected into the glass by multiple IR LEDs with an angle that creates total internal reflection within the glass. The light wave is disturbed when an object (e.g. finger or pen) touches the glass, see figure 1. The light is then scattered from the touch point but since only a small part of the light in the glass is scattered a multitude of touches may be present on a given line. The remaining light in the glass is detected at the edges of the glass by IR detectors placed alongside the LED’s. Very advanced algorithms are then calculating the positions of the touching objects using the detected and remaining light. Besides the lower cost due to simple and standardized components, the PSD technology also offers a greater performance in terms of pressure detection and multiple touch (www.flatfrog.com, 2013).
1.1.4 Windows 8
As touch becoming a mainstream feature among consumer electric devices, Microsoft has in the recent years started developing a reimagining of their operating system which resulted in the release of Windows 8 in October 2012 (Foley, 2012). Windows 8 is a completely re-invention of the operation system from the smallest chip to the interface. A PC with Windows 8 becomes a new kind of device; it handles touch from small to large screens with or without a keyboard and mouse (Larson-Green, 2011).
The introduction of Windows 8 creates an availability of software which really enables the touch function to make entrance in PC devices. This support for the hardware in terms of integrating touch has not existed before but gets access to the software Windows demand certain requirements. Among these requirements, there are certain which demands additional efforts from developing, design and manufacturing in order to fully utilize the touch function (Windows, 2013).
• Multi-touch support • Edge-to-edge glass solution
Figure 2, Windows 8 Interface (Windows, 2013)
These are both requirements which create opportunities for FlatFrog’s touch technology which supports both multi-touch and a more compressed mechanical solution.
1.2 Problem Description
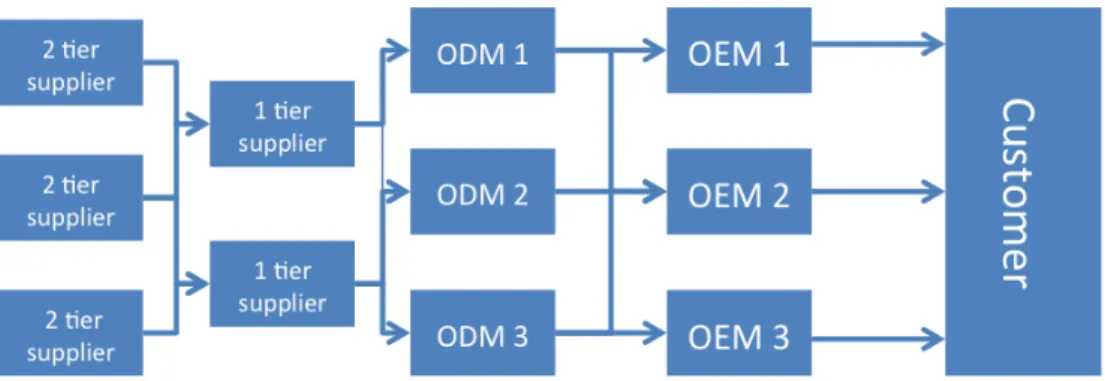
1.2.1 GeneralThe PC market is a high volume, low margin business with a supply chain that consists of a numerous tiers of suppliers and customers constantly trying to improve and cut cost which create a highly competitive environment. Already established actors prefer to play it safe and are generally hesitant to take any risk with new ventures offering innovate technologies. Hence, to reach the market it is more about offering a lower cost alternative than a superior feature. A general, simplified illustration of the material flow in the PC supply chain is illustrated in figure 3.
A number of upstream suppliers, in different tiers, deliver single components or assembled modules to the ODMs (original design manufacturer). Different suppliers could deliver the same type of component to the same ODM. The ODMs assembly and manufacture the computers according to the OEMs (original equipment manufacturer i.e. Dell, Toshiba and Lenovo etc.) specification. The OEMs does not have any own production and usually only sell the branded product to the customer.
Generally, an OEM has its production on several ODMs to create competitiveness among its suppliers as well as spreading the risk. Final delivery is to the consumer, i.e. the user of the computer, with the OEM brand on the device.
1.2.2 Touch
As a touch has become a common feature in personal computer, the touch supply chain has become a part of the PC supply chain. Currently, projected capacitive (PCT) is the touch technology which dominates the market, with 56 % in all market segments including smartphones, PC, healthcare and hospitality displays, as well as high-volume retail environments. In smartphones, tablets and PC, PCT is almost exclusively used (IDTechEX, 2012). But, PCT suppliers struggling to reach profitable cost, one of the main obstacles are the low yield in the manufacturing process. As FlatFrog’s technique consist of a larger amount of standardized components which enablers a simpler manufacturing process, they can offer a much higher yield than projected capacitive. Together with a lower cost and a higher performance, it creates a window of opportunity for FlatFrog to make an entrance on the market.
FlatFrog are interested in evaluating the supply chain set up and business model, including all possible alternatives. Questions as product ownership, protection of intellectual property (IP) and defending of margins will arise due to the highly competitive character of the market. Last, FlatFrog are in the end of a sourcing process for volume production and aspects as relationship and integration with business partners are interesting and important.
1.3 Purpose and Goals
The purpose of this thesis is, with a new technology, where to take position in the supply chain to be both competitive and make long term profit. The goal of the thesis is further divided into five sub goals:
A: Understand current business model and supply model and investigate if it is suitable for entering the market and generation of optimally long term profit. B: Evaluate alternative supply chain positions and connected business models. C: Examine what kinds of relationships, partners and networks those are attractive in different supply chain set ups.
D: Map and explain FlatFrog’s position in the PC touch supply chain and how it implies corresponding ways of making business and enter the market.
E: By research create an understanding of the market, its actors and characteristics.
1.4 Focus and Delimitations
This thesis will focus on the touch panel supply chain and will not consider the whole PC supply chain even if major parties in this environment will act in important roles and have to be mentioned. Further, the intention of this master thesis is not to develop a new business model or new ways of creating profitability. The focus is rather to analyze the current situation and from given circumstances evaluate alternative positions and if they affect the business model.
1.5 Target Group
This study primary addresses concerned parts at FlatFrog Laboratories AB, Lund. The secondary target groups are students on a higher level education with interest in purchasing, supply chain management and business development. Last, others who work or teach in the field of supply chain management or business development and strategy could use the dissertation as case study in problems related to market entrance and supply chain set up.
1.6 Structure of Thesis
The thesis is divided into seven chapters where every chapter has a brief introduction to provide understanding and simplify for the reader. Here follow the structure of the thesis:
Introduction
The first chapter presents the background and problem description of the thesis. Further, purpose and delimitations will be stated.Methodology
The methodology chapter presents different way of approach the research, analysis and how to collect data. Choice of approach and methods are presented, explained and motivated. A discussion of how to validate the result and create credibility is ending the chapter.Theoretical Framework
This chapter explains necessary theory and definitions to create an understanding for the reader. It will be followed of different concepts in how interpret the design of a supply chain. Last, suitable models for the analysis are presented.Empirical Framework
The empirical study with a holistic view of the PC market and its supply chain. This will narrow down to the touch supply chain, its constraints and characteristics and end up in FlatFrog´s current status and requirements for a market entrance.Analysis
The fifth chapter contains the analysis of theempirical study based on definitions and models stated in the theoretical framework. FlatFrog´s possibilities to enter the market with different business and supply chain set up will be explained and analyzed.
Result
The result from the analysis will briefly be presented to provide an overview of the implications of the different alternatives.Conclusion and Follow up
Last, the thesis is ended by the final conclusion based on the results from the analysis. Both qualitative and quantitative aspects will be considered and compared to the learning from the real world experience the authors gained at FlatFrog. The chapter will end with recommendation to further research within the area of the thesis.1.7 Roles
The distribution of roles has been evenly divided between the two authors. Johan has been slightly more responsible for the report and structure of the thesis while Tobias have had somewhat more responsibility for the collection and processing of data.
2. Methodology
This chapter presents, discuss and motivates the chosen methodology in the thesis. The level of ambition and approach of the scientific research will first be presented. A number of data collection methods followed by the characteristics of different data will be discussed. Further, reasoning concerning of both the approach of analysis and reliability of thesis will be performed. Last, a brief summary could be found of the used methodology.
2.1 Research Methodology
The choice of research methodology composes the basic foundation and direction of the thesis without in detail describing in what to be accomplished and how reach the objectives. Rather, it is an overall framework of how to approach and gain increased knowledge of the problem. The appropriateness of different research methodologies depends on the nature of the problem and the stated objectives (Höst et al, 2006). According to Höst et al. it is vital to determine an appropriate method or a combination of several in order to create a concrete plan for the continued survey.
• Descriptive - Main purpose of investigate “as-is”. Gain knowledge and describe the mechanism behind and how something is performed.
• Exploratory - Used when basic knowledge are known and aims for in depth, without explain, describe and understand the mechanism behind and how something is performed.
• Explanatory - Searching for cause-and-effect relationships and explanation of underlying causes of how things relates and react.
• Normative - Conducted when existing wide knowledge of the problem and its cause is known. The purpose is to find a solution to the identified problem.
2.1.1 Level of Ambition
The research will start in a descriptive level as mapping and investigate of the current situation will be conducted as the first step. Further, the study will enter the level of exploratory as the basic understanding is created and deeper analysis will be carried out to understand the logic behind the system.
Lastly, the study will end in the explanatory phase as causes and roots will be analyzed to understand the relationships and incentives in the PC supply chain in order to able to analyze and compare different models.
2.1.2 Object to Study
This thesis will approach the object by performing a case study at the company. A case study focuses on a certain phenomena with purpose to provide a depth description of events, relationships, experiences or processes of a specific situation (Denscombe, 1998). Hence, the case study is a method with a narrow spectrum which allowing a detailed observation of the object or event. The detail research methodology can create opportunities to get more unique and valuable information then with other approaches (Denscombe, 1998).
The complexity of relations and processes requires a deep analysis to understand how these are connected and affects each other. Case study can offer a holistic view to solve the complexity (Denscombe, 1998). Further, it is equally important to understand the process behind the results, as it is to understand the results. Case study is a reality research and it is not based on an artificial research situation where the researcher can control variables (Denscombe, 1998).
In a case study several data collection methodologies can be used and the scientist is encouraged to use a range of methodologies. Observations, interviews and document studies are some examples that can be used. A case study is, by the researcher, chosen situation and it is crucial that this choice is made consciously and carefully considered. The first aspect is that the choice is based from known attribute and is not random as in ordinary research. The second aspect is that the case is selected first and a literature research is based on the case (Denscombe, 1998).
2.2 Scientific Approach
A paradigm is the general theoretical assumptions, laws and techniques which are commonly accepted in a certain scientific field. It concerns the researcher’s view of the reality, view of science, the ideal of science and ethics (Nilsson, 2013).
A methodological framework guarantee that no specific approach is taken for granted and that it will be discussed and evaluated from time to another. Such framework is prejudiced by both the characteristics of the subject of research as well as the researcher’s view of reality (Gammelgaard, 2004). According to Arbnor and Bjerke (2009) there are three existing assumptions of reality.
2.2.1 Analytical Approach
The analytical approach is a logical view based on objective and subjective facts. Objective facts are unquestionable statements as a certain person age or her address whereas subjective facts are true opinions. These facts are challenged by hypothesis and to be either falsified or verified parts (Arbnor, Bjerke, 2009).
Logic and mathematical methods has a central place in the analytical approach and is used to find cause and affect relationships. Result from such methods ends into logical models and valid facts which not is a subject of change. If the research is divided into several parts the result then is the sum of all independent parts (Arbnor, Bjerke, 2009). In order not to affect the research object, the researcher must stay outside the object and avoiding disfigures the reality (Gammelgaard, 2004).
2.2.2 System Approach
Unlikely the analytical approach, the system approach doesn´t fracture the reality into different parts. Instead, the world must be seen as a system consisting of mutually dependent components. This system has parts, links goals and feedback functions which correlate to each other. The researcher should to stay close to the research object trying to map relations, find drivers and obstacles (Gammelgaard, 2004). The result ends up in finding relations, synergy effects and general way of classifying systems (Nilsson, 2013).
2.2.3 The Actors Approach
The actors approach is based on various social constructions and the unit of analysis is the people and their interaction. The reality is not objective but rather seen as a construction which means that knowledge depends on the researcher’s view of reality. Qualitative methods are preferred where the researcher are inside the process searching for relations between different parties’ interpretations. The approach results in qualitative aspects such as understanding and interpretation how things connect and affect each other (Gammelgaard, 2004).
2.2.4 Used Approach
The used approach in this study will be a combination of the system approach and the actors approach, see table in chapter 2.7. The investigated system involves actors which clearly correlate and affect each other; the objectives are to map relationships and finding synergy effects. Further, the researchers are acting within the system and the unit of analysis is the actors in the PC supply chain. Much of the analysis is built on the researchers view and knowledge of different parties’ incentives, incentives which not could be taken for certain as the risk of hidden information and action exists.
2.3 Data Collection
There exist several techniques to collect raw data. Different types of methods are suited for different research approaches and type of information that are requested (Höst et al, 2008). Using several data collection methods will create trustworthy data and led to increased validation of the study. Last, to create a variety of data it
is vital to use several methods, suitable for different kinds of information. To increase the validity the most common methods will briefly be described followed by a discussion of selected and used methods.
2.3.1 Interviews
An interview is a systematic questioning between the interviewer and the object of the interview (Höst et al. 2006). Personal meeting the two parts are the most common format, but it exists a variety of format to use in an interview. Selection of interview population is depending of the interview objectives (Höst et al. 2006). A representative interview will focus on random selection and a qualitative interview on stratification. There are three different levels of structure in interviews: unstructured, semi-structured and structured (Höst et al. 2006). The conversation in an unstructured interview is open with an interview guide of question areas that is interesting for the researcher (Höst et al. 2006). The goal with an open conversation is to reveal underlying beliefs and experiences. The opposite of unstructured interviews is the structured interviews. A structured interview is basically like a verbal survey, where all questions are clearly formulated in same order for each responder (Höst et al. 2006). A semi-structured interview is the intermediate between structure and unstructured interviews. It is planned with questions on different structure levels. The essential in a semi-structured interview is that if a structured question has been asked the interview object often has the chance to develop the answer (Höst et al. 2006).
2.3.2 Observations
If the researcher wants to study a specific phenomena or event, direct observations could be applied (Höst et al. 2006). Methods used to gather data in observation situations are human senses and technical tools that fit different situations. The observer can have different approach towards the observer role, either active or passive (Höst et al. 2006). The awareness of being observed is also an important aspect to consider (Höst et al. 2006). Either the observed has high or low awareness of being observed. According to Höst et al. (2006) these aspects will be combined into four different roles for the observer: observing participation, fully participation, participating observer and complete observer.
2.3.3 Survey
Survey is a questionnaire that aims to gather opinions and data from a wide range of a population (Höst et al. 2006). A survey consists of fixed questions often with a set response alternatives. The distribution of a survey can be made through postal survey, group survey, survey to visitor, computer survey and survey for the interested (Höst et al. 2006).
It is important to have knowledge of the research population and the selection of the population when analysis and generalisation of the result is made (Höst et al. 2006). The result in a survey is highly depending on the response rate, but the researcher should not affect the outcome of the survey by selection a new population for the research (Höst et al. 2006). Instead reward could be used if the response to the survey to increase the response rate. Survey is a quantitative data research method, but it could be used to cover complex qualitative questions if some adjustments are made (Höst et al. 2006). For example visual analogue scale could be used to determine fillings, opinions and attitudes.
2.3.4 Experiments
Experiments are to find causation and explanations of certain phenomena’s and the mechanism behind them (Höst et al. 2006). For example, investigation and comparison of technical solutions of a problem could be approached by experiment. The environment is set while the parameters that are investigated can be changed. When the setup for an experiment is set, it should not be changed during the experiment due to avoid affect the outcome and the result (Höst et al. 2006). The more parameters to examine, the more combination of parameters will be possible and the extension of the experiments will increase rapidly. A solution to this is to use systematic experiment method (Höst et al. 2006). Experiments are a quantitative research method (Höst et al. 2006). But it could be supplemented with a qualitative research, for example if there are people that have been examined, the question could be how they have experienced the treatment (Höst et al. 2006).
2.3.5 Focus Groups
Focus group is a group of people with experience in a shared subject forms a group together with a moderator. The aim with the focus group is that it should be an inspiring environment and take advantages of everyone opinions and ideas (Denscombe, 1996). According to Denscombe (1996) there are three critical characteristics for a focus group: the meeting - should focus on the subject and the experience of the participants, the interaction in the group - an important tool to utilize the knowledge, and the moderator’s role -facilitate the group and the interactions. If benefit from focus groups fully potential should be obtained, must the group create ethics, confidence and trust in each other (Denscombe, 1996).
2.3.6 Literature Review
A thorough literature review is the foundation of trustworthy scientific methodology. By review what is written about the research subject the thesis got a base in known learning’s and avoids the risk of overlook important knowledge in the area. There is often a large number of different opinions and interpretation
about definitions, results and development in the research area. Hence, the literature provides an overall perception of present state about subject of the thesis (Höst et al. 2006).
A literature review is an iterative process where different activities repeat itself as determine key words, search, evaluation and compilation of material. Initially, the purpose of the review is for the researcher to create and build wide understanding and knowledge of the subject. Further, the focus is narrowed down and the study could be focused on literature of more specific character. During the process it is important to declare used sources so independent user can understand, investigate and further research in the area. As the result is presented, it is valuable to return to theory and compare the findings with conclusions of others (Höst et al. 2006).
2.3.7 Content Analysis
It is important to point that even though content analysis is defined as a type of observation, it also could be seen as a separate data collection approach.
The process of content analysis consists of reviewing the content of documents, interviews, websites and archival records. The review results in more structure and comprehensive resume of information over a wider time period. Typical difficulties to arise during the content analysis are the collection and finding of data as well as the independency of the researcher when selection of sources as scepticisms are important when reviewing information from the past (Frankel et al. 2005).
2.3.8 Market Research and Updates
As the authors have been a part of the investigated organization and contribute to the daily work, some of these actions have contributed to the data collection. As FlatFrog operates in a high level technological and front edge market it is important to continuously be aware of market changes and updates. This has been a permanent activity during the period of the thesis and has contributed to the data collection in terms of market knowledge and information of different actors on the market. This data has mainly been collected from newsletter and updates from trustable news bureaus and reports from analyst firms.
2.3.9 Used Data Collection Methods
The used data collection methods in this thesis were interviews, observations, focus groups, literature review and market research and updates. The interviews were conducted by unstructured to semi-structured interviews where most occasions tended to be like discussions with a couple of major subjects. Such interviews were used during the whole thesis and created great understanding and gave valuable feedback. Observations were one of the major data collection methods and were
conducted by participation in internal meetings, conference calls and external supplier meetings. Through the process of developing supply chain maps, focus groups were used. It was approached by an iterative method were the maps initially were discussed with different employees within the unit of operations, feedback was received and the cycle was repeated. A literature review was performed in the initial stage and was employed to create a theoretical foundation and finding appropriate tools for evaluation. The last data collection was market research and updates. Via reading analytical reports, scanning the news feed and deliver weekly market updates at FlatFrog this method served as a valuable source for creating an understanding of the PC market and its supply chain.
2.4 Data Type
Collected data could be of different character and should be approach in altered ways. In this part the nature of different data will be described.
2.4.1 Primary and Secondary
Primary sources are original, none-processed or filtered information. Usually, they are first presented material such as results from an experiment, a person´s original opinion or sharing of new knowledge. Examples of primary sources are journal articles published in peer-reviewed publications, newspaper articles written, patents, interviews and observations or actions from meetings (Maryland University, 2012).
Secondary sources are not classified as evidence as they are published after observation, evaluation and gained perception. Because of this character they are harder to define than primary sources and a secondary source could likewise be a primary, all about the context it is seen in. Examples of secondary sources are commentaries, criticism, journal articles (depending on the disciple can be primary), textbooks and in some cases interviews (Maryland University, 2012).
2.4.2 Qualitative and Quantitative Data
The collected data could either be of qualitative or quantitative nature. Qualitative data are characterized by their high level of concreteness and could be counted or classified as numbers, amount, weight and color etc. This kind of data could be systematically analyzed by statistical tools and methods (Höst et al. 2006).
Quantitative data is more of the descriptive character and often contains a high level of details. This data could be words, mappings or a description of a certain process. It requires categorizing and sorting methods in the analysis are often combined with a human judgement (Höst et al. 2006).
Logistics research is often dominated by quantitative methods whereas qualitative aspects often are overlooked. To obtain a high level advanced research it is necessary to combine both quantitative and qualitative data which provide wider insights in many management research problems. If the objective is to gain knowledge of the problem and its nature then this need to be done in the most valid approach which is achievable (Mangan et al. 2004).
2.4.3 Used Data Type
In this thesis all kinds of the above described data collected and used. Primary data was used mainly used in terms of observations and interviews. Secondary data was gathered through market research and reading of analytical reports. To reach a high level of research, both qualitative and quantitative data were used. Qualitative data were characterised by financial information such as cost of material and forecasts. Last, quantitative data included description of the supply chain and understanding of the flows in the PC market as well as description of the incentives and objectives behind the FlatFrog strategy.
2.5 Analysis Approach
Before starting the data collection one must be aware of how to approach and interpret the gathered information. In this part, the two most common approaches, induction and deduction will briefly be described. Last, a combination of those, which not are as equally common, called abduction, is explained.
2.5.1 Induction
An inductive approach has its foundation in real life observations and is then generalized according to theoretical framework or models. Regularities and patterns are interpreted from the gathered data which could be adapted according to suitable theory. This is a usual approach when doing research in an area where little are written about and there exist no given theory of where to build the research from (Nilsson, 2013).
2.5.2 Deduction
A deductive approach starts with the researcher who constructs a hypothesis based on accepted knowledge and assumptions. Empirical consequences are derived from the hypothesis and compared to the empirical data resulted from observation and experiments. From the comparison the conclusion, whether the hypothesis could be rejected or proved, are drawn (Johansson, 2012).
2.5.3 Abduction
Last, there is the least common approach which is a combination of induction and deduction, called abduction. In practical research a study could initial perform a
number of unstructured interviews to create a foundation of which a model or a hypothesis then is constructed from. The model is then used in a second phase, a more structured interview session which aim for reject or prove the assumed hypothesis (Nilsson, 2013).
2.5.4 Used Approach
An inductive approach has been used thorough the whole study. Since the PC market currently is the leading edge in supply chain construction and logistics it has been vital to initially create an understanding of how different actors interact and influence each other. There is very little literature directly related to the configuration of a supply chain when entering the market with a company as FlatFrog’sconditions. Hence, after creating a deeper understanding of the PC market, suitable literature has been collected and put together to a framework which aligns the purposes of the thesis.
2.6 Credibility
The credibility of the thesis and validation of results could be interpreted in several different ways, the conclusions could be well reinforced, the study addresses the pronounced purposes and that the conclusions are general. Höst et al. suggests three different categories of how to address and assure the validation of the study.
2.6.1 Validity
The concept of validity concerns how trustworthy and valid the conclusions generated from the research are (Bryman, 2008). It is related to the connection of what the purpose of the study is and what one actually measures. To increase the validity o the study, triangulation could be used which means to approach the study which more than one method (Höst et al. 2006). In this thesis this will be conducted by using methodical triangulation. With the purpose of increase the validity of the study, data will be collected and compared in different ways (i.e. qualitative and quantitative) and contribute to approach the study from different perspectives. Hence, the results could be verified or questioned by comparing results from different methods (Denscombe, 1998).
2.6.2 Reliability
Reliability is a measure of whether the study is repeatable or not. It is often used when to interpret if a measure is stable and consistent or not (Bryman, 2008). To obtain satisfying reliability the researcher must be accurate in the documentation of the data collection and analysis to create an understanding of the used method (Höst et al. 2006).
2.6.3 Representativeness
Representativeness concerns the question if the results are specific for the certain circumstances where the study has been conducted of if it could be transferred to a generalized environment. A factor which concerns the level of the representativeness is the drop-out from the selection of samples. If the drop-out is too large, then the result may not reflect the whole population and the representativeness decreases. To increase the representativeness it is important with a comprehensive and thorough description of the background and context of the study (Höst et al. 2006).
2.6.4 Authors Role
In this thesis the authors’ role will be within the system and organization where the research is performed. The authors will be located at FlatFrog AB in Lund and will both doing research and data collection to execute the thesis but also interact and work within the organization. It is most likely that the authors will affect the system, and reversed, be affected of the system. To avoid this to impact the validation of the study, the authors are conscious of the situation and will act in an objective manner as possible. During the project continuous feedback has been received from the organization. This has been characterized of both discussions with the employees as well as focus groups where mappings and descriptions has been tested.
2.7 Summary
To summarize and visualize the choice of the used methodology this is finally presented in table 1.
Table 1, Summary of methodology
Used methods
Scientific approach: Analytical X
System X
Actor
Data collection: Interviews X
Observations X Survey Experiments Focus groups X Literature review X Content analysis Market research X
Data Type: Primary X
Secondary X
Qualitative X
Quantitative X
Analysis approach: Induction X
Deduction
Abduction
The purpose of the table is to create an overview for the reader of the used methodology and approaches. It will further increase the reliability as comparison between existing and used approaches could be performed.
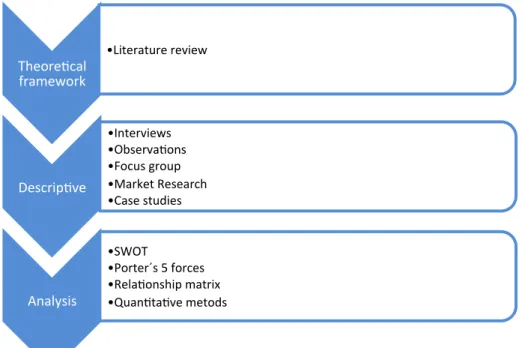
A summary of how the method has been used could be seen in figure 4. First, a theoretical framework has been developed by a thorough literature review. The framework has worked as a foundation when the data collection was performed which ended up in a descriptive empiric of the general PC market and its supply chain. Last, these two parts where combined to a analysis where both qualitative and quantitative approaches were conducted.
Theorefcal framework • Literature review Descripfve • Interviews • Observafons • Focus group • Market Research • Case studies Analysis • SWOT • Porter´s 5 forces • Relafonship matrix • Quanftafve metods
3. Theoretical Framework
In this chapter theory and models for this thesis will be presented. The purpose with the chapter is to create a broad and theoretical foundation and then narrow it down to a detail level with match the objectives of this thesis. Focus will be on the area of supply chain management, development of relationships and development of business model in companies with focus on intellectual property. The chapter starts with definition of concept and important theories to create a theoretical foundation. Second, suitable models analyzing of problems are described and motivated.
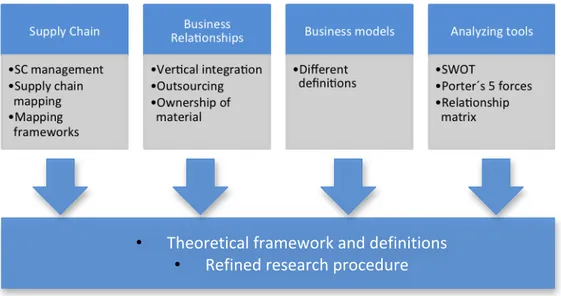
A summary of the theoretical framework is illustrated in figure 5. The framework is based on four main areas consisting of Supply Chain, Business Relationships, Business Models and Analyzing tools. Within each area one or a number of different aspects has been described. It results in a foundation of theory and definitions which the empirics has been based on and a refined research procedure.
3.1 Supply Chain Management
The term supply chain management first occurred in the literature almost thirty years ago and has thereafter had numerous of different definitions. Academics, practitioners and professional organizations have all offered a number of different alternatives (Gibson et al. 2005). To avoid obscurity and misunderstanding it is fundamental for this thesis to define an agreed definition of supply chain/supply chain management.
•
Theoretical framework and definitions
•
Refined research procedure
Many use the term supply chain or supply chain management as a synonym for logistics or for logistics which includes suppliers and customers. Others view the terms as common name for purchasing or operations, in combination of logistics. What is important to point is that supply chain not is a chain or a combination of activities and businesses, nor a network of business and relationships. Supply chain offers the prospect of capture the full potential of external and internal company integration and management (Lambert, 2008).
The council of supply chain management professionals (CSMP) has continuously changed and evolved this definition to fit the needs of the growing global supply chain and gives an exhausting definition of supply chain management.
“Supply chain management encompasses the planning and management of all activities involved in sourcing and procurement, conversion, and all logistics management activities. Importantly, it also includes coordination and collaboration with channel partners, which can be suppliers, intermediaries, third party service providers, and customers. In essence, supply chain management integrates supply and demand management within and across companies.” (CSMP, Definition of SCM, 2013).
Mentzer et al. (2001) defines supply chain as “a set of three or more entities (organizations or individuals) directly involved in the upstream and downstream flows of products, services, finances, and/or information from a source to a customer”.
Since this thesis will consider and position a numerous of players based on the material, information and financial flow in the supply chain, Mentzer´s definition from 2001 is decided to be the common agreed definition of supply chain hereinafter.
3.2 Supply Chain Mapping
In today´s global environment with a lot of different suppliers and customers it could be difficult to get an overview and understanding of one firms supply chain. Therefore supply chain mapping could be a useful tool to manage this problem. One problem with using supply chain mapping is the lack of a universal set of mapping conventions (Gardner and Cooper, 2003). The primary objective with mapping the supply chain is to show material flow, information flow, financial flow and relationships between companies. The higher number of different flows that should be visualized, the more complexity will be added to the mapping process. Lastly, there are two major categories of supply chain mapping; the describing, “what is” or prescriptive “what can be” (Gardner and Cooper, 2003).
3.2.1 Reason to Map
According to Gardner and Copper (2003) are there ten common reasons to map a supply chain:
• To link the corporate strategy to the supply chain strategy • Cataloguing and distribution key information for survival in a
dynamic environment.
• Create a base for redesign or modification.
• Map the current channel dynamics and show competitive positioning, future importance, power and relative size.
• Define the perspective of the supply chain integration effort. • Get a common understanding of the supply chain in the
organization.
• Communication tool in the organization and other parts of the supply chain.
• Clear view of supply chains progress and evaluate the progress in different steps.
• Entrances of new individuals or ventures could easily be positioned within the supply chain.
• Well-documented supply chain can lead to improvement of the supply chain management procedure.
3.2.2 Characteristics of a Functional Mapping
There are three main reasons that characterize a suitable mapping, which are interpretable, recognizable and in an easy-to-disseminate format. Interpretable of the map will prevent misunderstandings and all employees can interpret the map without any explanations. Therefore it is crucial that right information will be used in the analysis of the supply chain map and all parts know what the map should achieve. To make the map recognizable it is important to use standardized symbols which are familiar for the target group. Because the lack of a universal set of mapping, an alternative is to use specific company standards, accepted in the organization. It is also important to have a clear objective of how the map should be dissemination to concerned organization parts (Gardner and Cooper, 2003).
3.2.3 Risk of Mapping
One concern with supply chain mapping is the risk of sharing competitive information to other players in the business (Gardner and Cooper 2003). Components prices for example that competitors have interest in should not been shown in the mapping of the supply chain. There could also be supplier
information that could harm and create conflicts between players in the supply chain.
The changing of channel dynamics is also a risk in the mapping process. To see the position in a big picture of the supply chain could both be harmful for every channel member. Suppliers or customer could for example see how important they are for the company and then react on it. Supply chain mapping is a strategic tool and should not show a network model. Therefore it is crucial that companies not start to add on information after the mapping has been made. To avoid misinterpretations it is important to, before the mapping process, define which level it should address; operational, tactical or strategic and of the same reason establish the objectives of the map (Gardner and Cooper, 2003).
3.2.4 Symbolism
There are different types of framework to use when mapping a supply chain. Theodore Farris II (2010) describes a framework based on the conclusions of Gardner and Cooper (2003). He points at using a basic approach, primary focus on material. Suggesting that supply chain map should reflect flow, flows such as material (e.g. finished or return goods), financial (payments) or information (specifications, forecast, inventory data or order confirmations). He further suggest to have a top-down approach, start on a high strategic level avoid complexity and then, if necessary, break the map down into smaller pieces. Pointing that there exists more than one way to map a supply chain they suggest the symbolic in figure 6 to succeeding in map a high-level, none-complex supply chain map.
Henkow and Norrman (2011) describe a framework for mapping which purpose is to align supply chain and tax issues. However, they suggest a basic symbolic for logistics mapping which is relevant in this context. Logisticians have a long experience of mapping and analyzed their world in terms of materials and information flow, describing stocking points with triangles and productions sites with circles. They mean this contributes to an overall understanding of the whole