VTI sär
tr
yck 347A • 2001
Research on the specific
aspects of tilting
Björn Kufver and Johan Förstberg
Regression models for
provoking motion sickness
in tilting trains
Johan Förstberg
Papers given at World Congress on Railway Research
(WCRR´01)
VTI särtryck 347A · 2001
Research on the specific aspects of tilting
Björn Kufver and Johan Förstberg
Regression models for provoking motion sickness
in tilting trains
Johan Förstberg
Papers given at Wor
ld Congress on Railway Research
(WCRR´01)
RESEARCH ON THE SPECIFIC ASPECTS OF TILTING
Björn Kufver, PhDVTI Railway Systems SE-581 95 Linköping
Sweden
e-mail: bjorn.kufver@vti.se www.vti.se
Johan Förstberg, PhD
VTI, Railway Systems SE-581 95 Linköping
Sweden
e-mail: johan.forstberg@vti.se
During the last 10 years, tilt technology has progressed from unproven technology to a commercial success. However, not all the technical challenges have yet been solved and a number of the potential benefits of tilting trains remain to be exploited. This presentation is aimed at providing an update on recent Swedish research.
The research has been conducted with full-scale train tests and tests with a vehicle simulator capable of generating different combinations of lateral and roll motions. These experiments with students as test subjects were focused on ride comfort and motion sickness as functions of the motion environment. The tests were also aimed at finding a better tilt control strategy for a tilting train. Other experiments were conducted through computer simulations of vehicle reactions. Tilting and non-tilting trains were simulated on different track geometries, in order to define the best alignment and cant with respect to passenger comfort and wheel/rail forces. The results from the test subjects show that provocation of motion sickness is highly dependent on the net motion dose of roll motions (time integrated roll acceleration with leakage).
On the track side, results show that the amount of cant that minimises discomfort is dependent not only on vehicle speed and curve radius, but also on vehicle characteristics (such as tilt compensation ratio) and the lengths of the transition curves. The transition lengths that minimise discomfort are dependent on the variables mentioned above and on the angle between the connecting straight lines (when boundaries in available terrain corridors are taken into account).
If cant is not optimised for the tilting trains, an alternative solution is to use a variable tilt compensation ratio (which may be individual for each curve). In order to enable the train to predict optimal tilt on the next curve, track geometry data should be stored in onboard computers. Future research will be focused on these aspects.
Introduction
During the last 10 years, tilt technology has progressed from unproven technology to a commercial success. However, not all the technical challenges have yet been solved and a number of the potential benefits of tilting trains remain to be exploited. This paper is aimed at providing an update on Swedish experience.
Background
The idea of reducing travel times by using tilting trains, rather than major re-alignments of existing lines, was discussed as early as 1938 in Germany. Experimental trains with passive or active tilt were built in France in 1957 and in Germany in 1965, followed by Italy, Japan, Great Britain, Sweden, Spain, Canada, Switzerland and Norway. Certain countries, such as France, Germany and Great Britain, halted development at an early stage, while Japan, Sweden and Italy continued with tilt development and became the first to put this type of train into revenue traffic. This paper summarises the specific aspects of tilting with special attention to recent research.
There are a number of high-speed issues which are not tilt-specific, such as braking distances, signalling distances, catenaries for high train speeds, passenger safety on platforms which certain trains pass at high speeds, pressure waves in tunnels, etc. All these issues must be taken into account when raising train speeds, but the technology is the same for tilting as for non-tilting trains.
Wheel/rail forces
The specific aspects of tilting are related to high-speed curving, i.e. running through curves with high cant deficiencies. There are two preconditions for this operation. First, the forces on the track must be reasonably low. Second, the track must have the capability to carry the load. When these preconditions are fulfilled, the body tilt system must be optimised and modifications of the track should be considered in order to provide the best possible passenger comfort.
High wheel/rail forces and excessive wheel wear were problems at early stages in tilt development. It has been found that radial steering bogies, enabling the wheelsets to significantly reduce the angle of attack, reduce both the guiding forces and the wear rate of the wheels. The radial steering capability may be achieved by controlled steering or by self-steering bogies (also called soft bogies), the latter requiring a careful design of the primary suspension. In the case of the Swedish X2000 tilting trainset, vehicle as well as track side measurements have confirmed the self-steering performance of the soft bogies, which at the same time are stiff enough to permit stable operation on tangent track at speeds up to 250 km/h and above.
When curving at high cant deficiencies, there is always an extra vertical load on the outer rail while the inner rail is relieved. Hence, vertical wheel/rail forces must be taken into account. The three most basic vehicle solutions for achieving low vertical peak-loads are:
(1) Low nominal axle loads;
(2) Low unsprung masses, which reduces the dynamic peak loads, and; (3) Low heights of the mass centres of the vehicles.
Recently, wheel loads and radial steering performance have been measured in extensive tests in Norway. For example, it was found that track shift forces were lower than the criterion of Prud'homme, even at cant deficiencies of 300 mm and on small curve radii. In conjunction with these tests, track stability was measured with a Swedish track laboratory coach, and it was found that the investigated track could carry lateral loads exceeding the criterion of Prud'homme. The deflections of the fasteners have also been measured, and it was found that they were less than the fatigue criterion specified by the supplier (Pandrol).
Hence, both extensive full-scale tests and ten years of revenue traffic in Sweden have proven that the pre-conditions for high-speed curving are fulfilled. The basic principle of tilting, which does not influence the wheel/rail forces and wheel wear, is to roll the vehicle body inwards on curves. The tilt motion reduces the lateral acceleration and jerk perceived by passengers, but exposes them for more severe roll motions (roll velocities and roll accelerations).
Passenger comfort
Since the reduction of lateral motions must be paid for with increments in roll motions, the tilt motions should be optimised with care. Also, it should not be forgotten that ride comfort depends to a high degree on alignment and cant.
Two aspects of passenger comfort are taken into account. First, there may be instantaneous discomfort when entering curves. Previously, this aspect of comfort has been taken into account with separate limits for lateral acceleration and lateral jerk. However, certain track modifications result in higher acceleration and lower jerk, or vice versa. Hence, a quantity
termed PCT, derived by British Rail Research (now AEA Technology), has been used to
quantify the combined effect of simultaneous lateral acceleration, lateral jerk and roll velocity. It should also be mentioned that at the World Congress on Railway Research WCRR-99, Japanese researchers published extended formulas which also include the effect of roll acceleration on comfort.
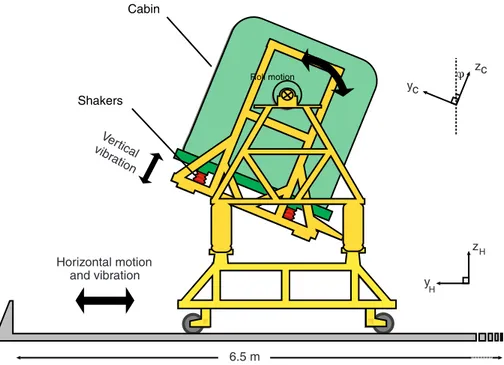
The second aspect of passenger comfort is the risk of motion sickness among sensitive passengers. It is believed that this risk is dependent on the accumulated effect of several curves. Research to find a dosage, that takes different types of motions (lateral, vertical, roll, etc.) into account is being conducted at the VTI with full-scale tests on tilting trains in Sweden and Norway and with simulator studies involving a large number of test subjects, see Figures 1-2.
Figure 1. Schematic drawing of the simulator seen from the rear. Horizontal and roll motions are generated by the outer moving system, while the shakers generate vertical vibrations.
Figure 2. Interior view of the cabin with a subject. A curtain normally separates the two subjects in the cabin.
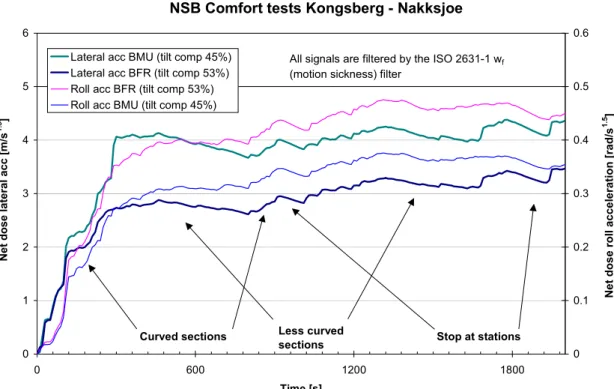
The dosage takes leakage into account, which is necessary where a tilting train runs partly on curvaceous and partly on relatively straight lines, see example in Figure 3.
NSB Comfort tests Kongsberg - Nakksjoe 0 1 2 3 4 5 6 0 600 1200 1800 Time [s] Net d o se lat eral acc [ m /s 1. 5 ] 0 0.1 0.2 0.3 0.4 0.5 0.6
Lateral acc BMU (tilt comp 45%) Lateral acc BFR (tilt comp 53%) Roll acc BFR (tilt comp 53%) Roll acc BMU (tilt comp 45%)
Stop at stations N e t d o se r o ll accel er ati o n [r ad /s 1. 5 ]
Curved sections Less curved sections
All signals are filtered by the ISO 2631-1 wf
(motion sickness) filter
Figure 3. Example of evaluation according to net dose model from NSB comfort tests during 1999 between Kongsberg and Nakksjoe. Leakage of dose is clearly seen during stops and certain less curved sections.
The results from these tests indicate that the combination of lateral and roll motions is more provocative of motion sickness than lateral motions alone. While a reduced amount of tilt may reduce the risk of motion sickness among sensitive passengers, such a measure increases
the instantaneous discomfort (PCT). A problem that arises is to balance the two types of
comfort disturbance against each other.
The optimisation of the tilt algorithm includes not only the compensation ratio (the percentage of the lateral acceleration reduced by the tilting), but also the tilt motion, whereas limitations on tilt velocity and/or tilt acceleration may be considered, as well as time delays in the tilt system.
Track geometry
Tilting trains were originally designed to run faster than conventional non-tilting trains on "existing tracks". However, it was found at an early stage that permissible train speed and/or passenger comfort could be improved with minor adjustments of the horizontal alignment and cant. Areas which have been carefully investigated are:
(1) What is the optimal cant on different curves, when tilt compensation ratio has been fixed?; (2) What is the best combination of curve radius and lengths of transition curves where a terrain corridor is defined by obstacles, such as existing catenary masts, bridges, platforms etc.?, and;
(3) What is the most suitable mathematical form for transition curves and superelevation ramps?
These research questions have been investigated with computer simulations of the dynamic vehicle reactions, and by aggregating the combined effect of different motions according to experience from comfort research. The simulations were conducted using comprehensive multi-body computer codes with 42 degrees of freedom for each vehicle and additional degrees of freedom for the track, see Figure 4. Simulations have been conducted both with and without track irregularities.
Figure 4. Vehicle models in the GENSYS simulation program. Each of the seven bodies can translate in three directions and rotate in three directions.
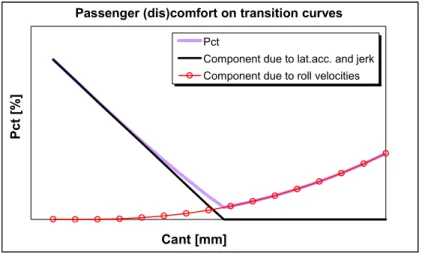
The results show, for example, that the optimal cant on a circular curve depends on the lengths of the adjacent transition curves. This is due to the effects of the lateral jerk and the roll velocity. It may also be noted that design cant should be lower than the equilibrium cant also on curves that all trains pass at the same speed. In Figure 5, discomfort when cant is low is due to high lateral acceleration and lateral jerk, while discomfort when cant is high is due to high roll velocities.
Cant [mm]
P
ct [%]
Pct
Component due to lat.acc. and jerk Component due to roll velocities
Passenger (dis)comfort on transition curves
If cant is not optimised for the tilting trains, another solution is to have a variable tilt compensation ratio (that may be individual for each curve). In order to enable the train to predict optimal tilt on the next curve, track geometry data should be stored in onboard computers. Future research will be focused on these aspects.
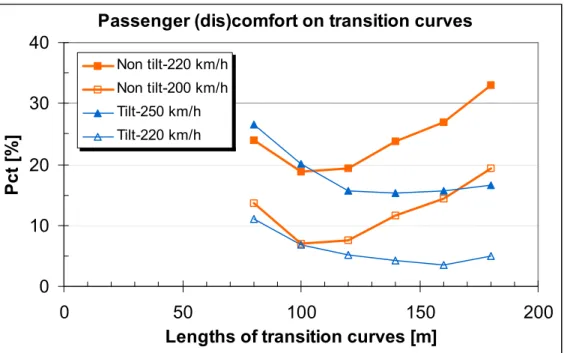
Long transition curves are favourable for all kinds of trains, but lengthening of a transition curve forces the adjacent circular curve inwards. Hence, in limited terrain corridors, the lengths of transition curves compete with curve radii, since also increasing a radius forces the track inwards. The objective for the alignment engineer should be to find optimal combinations of curve radii and transition lengths. In this context, it has been found that for tilting trains it is preferable to have longer transition curves than for non-tilting trains, even though radii must be slightly reduced, see example in Figure 6.
Passenger (dis)comfort on transition curves
0 10 20 30 40 0 50 100 150 200
Lengths of transition curves [m]
P c t [%] Non tilt-220 km/h Non tilt-200 km/h Tilt-250 km/h Tilt-220 km/h
Figure 6. Passenger discomfort PCT as a function of transition lengths in a predefined terrain
corridor. Longer transition curves are associated with smaller curve radius. Data from Kufver (2000).
S-shaped superelevation ramps and the corresponding type of transition curves have not been found superior to linear ramps and the clothoid type of transition curves. This is due to higher values of lateral jerk and roll velocity in the middle of the transition (compared to linear ramps and clothoid type of transition curve).
The two last observations are important when designing new railways. It is advisable to take the specific aspects of tilting into consideration from the very beginning, since the possibilities of arranging optimal transition lengths are greater before a railway is built. Despite this knowledge, also recent railway projects have focused on a desire for large curve radii, which is less important if tilt operation is considered. With another approach, the infrastructure cost could have been reduced and at the same time passenger comfort improved.
It must be emphasised that the tilt in itself compensates for low cant (with respect to comfort). Tilting trains have an especially great potential advantage on lines where cant is chosen for slow freight trains. Unfortunately, such railways rarely have suitable transition lengths for making full use of this advantage. Well-planned alignment design is a precondition for making full use of the advantages of tilting trains.
Concluding remarks
Vehicle development has resulted in technical solutions that enable trains to run through curves with high cant deficiencies. The track shift forces are less than the criterion of Prud'homme and the vertical wheel/rail forces are reasonably low. The engineering effort may be focused on the aspect of passenger comfort.
The tilt reduces the perceived lateral motions, but increases the roll motions. For a majority of the passengers, the combined effect on ride comfort is positive, but the effect may be enhanced by adjustments of the track geometry. Both when maintaining and renewing existing lines and when designing new ones, the specific aspects of tilting trains should be taken into consideration.
Acknowledgements:
This paper is based on research projects conducted at the VTI, Linköping, in cooperation with Professor Evert Andersson at the Royal Institute of Technology (KTH) Stockholm.
Sponsors of the projects are Bombardier Transportation (Adtranz Sweden), the Swedish National Rail Administration (Banverket), the Norwegian National Rail Administration (Jernbaneverket), the Norwegian State Railways (NSB), TrainTech, the Swedish Agency for Innovation Systems (VINNOVA), and the Swedish National Road and Transport Research Institute (VTI).
Recommended literature:
Armin Drechsel, Die Lösung der Schnellverkehrsfrage durch den kurvneigenden Kreiselwagen, Zeitung des Vereins Mitteleuropeischer Eisenbahnverwaltungen, No. 20 1938. Body tilt coaches, Report S1037 Rp1, ERRI, Utrecht, Netherlands, 1985.
First report on tilting train technology - State of the art, UIC, Paris, France, 1998.
Förstberg. J. (2000) Ride comfort and motion sickness in tilting trains - Human responses to motion environments in train and simulator experiments. Doctoral thesis, KTH, Stockholm. Harborough, P.R. (1986). Passenger comfort during high speed curving - analysis and conclusions. BRR TR DOS 017. Derby: British Rail Research.
Kufver, B. (2000) Optimisation of horizontal alignments for railways - Procedures involving evaluation of dynamic vehicle response. Doctoral thesis, KTH, Stockholm.
Ohno, H. (1996). What aspect is needed for a better understanding of tilt sickness? Quarterly
Report of RTRI (Vol 37 No 1), pp 9-13.
Suzuki, H. (1996). Recent research and developments in the field of riding comfort evaluation. Quarterly Report of RTRI (Vol. 37, No. 1), pp 4-8.
Suzuki, H., et al. (1999). Effects of vibrational factors on the riding comfort evaluation of
titling trains passing curve transitions. Paper presented at the World Congress of Railway
Regression models for provoking motion sickness
in tilting trains
Johan Förstberg, PhD
VTI, Railway Systems SE-581 95 Linköping
Sweden
e-mail: johan.forstberg@vti.se
Abstract
Reduced travel times are a major issue for railway companies. Reductions can be achieved by building new lines with a high standard of track alignment or by using tilting train on existing lines. However, for some passengers the tilt motions may provoke motion sickness and discomfort.
Modelling and prediction of motion sickness and nausea from vertical and horizontal accelerations have been investigated and developed through the combined efforts of many researchers. Vertical accelerations have been reported to have a strong influence on nausea, but less is known about the influence of roll motion. For tilting trains, where the tilt motion is used for reducing the lateral acceleration perceived by the passenger and thus improving comfort, it is likely that the primary cause of nausea is tilt motion in combination with low-frequency vertical and lateral acceleration.
In 1995, field tests were conducted with three conditions in a tilting train and in 1998 additional tests with a total of seven combinations of horizontal and roll motions were conducted in a moving base simulator at the VTI. Test subjects, mostly students, rated their illness and nausea according to a five-degree scale together with comfort, ability to work and read, etc. Evaluated variables were percentage of test subjects with motion sickness symptoms (SMSI) and nausea and illness ratings (NR and IR). Additional field test were performed in Norway during November 1999.
In the train experiments, SMSI was mainly correlated with the motion doses from roll accelerations. In the simulator experiments, vertical acceleration was most highly correlated with NR, but horizontal (lateral) acceleration together with roll acceleration were significantly better explaining variables. Net dose models with leakage of accumulated doses are a good alternative when motion environments change during the journey.
Good regression models have been found with horizontal and roll acceleration for explaining nausea ratings in the simulator. However, roll angles and horizontal accelerations are quite closely correlated in tilting trains, and roll motion doses are therefore the primary explaining variable regarding nausea in such trains. Models that take leakage into consideration are required in order to explain nausea ratings on routes with both curved and less curved sections. Optimisation of tilt motion must take into account both the risk of nausea and the risk of comfort disturbances caused by large perceived lateral accelerations, as well as the distribution of curves along the route. Also curve geometry and transition curve lengths interact significantly and must be taken into account, while preventing discomfort for passengers. Further research needs to be conducted on the basis of these aspects.
1 Introduction
Throughout the world, railway companies are searching for ways of increasing train performance, for example in terms of speed and comfort. By introducing high-speed trains, they intend to win back passengers lost to competition from other transport modes. However, most countries have a significant amount of curved track that limits speeds and thus requires certain measures in order to shorten travel times. One alternative is to construct new railways with improved horizontal alignments, i.e. large curve radii. This method may be very expensive.
An alternative is to use the existing tracks and instead make it possible to tilt the car bodies of the train inwards during curving, consequently reducing the lateral accelerations experienced by the passengers. A train equipped with such a car body tilt system can travel typically 20-25% faster on existing tracks, usually without reducing ride comfort (Andersson, von Bahr, & Nilstam 1995, Wagner 1998). However, some passengers with increased sensitivity to motion sickness may experience nausea and discomfort when riding tilting trains.
Modelling and prediction of nausea caused by vertical and horizontal accelerations have been investigated and developed over a long period of time (Golding, Finch, & Stott 1997, Golding, Müller, & Gresty 1999, Griffin 1990, Lawther & Griffin 1987, McCauley, Royal, & Wylie 1976). These models contain only translational accelerations. Combinations of roll and vertical accelerations have been reported with both minor influence (McCauley et al. 1976) and major influence (Wertheim, Bos, & Bles 1998) of roll motion on nausea.
For tilting trains, where the tilt motion is used for reducing the lateral acceleration perceived by the passengers, it is essential to develop models containing both roll, lateral and vertical accelerations. In this case, the roll motion is highly correlated to low-frequency lateral acceleration.
2 Methods and material
2.1 Train tests
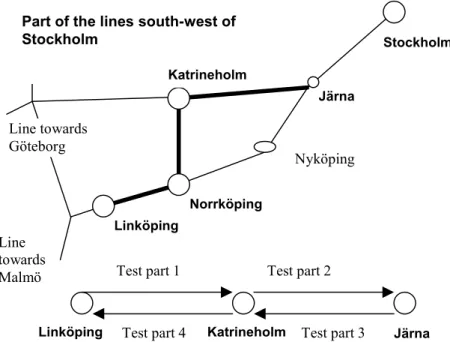
In June 1995, about 70 test subjects took part in a train test carried out over a period of three days. The total trip length of 360 km from Linköping to Järna (south of Stockholm) and back had a duration of about 3 hours and was covered once a day. This route is part of the normal route for tilting trains between Stockholm, Malmö and Copenhagen (København). The test run was divided into four sections, see Figure 1.
The mean age of the subjects was 25 years and their mean self-estimated sensitivity to motion sickness1 was 2.6 for males and 3.6 for females.
Katrineholm Järna Norrköping Linköping Stockholm Line towards Malmö
Linköping Katrineholm Järna
Test part 1 Test part 2
Test part 3 Test part 4
Part of the lines south-west of Stockholm
Nyköping Line towards
Göteborg
Figure 1 Test track (bold lines) and adjoining lines in the test.
Three test conditions were used; a reference condition (A) with 70% compensation by the tilt
system2 and two test conditions (G and F) with 55% compensation. Condition F had a
limitation of maximum tilt acceleration of (4°/s2)3 and condition G had a limitation of tilt velocity of 2.3°/s instead of the normal 4°/s, see Table 1.
Table 1 Variation in parameters used in the tilt system during the experiment (June 1995). Tilt condition Cant def. [mm] Tilt comp. [%] Max. tilt velocity [°/s] Max. tilt acceleration [°/s2]
Typical max. lateral acceleration in car body
[m/s2]
Ai 245 70 4 no limitii 0.6
F 245 55 4 4 0.8
G 245 55 2.3 no limit 0.8
Remarks: i Tilt conditions A-D were tested in earlier experiments.
ii The tilt acceleration was not limited by the tilt control system. Due to inertia of the car body and
stiffness of the suspension and dampers, the maximum car body angular acceleration was
estimated to be 10 - 15 °/s2.
Measured motion quantities were lateral and vertical accelerations on the floor of the car body together with roll accelerations. Subjects answered questionnaires on comfort and nausea after each test section.
2.2 Simulator tests
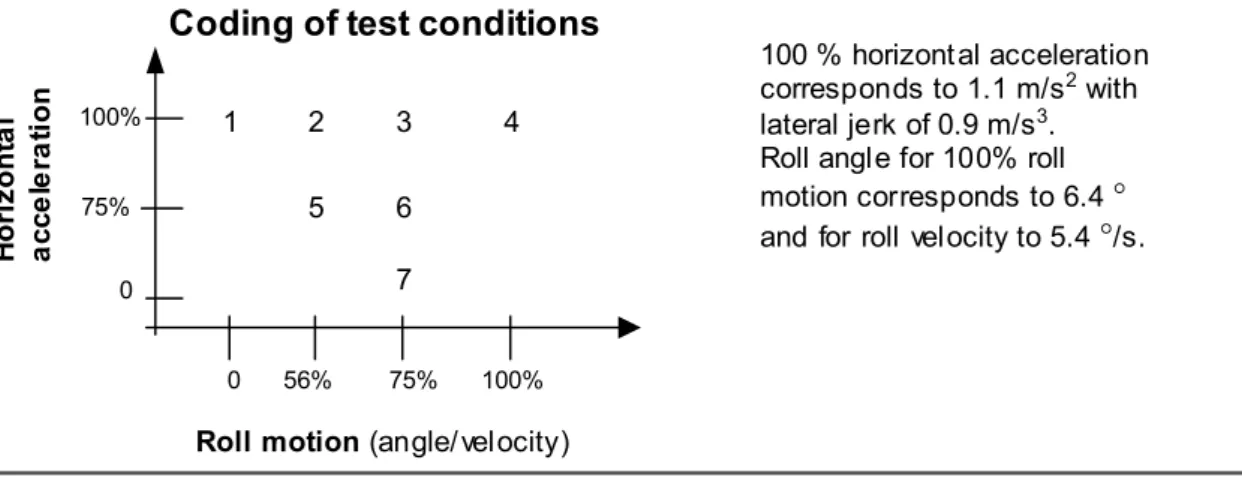
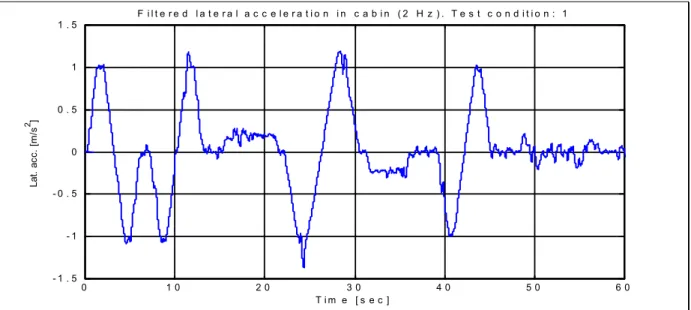
The simulator tests took place during 1998, with 42 test subjects making a total of 205 test runs. Seven test conditions were used, with three levels of horizontal (lateral) acceleration at 0, 0.825 and 1.1 m/s2 and four levels of corresponding roll motion giving compensation levels of 0, 56, 75 and 100%, see Figure 2. The principal shape of the motion sequence of the horizontal (lateral) acceleration is shown in Figure 3. A number of these motion sequences and similar motions were added together to give a total test sequence lasting 60 sec. The total
2 70% tilt compensation means that tilting the car body compensates for 70% of the lateral acceleration in the track plane and thus the passengers perceive only the remaining 30%.
test sequence was repeated 31 times, giving a total time of 31 min for the test run. Typical horizontal and vertical train vibrations in the range of 1 – 15 Hz were added to the total motion environment (Figure 4). Acoustic noise recorded inside trains was played through loudspeakers inside the cabin. The following motion quantities were recorded: vertical and lateral acceleration and roll velocity inside the cabin. By using time differentiation, lateral jerk and roll acceleration were generated. Motion quantities were filtered with the motion sickness filter wf) and then r.m.s. values were calculated over the 60 sec motion sequences for all test
conditions. 0 0 56% 75% 100% 75% 100%
Roll motion (angle/velocity)
H o ri zont a l a cce le ra ti o n 1 2 3 4 5 6 7
Coding of test conditions
100 % horizontal acceleration
corresponds to 1.1 m/s2 with
lateral jerk of 0.9 m/s3.
Roll angle for 100% roll
motion corresponds to 6.4 °
and for roll velocity to 5.4 °/s.
Figure 2 Test design of simulator experiment. The different test conditions are numbered 1 – 7.
Most of the subjects were employed repeatedly in the tests, taking part from two to seven times. Mean age was about 25 years for both genders, with a total range of 17 – 48. The mean self-estimated sensitivity to motion sickness4 was 2.7 for males and 3.3 for females.
1 2 3 4 5 6 Time [s] H o riz on tal ac c. Ro ll a n gl e 1.1 6.4 [°] [m/s2] 0.11 [rad] 1.2 1.8
Max. horizontal acceleration 1.1 m/s2
Max. horizontal jerk = 0.92 m/s3
Max roll angle = 6.4 ° (0.112 rad)
Max roll velocity = 5.4 °/s (0.094 rad/s)
Figure 3 Principal motion sequence. Layout for 100% horizontal acceleration and 100% roll motion.
0 1 0 2 0 3 0 4 0 5 0 6 0 - 1 . 5 - 1 - 0 . 5 0 0 . 5 1 1 . 5 T i m e [ s e c ] Lat . ac c. [ m /s 2 ] F i l t e r e d l a t e r a l a c c e l e r a t i o n i n c a b i n ( 2 H z ) . T e s t c o n d i t i o n : 1
Figure 4 Lateral acceleration in the cabin for motion condition 1, i.e. with only horizontal motion and no roll motion, low-pass filtered at 2 Hz. Horizontal and vertical vibrations were added.
2.3 Evaluation variables
Both the train and the simulator tests used a Nausea Rating5 scale (NR) and Illness Rating6 scale (IR) as well as a score of typical motion sickness symptoms. Evaluation variable for the train test was Symptom of Motion Sickness Incidence (SMSI), which corresponds to the percentage of a test group having nausea or dizziness or not feeling well. In the simulator test, the NR scale was the first choice for evaluation.
3 Regression models
3.1 Models
A possible regression model may contain the following motion quantities:
NR = f(az, ay, ar, t) where f is function, NR is nausea rating, az, ay and ar are vertical,
lateral and roll acceleration, and t time
A model might also contain variables such as self-estimated sensitivity, whether the subject is rested/not rested and other human factor related quantities that may influence the resulting nausea. A possible model might be:
NR = f(motion variables, sensitivity, human factors, t)
3.2 Model developed from train tests
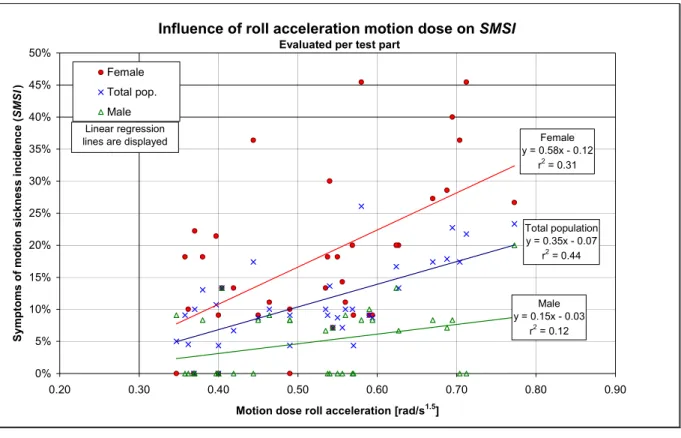
Regression analysis showed that the incidence of symptoms of motion sickness (SMSI) could best be explained by the motion dose7 of roll acceleration (ar) evaluated for each test section,
see Figure 5. Evaluation per test section assumes that the accumulated motion dose from previous test sections has leaked away. Motion doses from perceived lateral acceleration (ayc)
5 NR = 0 No symptoms up to NR = 3 Moderate nausea and NR = 4 Strong nausea.
6 IR = 0 I feel all right up to IR = 3 I feel bad (miserable) and IR = 4 I feel very bad (miserable).
7 Motion dose = [ ∫ (a
wf)2 dt ]0.5 [m/s1.5], where awf is acceleration a filtered by wf – motion sickness filter.
inside the car body as well as vertical acceleration (azc) showed much lower correlation with
SMSI. The coefficient of determination (r2) is relatively good (0.44), showing that 44% of the variation in SMSI is explained by the motion dose of roll acceleration.
Influence of roll acceleration motion dose on SMSI
Evaluated per test part
Male y = 0.15x - 0.03 r2 = 0.12 Female y = 0.58x - 0.12 r2 = 0.31 Total population y = 0.35x - 0.07 r2 = 0.44 0% 5% 10% 15% 20% 25% 30% 35% 40% 45% 50% 0.20 0.30 0.40 0.50 0.60 0.70 0.80 0.90 Motion dose roll acceleration [rad/s1.5]
Sym p to m s o f m o ti o n si ckn ess i n ci d e n ce ( SM SI
) FemaleTotal pop.
Male
Linear regression lines are displayed
Figure 5 Regression models for SMSI for female, male and total population based on roll acceleration motion doses.
3.3 Models developed from simulator tests
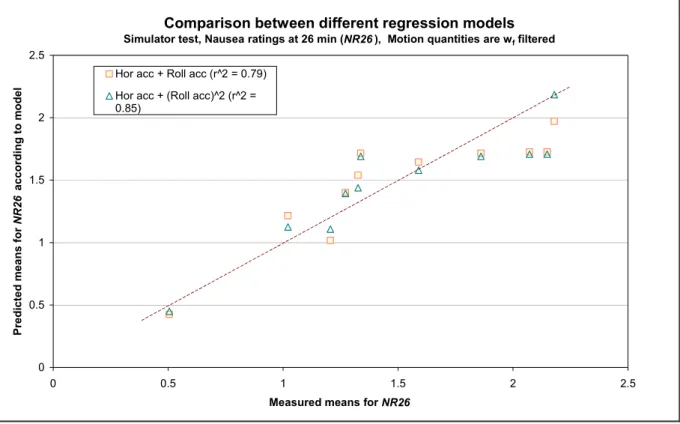
Regression analysis shows that for one variable the vertical acceleration is most suitable for explaining the nausea (NR) provoked by the experiment, followed by horizontal lateral acceleration and roll acceleration. However, horizontal and roll acceleration together is a better predictor of nausea in the simulator test than vertical acceleration alone. Quadratic relations between nausea ratings and horizontal or roll acceleration are possible, but are difficult to determine because of few levels of input variation and a large spread of responses. This model, which combines horizontal acceleration with roll acceleration, has r2 = 0.85 and highly significant explanation variables, see Figure 6. This figure shows a comparison between measured nausea ratings at time 26 min (NR26) and predicted NR26. The motion quantities are filtered with the ISO 2631-1 Wf filter. The quadratic relation shows the highest degree of determination, although both models show good predictions.
Possible regression models, under the conditions of constant motion environment (constant and continuous motions) for roll and lateral acceleration in the horizontal plane (as in the simulator experiment):
Model A: NR=−0.30+(0.060⋅ayH,rms,wf +0.40⋅ar,rms,wf)⋅ t [m/s1.5] r2 = 0.79
Model B: NR=−0.15+(0.058⋅ayH,rms,wf +7.44⋅ar2,rms,wf)⋅ t [m/s1.5] r2 = 0.85
Remarks: a is acceleration [m/s2, rad/s2] and t time [s]. Indices used relate to acceleration: yH horizontal
Comparison between different regression models
Simulator test, Nausea ratings at 26 min (NR26 ), Motion quantities are wf filtered
0 0.5 1 1.5 2 2.5 0 0.5 1 1.5 2 2.5
Measured means for NR26
Pr ed ic ted m ean s fo r NR2 6 acco rd in g to m o d e
l Hor acc + Roll acc (r^2 = 0.79)
Hor acc + (Roll acc)^2 (r^2 = 0.85)
Figure 6 Comparison between different regression models using horizontal (lateral) acceleration and roll acceleration. Nausea ratings (NR26) are measured on the abscissa and the predicted NR26 according to model on the ordinate.
3.4 Proposed motion dose model
The accepted model for predicting motion sickness is the motion dose model (MSDV) using vertical accelerations. The model is defined in ISO 2631-1. (ISO 1997). However, vertical acceleration by itself cannot explain the high level of nausea in the experiment. Therefore, the influences from lateral acceleration and roll velocity/roll acceleration are essential in the test environments used (Förstberg 2000). The motion dose method can be extended to other translations or to angular accelerations (Turner & Griffin 1999). However, when considering the provoking of nausea on actual journeys with tilting trains, leakage of nausea has to be taken into consideration. Such a model has been proposed as the net dose model (Kufver & Förstberg 1999). This model can be rewritten with lateral (horizontal) and roll acceleration as input acceleration and with the same dimension as in the motion dose evaluation.
⋅ ⋅ + ⋅ =
∫
t c −t wf r rx wf yH y a c a d c t ND L 0 2 2τ
τ
(τ )τ
, , ( ) ( )) e ( ) ( [m/s1.5] ND c NR= NR ⋅ [-]Remarks: a is acceleration (lateral [m/s2] or roll [rad/s2]), and t time [s]. Indices used relate to
acceleration: yH horizontal (lateral), rx roll and wf ISO 2631-1 filter for motion sickness. c are
constants where cy [-], crx [m2/rad2], cNR [s1.5/m] and cL is a time constant for leakage [1/s].
Future research with tilting trains and subjects must be carried out in order to determine the different coefficients.
4 Discussion and conclusions
Roll motion, as evaluated, as motion dose from roll accelerations or roll velocity seems to have a significant influence on motion sickness in tilting trains. The simulator study shows that a combination of horizontal acceleration and roll acceleration motion doses is a highly significant explanation variable. Vertical acceleration generated in the simulator test is generally of an insufficient magnitude to provoke nausea. Horizontal acceleration alone seems to be an important explanation variable.
Roll and horizontal acceleration motion doses are highly correlated in tilting trains, which implies that a regression model can only utilise one of the variables.
The proposed models for the simulator tests with the explanation variables, motion doses of horizontal acceleration and roll acceleration show good agreement with NR26. The coefficient of determination (r2) is high; at least 0.80 for the proposed models. Additionally, the self-estimated sensitivity is shown as a significant explanation variable.
5 Acknowledgements
This project was financed by Adtranz Sweden (now Bombardier Transportation), SJ Rolling Stock Division (now TrainTech Engineering), the Swedish Transport and Communications Research Board (KFB) and the Swedish National Road and Transport Research Institute (VTI). I am very grateful for their helpful co-operation and contributions. The project has been conducted in co-operation with the Royal Institute of Technology (KTH) in Stockholm (Prof. Evert Andersson) and the ENT Department at University Hospital in Linköping (Ass. Prof. Torbjörn Ledin).
6 References
Andersson, E., von Bahr, H. & Nilstam, N. G. (1995). Allowing higher speed on existing tracks - Design considerations of train X2000 for Swedish State Railways (SJ).
Proceedings of the Institution of Mechanical Engineers. Part F: Journal of Rail and Rapid Transit, 209(2), pp. 93-104.
Förstberg, J. (2000). Ride comfort and motion sickness in tilting trains: Human responses to motion environments in train and simulator experiments. TRITA-FKT Report 2000:28. Stockholm: KTH Railway Technology.
Golding, J. F., Finch, M. I. & Stott, J. R. (1997). Frequency effect of 0.35-1.0 Hz horizontal translational oscillation on motion sickness and the somatogravic (somatographic ??) illusion. Aviation, Space and Environmental Medicine, 68(5), pp. 396-402.
Golding, J. F., Müller, A. G. & Gresty, M. A. (1999). Maximum motion sickness is around 0.2 Hz across the 0.1 to 0.4 Hz range of low frequency horizontal translation oscillation. In
proceedings of 34th UK group meeting on human response to vibration, Ford Motor
Comp. Dunton (England), Ford Motor Comp.
Griffin, M. J. (1990). Handbook of Human Vibration. London: Academic Press.
ISO. (1997). Mechanical vibration and shock - Evaluation of human exposure to whole body vibrations - Part 1: General requirements. ISO 2631-1.2:1997 (E). Geneva: ISO.
Kufver, B. & Förstberg, J. (1999). A net dose model for development of nausea. VTI Särtryck
(Reprint ??) 330. Linköping (Sweden): VTI.
Lawther, A. & Griffin, M. J. (1987). Prediction of the incidence of motion sickness from the magnitude, frequency, and duration of vertical oscillation. Journal of Acoustical Society
of America, 82(3), pp. 957-966.
McCauley, M. E., Royal, J. W. & Wylie, C. D. (1976). Motion sickness incidence: Exploratory studies of habituation, pitch and roll, and the refinement of a mathematical
model. Technical Report No. 1733-2, AD-AO24 709. Goleta (California): Human Factors Research Inc.
Turner, M. & Griffin, M. J. (1999). Motion sickness in public road transport: the relative importance of motion, vision and individual differences. Br J Psychol, 90(Pt 4), pp. 519-530.
Wagner, R. (1998). Higher travelling speeds with tilting technology. In Proceedings of
Engineering innovation for a competitive edge, 7-9 Sept 1998, Capricon, Queensland
(Australia), (W. Oghanna (Ed.) pp. 389-394), Central Queensland University, Rockhampton (Australia).
Wertheim, A. H., Bos, J. E. & Bles, W. (1998). Contributions of roll and pitch to sea sickness.