Mälardalen University
This is a submitted version of a paper published in Fire safety journal. Citation for the published paper:
Hansen, R., Ingason, H. [Year unknown!]
"Heat Release Rates of Multiple Objects at Varying Distances" Fire safety journal
Access to the published version may require subscription. Permanent link to this version:
http://urn.kb.se/resolve?urn=urn:nbn:se:mdh:diva-11305
Heat Release Rates of Multiple Objects at
Varying Distances
Rickard Hansen
1Haukur Ingason
1,2 1Mälardalen University
Box 833
721 23 Västerås
Sweden
2SP Technical Research Institute of Sweden
Box 857
501 15 Borås
Sweden
Abstract
Simple theoretical calculations of the overall heat release rate (HRR) of multiple objects at both constant and varying distances have been carried out. The results were compared to both fire experiments in a longitudinal ventilated model tunnel (scale 1:15) using piles of wooden pallets placed at varying distance from each other and with model scale fire experiments (scale 1:4) conducted with a freight truck commodity without roof over the piles of wooden pallets. Two different methods are presented which are based on physical relations for fire spread between the piles of wooden pallets. The first method uses a critical heat flux as ignition criteria while the other method uses an ignition temperature. The method using the critical heat flux as ignition criteria shows very good agreement with the corresponding experimental results used. The method using the ignition temperature as ignition criteria did not agree well with the corresponding experimental results. The prerequisite that the burning objects should not necessarily have to be positioned at equal distance was fulfilled.
Notation
f
A =flame area (m²) p
c =specific heat (kJ/kg·K) D=diameter of the fire (m)
tot
E =total calorific value (MJ) F =view factor
c
h =convective heat loss coefficient (kW/m2·K) f
h =mean flame height (m) k=thermal conductivity (W/m·K)
s
k =time width coefficient =
a
m& mass flow (kg/s)
max ,
f
2 s n =retard index P=perimeter of tunnel (m) = '' cr
q& critical heat flux (kW/m2) =
''
flux
q& external heat flux (kW/m2)
''
net
q& =net heat flux (kW/m²) =
Q& heat release rate (HRR) (kW) =
max
Q& maximum HRR (kW)
R=distance between two parallel rectangles (m) s
r =amplitude coefficient
s=pile number in a sequence of piles t=time (s)
max
t =time to attain maximum HRR (s) a
T =ambient temperature (K) avg
T =average gas temperature (K) f
T =average temperature at the fire (K) s
T =surface temperature (K) f
T
∆ =average excess temperature at the fire location (K) c
u =centre line velocity (m/s) X =side of rectangle (m) x=location of interest (m) Y=side of rectangle (m) ε =emissivity factor
ρ
=density (kg/m³) σ =Stefan-Boltzmann constant, 5.67·10-11 kW/m2·K4 τ =atmospheric transmissivity3
Introduction
The HRR of a large vehicle with several combustible components or a cargo load with a combustible commodity which is packaged into several separated fuel objects can pose a great risk to people in the near vicinity and is therefore highly desirable to quantify so that the smoke spread etc can thereafter be quantified. If the vehicle is located in an underground facility, such as mine or road tunnel, the risk becomes even greater.
Hansen and Ingason [1] presented an engineering tool to calculate the HRR of multiple
objects located in an underground structure. The method was compared to experiments carried out in a model tunnel (1:23) with varying number of wood cribs placed at equal distances from the ignited wood crib. The work presented here continues with quantifying the total HRR of multiple fuel objects where the distance between the objects are varied.
Two different methods are used to determine the time of ignition of adjacent fuel objects. One method uses a critical heat flux as ignition criterion and the other method uses an ignition temperature as ignition criterion.
In order to validate the method, a comparison with experimental data has been used. The experimental data was obtained from model scale experiments presented by Hansen and Ingason [2] and by Arvidson [3]. These tests were found to be very well defined and fit very well to the aim of the work presented here. The combustible components were simulated using piles of wooden pallets and the distance between the piles was varied in the case of Hansen and Ingason [2] and kept constant in the case of Arvidson [3]. This made it possible to make the necessary comparison.
In the following, the model scale experiments presented by Hansen and Ingason [2] and Arvidson [3] are outlined together with the theories for the models used to predict the fire spread.
4
Fire experiments in model scale tunnel
Hansen and Ingason [2] presented a series of tests in a model tunnel. A total of 12 tests were carried out in a 1:15 scale model tunnel. The tunnel was 10 m long, 0.6 m wide and 0.4 m in height, see Figure 2. The corresponding large scale dimensions were thus 150 m long, 9 m wide and 6 m high. The parameters tested were: the distance between piles of wood pallets and longitudinal ventilation rate. The aim was to investigate the effect of different distances between piles of wood pallets on fire spread under different longitudinal ventilation rates. Longitudinal ventilation was established using an electrical axial fan attached to the entrance of the model tunnel, see Figure 1. The fan was 0.375 m long with an inner diameter of 0.315 m. The longitudinal velocities were obtained by adjusting a frequency regulator. In between the fan and the tunnel entrance, two nets consisting of smooth pipes with lengths of 450 mm and diameters of 45 mm were attached to the fan and at the entry of the tunnel respectively. Longitudinal wind velocities of 0.3 m/s, 0.6 m/s and 0.9 m/s were used in the test series. The corresponding large scale velocities were 1.16 m/s, 2.32 m/s and 3.49 m/s.
During the tests the produced smoke flow was removed by the central ventilation system connected to the end of the model tunnel. The smoke was exhausted through a cubic box located at the end of the tunnel portal; see the right hand portal in Figure 1. The cubic box was made of Promatect H boards and covered the entire portal except the bottom part was fully open in order to disconnect the central system and the tunnel flow.
The model tunnel was constructed using non-combustible, 15 mm thick, boards (Promatect H). The manufacturer of the boards provides the following technical data: the density of the board is 870 kg/m3, the heat capacity is 1130 J/kg K and heat conduction is 0.175 W/m·K. The floor, ceiling and one of the vertical walls, were built in Promatect H boards while the front side of the tunnel was covered with a fire resistant 5 mm window glaze.
5 Figure 1. The 1:15 model scale tunnel used in the experiments.
Figure 2. A schematic drawing of the model tunnel [4].
The fire load consisted of piles of wood pallets (pine), where each pile consisted of five individual wood pallets. Test fire 1, 4 and 12 were reference tests and consisted of a single pile of pallets, whereas in the other tests the fire load consisted of four piles of wood pallets placed at different distances. The reference test was use to obtain basic data on heat release rates, temperatures, gas concentrations and heat fluxes.
The wooden pallets were geometrically scaled 1:4 using the standard European measurements 1200 mm by 800 mm. These pallets were originally designed and built for use in another project on fire safety on board ships [3]. As a large number of pallets were available, it was decided to use them in the present work.
6 W × H).A detailed description – with measurements - of a wood pallet is given in Figure 3. More detailed information about the piles of wood pallets for each test is given in Table 1.
7 Figure 4. Wooden pallet (1:4 scale) used in the model scale tests.
Table 1. Information on the piles of wood pallets used in the fire experiments [2].
Test # Ta [ºC] uc [m/s] Number of piles Initial weight of each pile [kg] Arrangement of piles – free distance
1 22 0.3 1 1.719 -
2 22 0.3 4 #1-1.712 ; #2-1.729
#3-1.697 ; #4-1.669
0.6 m between pile #1 and #2; 0.9 m between pile #2 and #3; 0.9 m between pile #3 and #4.
3 22 0.6 4 #1-1.662 ; #2-1.715
#3-1.697 ; #4-1.669
0.4 m between pile #1 and #2; 0.7 m between pile #2 and #3; 0.6 m between pile #3 and #4.
4 22 0.6 1 1.687 -
5 22 0.6 4 #1-1.755 ; #2-1.748
#3-1.673 ; #4-1.728
0.5 m between pile #1 and #2; 0.7 m between pile #2 and #3; 0.8 m between pile #3 and #4.
6 22 0.6 4 #1-1.701 ; #2-1.726
#3-1.695 ; #4-1.671
0.5 m between pile #1 and #2; 0.8 m between pile #2 and #3; 0.9 m between pile #3 and #4.
7 22 0.6 4 #1-1.681 ; #2-1.672
#3-1.707 ; #4-1.684
0.5 m between pile #1 and #2; 0.8 m between pile #2 and #3; 1.1 m between pile #3 and #4.
8 22 0.6 4 #1-1.656 ; #2-1.693
#3-1.684 ; #4-1.747
0.5 m between pile #1 and #2; 0.8 m between pile #2 and #3; 1.3 m between pile #3 and #4.
9 22 0.6 4 #1-1.738 ; #2-1.657
#3-1.705 ; #4-1.671
0.6 m between pile #1 and #2; 0.8 m between pile #2 and #3; 1.1 m between pile #3 and #4.
10 22 0.6 4 #1-1.653 ; #2-1.695
#3-1.685 ; #4-1.691
0.7 m between pile #1 and #2; 0.8 m between pile #2 and #3; 1.1 m between pile #3 and #4.
11 22 0.6 4 #1-1.700 ; #2-1.651
#3-1.703 ; #4-1.715
0.7 m between pile #1 and #2; 0.9 m between pile #2 and #3; 1.1 m between pile #3 and #4.
The total weight of the different piles of wood pallets ranged from 1.651 kg to 1.755 kg (see Table 1). The variation is because each wood pallet was manufactured by hand.
The wood pallets used in each test were dried overnight in a furnace at 60 ºC (<5% moisture). Before the tests, the weights of the wooden pallets were measured. In addition, the moisture of the upper wooden pallet was measured with MC-300w Humitest wood moisture meter with a measuring range of 0-80 % H2O. The first pile of wood pallets was placed on the weighing platform at a height 50 mm above floor. In test 1 and 2 the adjacent piles were placed directly on the floor whereas in test 3-12 the piles were placed on an extra Promatect H board in order to keep them at the same level as the first pile. A cube of fibreboard measuring 0.03 m, 0.03 m and 0.024 m was soaked in heptane (9 mL), wrapped with cellophane and was placed on the weighing platform board at the upstream edge of the pile of wood pallets. At 2 minutes from start of the logging system, this cube was ignited. During tests with several piles of wooden pallets, the time of ignition of adjacent piles were clocked and documented manually. After each test, the left wooden pallets or char was dried over a night again and then measured to determine the net weight loss during a fire test.
A schematic of the experimental setup is given in Figure 5.
Figure 5. The layout of instruments and measurements (dimensions in mm) [4].
Full details of all tests conducted are summarised in reference 1. Tests 3 to 11 were chosen for closer examination and comparison to modelling. The main reason is that they all comprised tests involving four piles of wooden pallets.
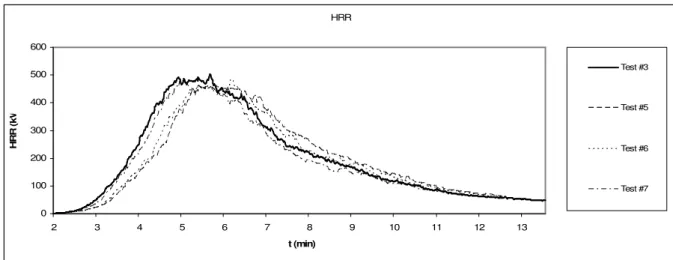
The result of test number 4 can be used to compare the HRR curve of a single item – pile of wooden pallets - and the results of tests 3 and 5 to 11 can be used to compare the HRR curve for multiple objects.
10 HRR - test #4 0 20 40 60 80 100 120 140 160 180 2 3 4 5 6 7 8 9 10 11 t (min) H R R ( k W ) HRR
Figure 6. The heat release rate of test #4.
HRR 0 100 200 300 400 500 600 2 3 4 5 6 7 8 9 10 11 12 13 t (min) H R R ( k W ) Test #3 Test #5 Test #6 Test #7
Figure 7. The heat release rate of test #3, 5, 6 and 7.
HRR 0 100 200 300 400 500 600 2 3 4 5 6 7 8 9 10 11 12 t (min) H R R ( k W ) Test #8 Test #9 Test #10 Test #11
11 Table 2 lists the centre line velocity, the mass flow rate inside the tunnel, the fuel mass
burning rate, the maximum HRR and the time to attain maximum HRR for the nine tests. Table 2. The results of measurements from test #1, 3 to 11 [2].
Test # uc [m/s] m&a [kg/s] m&f,max [kg/s] Q&max [kW] tmax[s]
1 0.266 0.067 0.083 116 132 3 0.782 0.218 0.188 504 233 4 0.555 0.160 0.209 154 142 5 0.755 0.211 0.187 467 242 6 0.774 0.216 0.148 488 257 7 0.765 0.214 0.198 485 194 8 0.747 0.208 0.206 479 211 9 0.723 0.203 0.157 461 245 10 0.699 0.196 0.125 454 272 11 0.687 0.192 0.115 464 305 12 0.838 0.239 0.265 169 162
The maximum ceiling temperature at increasing distances from the centreline of the fire source is shown in columns two to nine in Table 3. In columns ten and eleven, the maximum arithmetic average temperature at thermocouple piles A and B is given.
Table 3. The results of gas temperature measurements from test #1, 3 to 11 [2]. Test # 5 T [ºC] 6 T [ºC] 7 T [ºC] 8 T [ºC] 9 T [ºC] 10 T [ºC] 11 T [ºC] 12 T [ºC] A avg T , [ºC] B avg T , [ºC] 1 819 911 792 562 517 351 255 217 241 103 3 683 1020 850 775 804 810 659 519 830 490 4 596 901 807 554 508 399 304 244 454 155 5 657 957 832 799 892 860 690 506 857 479 6 658 944 809 737 844 821 766 540 838 538 7 678 962 850 772 848 801 779 547 867 527 8 657 947 800 751 836 812 783 567 864 562 9 647 947 809 724 793 807 787 567 844 552 10 640 931 782 684 814 798 791 599 860 607 11 629 914 778 707 812 759 795 627 874 639 12 121 594 644 472 455 387 327 270 319 216 The total heat flux measured by plate thermometers positioned at floor level and at different locations from the fire. The heat flux was calculated using an equation where the average gas temperature at the sites was used [5]. In column two to five of Table 4 the maximum heat flux measured with heat flux meters flux 1, flux 2, flux 3 and flux 4 are given.
Table 4. The results of measurements from test #3 to 11 [2]. Test # ''
1
q& [kW/m²] q&2'' [kW/m²] q& [kW/m²] 3'' '' 4 q& [kW/m²] 1 0.084 0.302 0.055 0.036 3 0.057 2.555 1.857 0.466 4 0.038 0.550 0.162 0.043 5 0.057 2.554 1.978 0.495 6 0.053 2.757 1.904 0.611
12 7 0.056 3.208 0.287 0.674 8 0.002 0.0007 0.082 0.033 9 0.047 3.360 2.003 0.827 10 0.044 2.196 2.482 0.915 11 0.050 2.105 2.494 1.105 12 0.024 0.405 0.155 0.079
In test #7 the plate thermometer ( '' 3
q& ) was underneath pile #4, thus the resulting low heat flux in this case.
Test results related to the time of ignition of adjacent piles of wooden pallets are shown in Table 5. The time of ignition of adjacent piles of wooden pallets was recorded manually based upon visual observations. The ignition time of pile #1 was set to the start point of the test. Table 5. The ignition time of adjacent piles of wooden pallets [2].
Test # Ignition time of pile #1 [s] Ignition time of pile #2 [s] Ignition time of pile #3 [s] Ignition time of pile #4 [s] 1 0 - - - 3 0 96 129 150 4 0 - - - 5 0 111 164 183 6 0 105 149 176 7 0 96 139 180 8 0 99 140 195 9 0 110 162 190 10 0 130 183 224 11 0 134 196 235 12 0 - - -
13
Model scale fire experiments conducted with a freight truck commodity
Arvidson [3] conducted a series of down-scaled (scale 1:4) fire tests aimed at simulating fires on the trailer of a freight truck. The fire tests were conducted with two types of commodities (wooden pallets or cardboard cartons with plastic cups), different loading and with or without a roof over the test set-up.
The tests were conducted with 2, 4, 6, 8 or 10 rows of commodity. The point of ignition was usually positioned at the centre point of the central stack of commodity.
During all tests the heat release rate and the heat flux were measured.
The heat release rate of the fires was determined with a calorimeter with a hood measuring 3000 mm by 3000 mm. The heat flux from the fire was recorded using Schmidt Boelter total heat flux meters with a measurement range of 0 - 100 kW/m². The heat flux meter was positioned at the long side of the trailer mock-up, directed towards the transversal centreline of the stacks of commodity at a horizontal distance of 500 mm.
The model was constructed to geometrically replicate the typical trailer of a freight truck. The trailer model itself was 3.175 m long, 0.65 m wide and 0.97 m in height. The corresponding large scale dimensions were thus 12.7 m long, 2.6 m wide and 3.88 m high.
The mock-up itself was constructed from 30 mm square iron and the bottom and the roof of the platform of the mock-up was constructed from 10 mm thick Promatect H boards. The vertical distance measured from floor level to the platform was 340 mm (equalling 1360 mm in full scale). The mock-up was placed on a stand, 3500 mm by 1250 mm, which was raised 600 mm above floor level.
Two different commodities were used in the tests, idle wooden pallets and cardboard cartons with plastic cups. Focus will be only on the tests with wooden pallets as they are identical to the type of pallets used in the tests performed by Hansen and Ingason [2]. Furthermore focus will be only on the tests without roof in order to reduce the probability that the flame will bend before the adjacent pile is ignited.
The same type of wooden pallets was used as in the experiments by Hansen and Ingason [2], i.e. standard European wood pallets scaled down to 1:4.
For the tests, 14 pallets were stacked on top of each other in every pile. This equalled an overall height of 504 mm (2016 mm in full scale) and the total weight of each pile was approximately 4.95 kg (317 kg in full scale). The pallets were made from soft wood (Pine) and dried in a furnace to a moisture content of approximately 10%.
14 Figure 9. The trailer model used in the fire experiments [3].
The wooden pallets were positioned on the platform such that longitudinal and transversal gaps of 25 mm (100 mm in full scale) were created between the piles of pallets. The tests were conducted with 2, 4, 6, 8 or 10 rows of pallets. The point of ignition was usually positioned at the centre point of the central pile of pallets. This allowed the fire to spread in two directions. However, for one of the tests using 10 rows of piles of wooden pallets, the point of ignition was moved to the centre point of the far right flue space of the rows. This test is named 7P(10)O. This allowed the fire to spread in one direction only.
A larger ignition source was used for all (except for one) tests. This ignition source consisted of 20 mm by 25 mm strips of Rockwool® mineral insulation that were soaked in heptane. The length of the strips was adjusted such that the inner flue space of the central stack of wood pallets was exposed to the flames. This ignition source provided a faster, more symmetrical and repeatable fire ignition of the idle wood pallets than the small ignition source. The fire size of the larger igniter was not measured. However, based on the experimental data from the fire tests it seems that the heat release rate of this ignition source was of the order of 30 kW [3].
The small ignition source consisted of a cube, 30 mm by 30 mm by 25 mm, which was soaked in 10 mL of heptane. This ignition source was used for one of the tests using wood pallets – named test 1P(2).
As the ignition source and the point of ignition was different in the case of test fire 1P(2) and 7P(10)O, respectively, the results of those two tests were not included in the continued analysis.
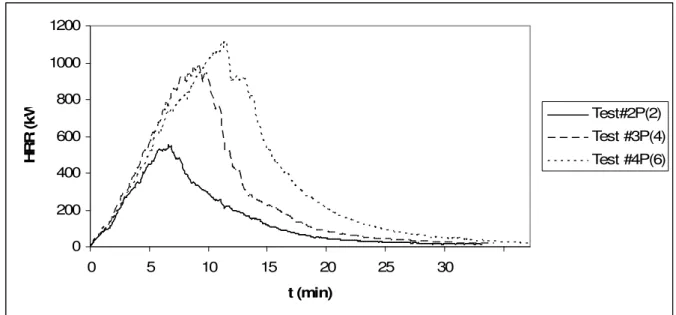
15 0 200 400 600 800 1000 1200 0 5 10 15 20 25 30 t (min) H R R ( k W ) Test#2P(2) Test #3P(4) Test #4P(6)
Figure 10. The heat release rate of test #2P(2), 3P(4) and 4P(6).
0 200 400 600 800 1000 1200 0 5 10 15 20 25 30 35 40 45 t (min) H R R ( k W ) Test#5P(8) Test #6P(10)
Figure 11. The heat release rate of test #5P(8) and 6P(10). Table 6. Fire experiments conducted in a trailer model [3].
Test # Number of rows Total number of pallets Total mass [kg]
2P(2) 2 56 19.8
3P(4) 4 112 39.7
4P(6) 6 168 59.5
5P(8) 8 224 79.3
6P(10) 10 280 99.1
In table 7 the test results are summarized.
Table 7. The test results of the fire tests conducted in a trailer model [3]. Test # Max total HRR Max one minute Peak convective HRR Max one minute average Total energy [MJ] Total convective energy Ratio convective energy to Max one minute average
16 [kW] average total HRR [kW] [kW] convective HRR [kW] [MJ] total energy heat flux [kW/m²] 2P(2) 554 533 391 379 294 207 0.70 N/A 3P(4) 983 951 624 599 535 357 0.67 81 4P(6) 1122 1080 653 637 748 488 0.65 109 5P(8) 1080 1065 657 642 942 614 0.65 116 6P(10) 1023 979 612 597 1171 753 0.64 104
Method using summation of objects HRRs
Ingason [6] proposed a method to estimate the HRR given as a single exponential function of time instead of several functions for different time intervals. The work of Ingason is based on the work by Numajiri and Furukawa [7] and is only applicable to fuel controlled fires, or fires with a small or negligible constant maximum HRR period. The method is furthermore applied and discussed by Hansen and Ingason [1]. The design parameters are the peak HRR (Q&max), the total calorific value, Etot and the retard index ( n ), which is an arbitrarily chosen
parameter with no physical meaning. Based on these parameters, the time to the peak HRR (tmax) and the fire duration (td) can be calculated. Other parameters used in the model include the amplitude coefficient (r) and the time width coefficient ( k ), which are calculated based on the input parameters the peak HRR and the total calorific value.
The method uses the following equation when calculating the sum of all individual HRR:
∑
= ⋅ − − ⋅ − ⋅ − ⋅ ⋅ ⋅ = p s t k n t k s s s s s s e e r n Q Q 1 1 max, (1 ) & & [kW] (1) Where:p is the total number of objects
s is the pile number in a sequence of objects s
Q&max, is the maximum HRR [kW] t is time [s] s n is a retard index s r is an amplitude coefficient s
k is the time width coefficient
The amplitude coefficient and the time width coefficient are calculated for each type of object using the following equations:
s n s s n r − − = 1 1 1 (2)
17 s s tot s s r E Q k = ⋅ , max, & (3) s s s k n tmax, = ln( ) (4)
Applying the least squares fit technique to the performed fire tests by Hansen and Ingason [2] and Arvidson [3], the calculated HRR was fitted to the measured HRR, using different retard indices for each of the test fires. The indices used are summarised in Table 8 and Table 9. Table 8. Index and coefficients of the test fires by Hansen and Ingason [2] with Q&max =0.154
MW for test #4.
Test #3 Test #4 Test #5 Test #6 Test #7 Test #8 Test #9 Test #10 Test #11
1 n 5.6 5.6 5.6 5.6 5.6 5.6 5.6 5.6 5.6 2 n 12.6 16.6 15.6 12.6 12.6 15.6 22.6 26.6 3 n 19.6 27.6 25.6 19.6 19.6 25.6 39.6 47.6 4 n 26.6 38.6 35.6 26.6 26.6 35.6 56.6 68.6 1 r 2.5 2.5 2.5 2.5 2.5 2.5 2.5 2.5 2.5 2 r 2.5 2.5 2.5 2.5 2.5 2.5 2.5 2.5 3 r 2.5 2.5 2.5 2.5 2.5 2.5 2.5 2.5 4 r 2.5 2.5 2.5 2.5 2.5 2.5 2.5 2.5 1 k 0.0123 0.0123 0.0123 0.0123 0.0123 0.0123 0.0123 0.0123 0.0123 2 k 0.0123 0.0123 0.0123 0.0123 0.0123 0.0123 0.0123 0.0123 3 k 0.0123 0.0123 0.0123 0.0123 0.0123 0.0123 0.0123 0.0123 4 k 0.0123 0.0123 0.0123 0.0123 0.0123 0.0123 0.0123 0.0123
These indices resulted in the following expression for test fire #4:
(
t)
tfire
calculated e e
Q& , #4 =154⋅5.6⋅2.5⋅ 1− −0.0123⋅ 4.6⋅ −0.0123⋅ (5)
Table 9. Index and coefficients of the test fires by Arvidson [3] with Q&max =0.574 MW for test #2P(2).
Test #2P(2) Test #3P(4) Test #4P(6) Test #5P(8) Test #6P(10)
1 n 6.2 6.2 6.2 6.2 6.2 2 n 17.2 24.2 26.2 48.2 3 n 42.2 46.2 90.2 4 n 66.2 132.2 5 n 174.2 1 r 2.4 2.4 2.4 2.4 2.4 2 r 2.4 2.4 2.4 2.4
18 3 r 2.4 2.4 2.4 4 r 2.4 2.4 5 r 2.4 1 k 0.0051 0.0051 0.0051 0.0051 0.0051 2 k 0.0051 0.0051 0.0051 0.0051 3 k 0.0051 0.0051 0.0051 4 k 0.0051 0.0051 5 k 0.0051
These indices resulted in the following expression for the test fire # 2P(2):
(
t)
tP fire
calculated e e
Q& , #2 (2) =574⋅6.2⋅2.4⋅1− −0.0051⋅ 5.2⋅ −0.0051⋅ (6)
Method using external critical heat flux as ignition criterion
The method is described by Hansen and Ingason [1] assuming that the HRR curve of the first single object is known a priori from experiments.
Ignition is assumed to occur when the incident heat flux exceeds a critical value. The critical external heat flux value for wood, q& , is assumed to be 13.1 kW/mcr''
2
(Monterey Pine with a moisture content of 0 %), Babrauskas [8].
When determining the time of ignition for the model scale tunnel, the following relationship from Ingason [5] was used for determining the external heat flux:
) ( ) ( 4 4 '' a avg a avg c flux h T T F T T q& = − + ⋅ε⋅σ − [kW/m2] (7) Where: c
h is the convective heat loss coefficient, which is set to 0.005 kW/m2·K (in accordance with what was reported by Ingason [5])
avg
T is the average gas temperature [K] a
T is the ambient temperature [K], which is set to 295 K F is the view factor, which is set to 1
ε is the emissivity factor, which is set to 0.8 (in accordance with Ingason [5]) σ is the Stefan-Boltzmann constant, 5.67·10-11 kW/m2·K4
The average gas temperature, Tavg, is calculated using the following expression from Ingason [5]: − = ∆ ∆ macp hPx f avg e T x T ( ) & (8) Where:
19 )
( f a
f T T
T = −
∆ is the average excess temperature at the fire location [K]
h is the lumped heat loss coefficient, which is set to 0.016 kW/m2K for the pile closest to the fire and 0.023 kW/m2K for the piles further away from the fire (in accordance with Ingason [5]).
P is the perimeter of the tunnel [m] x is the location of interest [m]
a
m& is the massflow [kg/s] p
c was set to 1.0 kJ/kg·K
The average temperature at the fire, Tf , is calculated using the following expression from Ingason [5]: p a a f c m Q T T & & 3 2 + = (9)
When determining the time of ignition for the freight truck commodity, the following relationship was used for determining the external heat flux:
f flux A F Q q&'' = 0.3⋅ &⋅ ⋅
τ
[kW/m2 ] (10) Where:τ is the atmospheric transmissivity, which is set to 1 f
A is the flame area [m2]
The view factor – for two parallel rectangles - was calculated using the following expression:
(
) (
)
(
)
(
)
(
)
(
)
(
)
⋅ − ⋅ − + ⋅ + ⋅ + + ⋅ + ⋅ + + + + ⋅ + ⋅ ⋅ ⋅ = − − − − y y x x x y x y y x y x y x y x y x F 1 1 2 / 1 2 1 2 / 1 2 2 / 1 2 1 2 / 1 2 2 / 1 2 2 2 2 tan tan 1 tan 1 1 tan 1 1 1 1 ln 2π
(11) R X x= (12) R Y y= (13) Where: YX, are the sides of the rectangle [m]
R is the distance between the two rectangles [m]
20 5 / 2 235 . 0 02 . 1 D Q hf =− ⋅ + ⋅ & [m] (14) Where:
D is the diameter of the fire [m]
The total flame area is assumed to consist of the four sides of the two rows of the piles of wooden pallets with a height equivalent to the mean flame height.
The HRR of the first pile or two rows of pallets are calculated using equation (5) or equation (6) respectively. The fire is assumed to be fuel controlled (no lack of oxygen in the vicinity of the fire source).
Based on calculated values for Tf and Tavgor F and Af , the external heat flux,
''
flux
q& , at the pile closest to the fire could be calculated.
In table 10 and 11 the ignition times of the individual piles or rows of wooden pallets are listed.
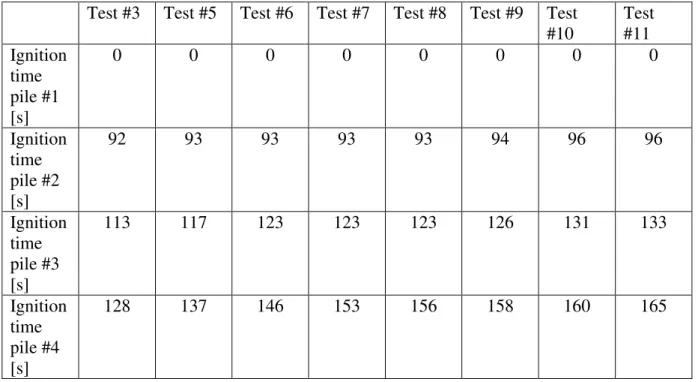
Please observe that in the case of the tests with a freight truck commodity, the ignition source was placed in the middle row (numbered 5 and 6 in table 11), thus the fire spread in both directions and for symmetrical reasons the ignition of the two rows adjacent to the fire was assumed to occur at the same time. It was also assumed that only the heat release rate of the closest row would contribute to the fire spread to the adjacent row as the rows further away would be shielded by the closest row.
Table 10. The ignition times of the individual piles of wooden pallets in the model scale tunnel tests.
Test #3 Test #5 Test #6 Test #7 Test #8 Test #9 Test #10 Test #11 Ignition time pile #1 [s] 0 0 0 0 0 0 0 0 Ignition time pile #2 [s] 92 93 93 93 93 94 96 96 Ignition time pile #3 [s] 113 117 123 123 123 126 131 133 Ignition time pile #4 [s] 128 137 146 153 156 158 160 165
Table 11. The ignition times of the individual rows of wooden pallets in the tests with a freight truck commodity.
21 Ignition time of row #5,6 [s] 0 0 0 0 Ignition time of row #4,7 [s] 153 153 153 153 Ignition time of row #3,8 [s] 306 306 306 Ignition time of row #2,9 [s] 459 459 Ignition time of row #1,10 [s] 612
The graphs of the calculated total heat release rates versus the measured heat release rates for test #6, #10, #3P(4) and #5P(8) are found below.
HRR-test#6 0 100 200 300 400 500 600 0 1 2 4 5 6 7 8 9 11 t (min) H R R ( k W ) HRR-measured HRR-calculated
Figure 12. The measured HRR versus the calculated HRR for test #6.
HRR-test#10 0 100 200 300 400 500 600 0 1 2 3 4 5 6 7 8 9 10 t (min) H R R ( k W ) HRR-measured HRR-calculated
22 As seen from figure 12 and 13 the calculated values from the tests of Hansen and Ingason [2] fits very well the measured values but tends to have too short ignition times in the case of longer distances. HRR-test#3P(4) 0 200 400 600 800 1000 1200 0 5 10 15 20 25 30 t (min) H R R ( k W ) HRR-measured HRR-calculated
Figure 14. The measured HRR versus the calculated HRR for test #3P(4).
HRR-test#5P(8) 0 200 400 600 800 1000 1200 1400 1600 1800 0 5 10 15 20 25 30 35 40 45 t (min) H R R ( k W ) HRRmeasured HRR-calculated
Figure 15. The measured HRR versus the calculated HRR for test #5P(8).
In the case of the tests of Arvidson [3] the calculated values fits very well with the measured values of test #3P(4) but in the case of the other tests it seems like the fires are ventilation controlled and not fuel controlled. Arvidson [3] also suspects in his report that the HRR was affected by the reduction of the access of fresh air.
In order to further verify the results of the methods, the total energy content of the calculated HRR curve and the energy content based upon the total mass of the involved piles of pallets were compared. A net heat of complete combustion of 17.9 MJ/kg [9] was used in the calculations. These results are summarised in table 12. One observation based on the
23 values from the tests of Arvidson [3] do not match very well which is also an indication that the fires were in fact ventilation controlled.
Table 12 Energy content calculated based on HRR curve or total mass. Test # Energy content based
on HRR curve (MJ)
Energy content based on total mass (MJ) 3 125 120 4 31 30 5 125 123 6 125 122 7 125 120 8 125 122 9 125 122 10 125 120 11 125 122 2P(2) 270 354 3P(4) 540 711 4P(6) 810 1065 5P(8) 1080 1419 6P(10) 1351 1774
Using the calculated ignition times of the adjacent piles and rows of wooden pallets the retard index values were determined. See table 13 for the results.
Table 13. The retard index values based upon the ignition times of the piles of wooden pallets. Test # n1 n2 n3 n4 n5 3 5.6 25.6 35.6 42.6 5 5.6 25.6 36.6 48.6 6 5.6 25.6 40.6 54.6 7 5.6 25.6 40.6 59.6 8 5.6 25.6 40.6 62.6 9 5.6 26.6 41.6 63.6 10 5.6 26.6 44.6 65.6 11 5.6 26.6 45.6 69.6 3P(4) 6.2 18.2 4P(6) 6.2 18.2 48.2 5P(8) 6.2 18.2 48.2 112.2 6P(10) 6.2 18.2 48.2 112.2 251.2
When comparing the retard index values with the values from the method using summation of objects HRRs, it can be seen that the results from test #11 of Hansen and Ingason [2] matches very well. The results from test #10 of Hansen and Ingason [2] match fairly well but the results of the other tests – especially those of Arvidson [3] – do not match well.
A method using ignition temperature as ignition criterion
In order to account for the heat progressively accumulated at the surface of the pile of wooden pallets, a method where an ignition temperature is used as ignition criterion was used. This
24 would most likely better account for any time delay to ignition after the critical heat flux has been reached, which the previous method do not take into account.
In Babrauskas and Grayson [10] an algorithm is described that calculates the surface temperature of a thermally thick object accounting for a transient heat flux:
∫
− ⋅ ⋅ ⋅ + = t net p a s d t q c k T t T 0 '' ( ) 1 ) ( τ τ τ ρ π & (15) Where: '' netq& is the net heat flux into the solid [kW/m²] k is the thermal conductivity [W/m·K]
ρ
is the density [kg/m³]The algorithm contains an Abel integral which was evaluated numerically using the incident heat flux, ''
flux
q& , instead of the net heat flux.
The following value was found for pine (Monterey Pine with a moisture content of 0%) [8]: - Ignition temperature: 622 K
- Density: 460 kg/m³
The following value was found for pine (moisture content of 0%) [8]: - Heat capacity: 1.8 kJ/kg·K
- Thermal conductivity: 0.185 W/m·K
When using the Abel integral on fire test #3, 5 to 11 it was found that pile #2 would not ignite as the surface temperature would not exceed 622 K. When studying the calculations it seems that the longitudinal ventilation velocity was too great in order to achieve any higher surface temperatures.
But if the ignition times of pile #2 from the calculations using the critical heat flux as ignition criterion is used and then the Abel integral is used for calculating the ignition of pile #3 higher surface temperatures are achieved and ignition will occur. See table 14 for the resulting
ignition times.
Table 14. The ignition times of pile #2 using the critical heat flux criterion and pile #3 using the ignition temperature as ignition criterion.
Test # Ignition time, pile #2 [s] Ignition time, pile #3 [s]
3 92 229 5 93 233 6 93 239 7 93 239 8 93 239 9 94 243 10 96 250 11 96 252
Table 15 lists the ignition times of pile #3 from the calculations using the critical heat flux as ignition criterion. The Abel integral is then used for calculating the ignition of pile #4.
25 Table 15. The ignition times of pile #3 using the critical heat flux criterion and pile #4 using the ignition temperature as ignition criterion.
Test # Ignition time, pile #3 [s] Ignition time, pile #4 [s]
3 113 211 5 117 220 6 123 229 7 123 235 8 123 242 9 126 239 10 131 245 11 133 248
When comparing the results from table 14 and 15 with the visually observed ignition times found in table 5, it can be seen that the method poorly determines the time of ignition when the distance between the fuel objects is small, but the accuracy improves considerably as the distance increases.
When using the Abel integral on the fire tests performed by Arvidson [3], the surface temperature of the adjacent rows of wooden pallets was found to exceed the ignition
temperature at 622 K after ~312 seconds.As it was assumed that the incident heat flux to the adjacent rows of wooden pallets consisted only of the flame radiation of the burning rows closest to the pallets in question, the ignition of the adjacent rows of wooden pallets will occur linearly with a time interval of 312 seconds. The resulting HRR curves of tests #4P(6) and #6P(10) are found below. When studying the resulting curves in figure 16 and 17 it can be seen that the calculated results matches somewhat the measured values.
HRR-test#4P(6) 0 200 400 600 800 1000 1200 0 5 10 15 20 25 30 35 t (min) H R R ( k W ) HRR-measured) HRR-calculated
26 HRR-test#6P(10) 0 200 400 600 800 1000 1200 0 5 10 15 20 25 30 35 40 45 50 t (min) H R R ( k W ) HRR-measured HRR-calculated
Figure 17. The measured HRR versus the calculated HRR for test #6P(10).
Discussion
The results of the method using the critical heat flux as ignition criteria that was presented here agreed very well with the measured values of the corresponding test fires of Hansen and Ingason [2] as well as comparing the calculated energy contents. But the method tended to have too long ignition times in the case of short distances and to have too short ignition times in the case of longer distances. Also in the case of the tests of Arvidson [3] the corresponding measured values and calculated energy contents did not match very well. One reason why the results of Arvidson [3] did not match very well could be that the test fires were most likely ventilation controlled and not fuel controlled which is a pre-requisite of the method in question.
Regarding the method using the ignition temperature as ignition criteria, the surface temperature of the adjacent piles of wooden pallets in the case of the tests of Hansen and Ingason [2] never exceeded the ignition temperature and thus ignition would not occur. But if the ignition times of pile #2 and #3 from the calculations using the critical heat flux as ignition criterion is used and then the method using an ignition temperature as ignition criterion is used for calculating the ignition of pile #3 and #4 respectively, higher surface temperatures are achieved and ignition will occur. When comparing the results with the measured results it can be seen that the method poorly determines the time of ignition when the distance between the fuel objects is small, but the accuracy improves considerably as the distance increases. This could be explained by that the ignition took place at latter stage – when the distance was increased - and therefore the amount of heat accumulated in the pile was higher.
When comparing the results of the two methods it seems like the method using the critical heat flux as ignition criterion is better suited for shorter distances between the fuel objects and cases with very rapid fire growth. The method using an ignition temperature as ignition criterion seems to be better fitted for cases where the distance to fuel objects are greater and the fire growth is smaller.
27 In cases where the distances between the fuel objects varies between short distances and longer distances, the ideal method would be to use the two methods in conjunction depending on the distance or fire growth rate in question.
In the case of the tests of Arvidson [3], ignition occurred and the results did match somewhat well with the measured values of the corresponding tests.
Conclusions
Theoretical calculations of the HRR of fire load consisting of different objects have been carried out and compared with the results from fire experiments using wood cribs. The results of the calculations can be summarised as follows:
- Two methods were presented that uses physical relationships. The first method uses a critical external heat flux as ignition criteria and the other method uses a surface temperature as ignition criteria.
- The method using the critical heat flux as ignition criteria exhibited very good
agreement with the corresponding results of performed fire experiments. But tended to have too short ignition times in the case of longer distances. This shows the feasibility of the method for the problem when constructing an overall heat release curve for variably separated piles of wooden pallets using short distances and with a
longitudinal flow in a tunnel configuration.
- The methods using the ignition temperature as ignition criteria did not agree very well with the corresponding results of performed fire experiments. But the accuracy
improved considerably as the distance between the piles of wooden pallets was increased. Thus the method shows potential when constructing an overall heat release curve for variably separated piles of wooden pallets using long distances and with a longitudinal flow in a tunnel configuration.
- The prerequisite that the burning objects should not necessarily have to be positioned at equal distance was fulfilled.
- In order to further validate the two methods, the following work is recommended: the methods presented should be compared to fire experiments showing slower fire growth. Finally, a fire experiment with a mining vehicle in an underground mine should be performed and compared with the calculated values of the two presented methods.
Acknowledgement
The project was sponsored by the Swedish Knowledge Foundation (KK-stiftelsen) and LKAB Mining Corporation.
28
References
[1] Hansen R. and Ingason H. (2010), An Engineering tool to calculate heat release rates of multiple objects in underground structures, Fire Safety Journal, present status: accepted with minor changes
[2] Hansen R. and Ingason H. (2010), Model scale fire experiments in a model tunnel with wooden pallets at varying distances, report 2010:08, Mälardalen University, Västerås
[3] Arvidson M. (2008), Down-scaled fire tests using a trailer mock-up, SP report 2008:42, Borås
[4] Li Y.Z. and Ingason H. (2010), Model scale tests with automatic sprinklers in tunnels, SP report 2010, To be published
[5] Ingason H. (2005), Model Scale Tunnel Fire Tests, SP report 2005:49, Swedish National Testing and Research Institute
[6] Ingason H. (2005), Fire Development in Large Tunnel Fires, 8th Fire Safety Science Proceedings, pp 1497-1508
[7] Numajiri F., and Furukawa K. (1998), Short Communication: Mathematical Expression of Heat Release Rate Curve and Proposal of ‘Burning Index’, Fire and Materials, vol 22, pp 39-42
[8] Babrauskas V. (2003), Ignition Handbook, Fire Science Publishers, Issaquah [9] Tewarson, A.(2002), "Generation of Heat and Chemical Compounds in Fires".
In The SFPE Handbook of Fire Protection Engineering (P. J. DiNenno, D. Drysdale, C. L. Beyler, W. D. Walton, R. L. P. Custer, J. R. Hall, and J. M. Watts, Eds.), NFPA, Quincy, USA
[10] Babrauskas V. and Grayson S.J. eds. (1992), Heat Release in Fires, Chapman and Hall, London
![Figure 2. A schematic drawing of the model tunnel [4].](https://thumb-eu.123doks.com/thumbv2/5dokorg/4741925.125774/6.892.104.798.103.707/figure-a-schematic-drawing-the-model-tunnel.webp)
![Figure 3. The measurements of the scaled down wooden pallets [3].](https://thumb-eu.123doks.com/thumbv2/5dokorg/4741925.125774/7.892.114.672.210.778/figure-measurements-scaled-wooden-pallets.webp)
![Table 1. Information on the piles of wood pallets used in the fire experiments [2].](https://thumb-eu.123doks.com/thumbv2/5dokorg/4741925.125774/9.1263.101.1177.153.782/table-information-piles-wood-pallets-used-experiments.webp)
![Figure 5. The layout of instruments and measurements (dimensions in mm) [4].](https://thumb-eu.123doks.com/thumbv2/5dokorg/4741925.125774/10.892.121.844.504.806/figure-layout-instruments-measurements-dimensions-mm.webp)
![Table 4. The results of measurements from test #3 to 11 [2].](https://thumb-eu.123doks.com/thumbv2/5dokorg/4741925.125774/12.892.96.581.997.1153/table-results-measurements-test.webp)
![Table 5. The ignition time of adjacent piles of wooden pallets [2].](https://thumb-eu.123doks.com/thumbv2/5dokorg/4741925.125774/13.892.100.580.104.237/table-ignition-time-adjacent-piles-wooden-pallets.webp)
![Table 9. Index and coefficients of the test fires by Arvidson [3] with Q& max = 0](https://thumb-eu.123doks.com/thumbv2/5dokorg/4741925.125774/18.892.102.652.938.1148/table-index-coefficients-test-fires-arvidson-amp-max.webp)