Mälardalen University Press Licentiate Theses No. 200
UTILIZING HARDWARE MONITORING TO IMPROVE
THE PERFORMANCE OF INDUSTRIAL SYSTEMS
Marcus Jägemar
2016
School of Innovation, Design and Engineering
Mälardalen University Press Licentiate Theses
No. 200
UTILIZING HARDWARE MONITORING TO IMPROVE
THE PERFORMANCE OF INDUSTRIAL SYSTEMS
Marcus Jägemar
2016
Copyright © Marcus Jägemar, 2016 ISBN 978-91-7485-203-5
ISSN 1651-9256
Printed by Arkitektkopia, Västerås, Sweden
Abstract
T
HEdrastically increasing use of Information and CommunicationsTech-nology has resulted in a growing demand for network capacity. In this Licentiate thesis, we show how to monitor, model and finally improve network performance for large industrial systems. We also show how to use modeling techniques to move performance testing to an earlier design phase, with the aim to reduce the total development time of large systems. Our first contribution is a low-intrusive method for long-term hardware characteristic measurements of production nodes located at customer sites. Our second con-tribution is a technique to mimic the hardware usage of a production envi-ronment by creating a characteristics model. The cloned envienvi-ronment makes function test suites more realistic. The goal when creating the model is to re-duce the system development time by moving late-stage performance testing to early design phases thereby improving the quality of the test environment. The third and final contribution is a network performance improvement where we dynamically trade computational capacity for a message round-trip time reduction when there are CPU cycles to spare. We have implemented an au-tomatic feedback controlled mechanism for transparent message compression resulting in improved messaging performance between interconnected network nodes. Our mechanism continuously evaluates eleven compression algorithms on message stream content and network congestion level. The message sub-system will use the compression algorithm that provides the lowest messaging time. If the message content or network load change, a new evaluation is per-formed. We have conducted several case studies in an industrial environment and verified all contributions on a large telecommunication system manufac-tured by Ericsson. System engineers frequently use the monitoring and model-ing functionality for debuggmodel-ing purposes in production environments. We have deployed all techniques in a complicated industrial legacy system with minimal impact. We show that we can provide not only a solution but a cost-effective solution, which is an important requirement for industrial systems.
Sammanfattning
T
ELEKOMMUNIKATIONSBRANCHENst˚ar just nu inf¨or en stor utmaning d¨ar kommunikationsprestanda och snabba leveranstider blir allt mer viktiga f¨or att positionera sig i den ¨okande konkurrensen. I denna li-centiatavhandling beskriver vi hur man kan observera, modellera och slutligen f¨orb¨attra kommunikationsprestandan p˚a telekommunikationssystem och andra stora industriella datorsystem. Vi visar ocks˚a hur man kan korta ner den totala utvecklingstiden genom att anv¨anda modellsystem f¨or prestandautv¨ardering i tidiga delar av utvecklingsprocessen.Det f¨orsta forskningsbidraget ¨ar en fallstudie med en effektiv metod f¨or att kontinuerligt l¨asa ut h˚ardvarukarakt¨aristik fr˚an ett produktionssatt telekom-system. Vi har inriktat oss mot tekniker med l˚ag p˚averkan p˚a det system som observeras, vilket ¨ar l¨ampligt f¨or unders¨okningar i prestandakritisk produktion-smilj¨o. Den h˚ardvarukarakt¨aristik som l¨asts ut anv¨ander vi i v˚art andra forskn-ingsbidrag d¨ar vi har skapat en exekveringsmodell som k¨or p˚a ett mindre lab-system. M˚alet med modellen ¨ar 1) att korta ner tiden mellan utvecklingsstart och prestandatester samt 2) skapa en b¨attre testmilj¨o f¨or karakt¨aristiktester. I det tredje och sista forskningsbidraget presenterar vi en metod f¨or prestanda-f¨orb¨attringar genom att selektivt komprimera meddelanden om det ger en snab-bare ¨overf¨oringstid i kommunikationssystemet. Flera komprimeringsalgorit-mer utv¨arderas kontinuerligt och den kompressionsalgoritm som ger kortast ¨overf¨oringstid anv¨ands f¨or en majoritet av meddelandena. F¨or¨andringar i med-delandestr¨ommen eller n¨atverkets utnyttjandegrad ¨overvakas l¨opande och an-v¨ands vid utv¨arderingen av de tillg¨angliga kompressionsalgoritmerna.
All programvaruutveckling och test har genomf¨orts p˚a ett industriellt tele-kommunikationssystem tillverkat av Ericsson. Alla tekniker ¨ar implementer-ade f¨or bruk i produktionsmilj¨o och monitorerings- och modelleringsfunktion-aliteten anv¨ands kontinuerligt i fels¨okningsysfte av produktionssystemet. De tekniker vi presenterar i denna avhandling ger ocks˚a en kostnadseffektiv l¨os-ning, vilket ¨ar en viktigt krav f¨or industriella system.
Acknowledgements
F
IRSTof all, I would like to thank my supervisors and co-authors, Bj¨ornLisper, Sigrid Eldh and Andreas Ermedahl for your patience and help-ful discussions during my studies. I would also like to express grat-itude towards my manager, Magnus Schlyter, who has always supported me throughout the work on this thesis. The work presented in this Licentiate the-sis has been funded by Ericsson and the Swedish Knowledge Foundation (KK stiftelsen) through the ITS-EASY program at M¨alardalen University.
Furthermore, thanks to all students in the ITS-EASY research group, we all share the ups and downs of studying for a PhD; Apala Ray, Daniel Hallmans, Daniel Kade, David Rylander, Eduard Paul Eniou, Fredrik Ekstrand, Gaetana Sapienza, Kristian Wiklund, Markus Wallmyr, Mehrdad Saadatmand, Melika Hozhabri, Sara Dersten, Stephan Baumgart, and Tomas Olsson.
I would also like to thank my additional co-authors: Bj¨orn Lisper, Sigrid Eldh, Andreas Ermedahl, Gordana Dodig-Crnkovic, Rafia Inam, Mikael Sj¨odin, Daniel Hallmans, Stig Larsson and Thomas Nolte. I really enjoyed working with you. I have the greatest gratitude to my parents; my mother and father who always wanted me to study hard to become something they never could.
Finally and foremost, I want to express my endless love for Karolinn and our three daughters, Amelie, Lovisa and Elise. I would not have been able to write this thesis without your support and encouragement.
Marcus J¨agemar Sigtuna, May 2016
List of Publications
Included Publications
A Marcus J¨agemar, Sigrid Eldh, Andreas Ermedahl, Bj¨orn Lisper and Gabor Andai. Automatic Load Synthesis for Performance
Verifica-tion in Early Design Phases. Technical Report, 2016. [68].
This technical report, quoted in Chapter 7, is an extension of the al-ready published papers C [64], E [65] and the technical report I [63]. B Marcus J¨agemar, Sigrid Eldh, Andreas Ermedahl and Bj¨orn Lisper.
Automatic Message Compression with Overload Protection. In press:
Journal of Systems and Software, 2016. [67].
This paper, quoted in Chapter 8, is an extension of the already pub-lished paper G [66].
Changes to Included Publications
Papers A and B are quoted in full but have been reformatted to fit the layout of this thesis. Chapter 5, includes related work sections of both papers. In a similar fashion, Chapter 6 contains future work from both papers.
x
Other Publications
C Marcus J¨agemar, Sigrid Eldh, Andreas Ermedahl and Bj¨orn Lisper.
Towards Feedback-Based Generation of Hardware Characteristics.
In Proceedings of the International Workshop on Feedback Comput-ing, 2012. [64]
D Rafia Inam, Mikael Sj¨odin and Marcus J¨agemar. Bandwidth
Mea-surement using Performance Counters for Predictable Multicore Soft-ware. Proceedings of the International Conference on Emerging
Tech-nologies and Factory Automation (ETFA12), 2012. [58]
E Marcus J¨agemar, Sigrid Eldh, Andreas Ermedahl and Bj¨orn Lisper.
Automatic Multi-Core Cache Characteristics Modelling. In
Proceed-ings of the Swedish Workshop on Multicore Computing, Halmstad, 2013. [65]
F Daniel Hallmans, Marcus J¨agemar, Stig Larsson and Thomas Nol-te. Identifying Evolution Problems for Large Long Term Industrial
Evolution Systems. In Proceedings of IEEE International Workshop
on Industrial Experience in Embedded Systems Design, V¨aster˚as, 2014. [54]
G Marcus J¨agemar, Sigrid Eldh, Andreas Ermedahl and Bj¨orn Lisper.
Autonomous Feedback Controlled Message Compression. In
Pro-ceedings of Computers, Software and Applications Conference (COMPSAC), V¨aster˚as, 2014. [66]
H Marcus J¨agemar and Gordana Dodig-Crnkovic Cognitively
Sustain-able ICT with Ubiquitous Mobile Services - Challenges and Oppor-tunities. In Proceedings of the International Conference on Software
Engineering (ICSE), Firenze, Italy, 2015. [62]
Other Technical Reports
I Marcus J¨agemar, Sigrid Eldh, Andreas Ermedahl and Bj¨orn Lisper.
Technical Report : Feedback-Based Generation of Hardware Char-acteristics, 2012. [63].
Key Concepts
Table 1 lists the most common abbreviations used throughout this thesis. Key Concept Description
2G (GSM) The second generation telecom network, 1991, intro-duced digital communication.
3G The third telecom network generation, 1998, enabled large scale digital communication with increased band-width and service availability.
3GPP 3GPP is a standardization organization created by the telecommunication industry. 3GPP aims to create a global standard that is used for development and main-tenance of telecommunication systems.
4G (LTE) Long Term Evolution is the fourth generation telecom-munication network, 2008, with increased capacity. Action
Re-search (AR) A research method where the researcher is an active partof an incremental procedure (plan, act/observe and re-flect), which is repeatedly used to improve the object being investigated. AR was first expressed in 1946 by Lewin [83]
ASIC Application Specific Integrated Circuits are circuits that can be pre-programmed with specific functionality
Continued on next page →
xiv
← Continued from previous page
Abbreviation Description
Capacity As specified by the Oxford English dictionary; “Ability
to receive or contain; holding power”. We use the phrase in this thesis as the maximum available. We use capacity
as a description of the maximal capability of a resource. Compression
Ratio Compression ratio is denoted as cr =
sizeuncompr
sizecompr . A
high cr means that the compressed data is smaller than
the uncompressed.
COTS Common Off The Shelf are devices that does not need to be tailored for a specific need, they can be bought from other device manufacturer that produce common hard-ware for many purposes.
CPI Cycles Per Instruction is a metric to determine the per-formance of a computer system. An average estimation explains how large part of total exection can be attributed to different execution parts, such as cache misses, branch misses, TLB misses etc. Eyerman, Eeckhout and Karkha-nis provides a good explanation a paper [40] explaining a modern CPI structure.
Five Nines 99.999% uptime, which results maximum of approx. 5 min downtime per year.
FPGA Field Progrmmable Arrays are generic circuits that can be programmed in runtime with new functionality. HW HW is a simple abbreviation for hardware, which means
all physical parts in the network, including computers, cables, circuit-boards etc.
ICT Information Communication Technology that makes it possible for people to communicate and easily access in-formation.
Continued on next page →
xv
← Continued from previous page
Abbreviation Description Low-intrusive
Monitoring The monitoring mechanism does not affect the behavioror performance of the monitored system. There is no no-ticeable effect on the system.
Node A computer designed for message processing, which is part of a telecommunication system.
Performance As specified by the Oxford English dictionary; “The
quality of execution of such an action, operation, or pro-cess; the competence or effectiveness of a person or thing in performing an action; spec. the capabilities, produc-tivity, or success of a machine, product, or person when measured against a standard.” [93]. More specifically;
a quantifiable metric on how good a particular action is performed.
PID
Controller Proportional Integrative Controller [12]. Production
Node One node that is running at a customer site handling realend-user traffic. Superscalar
Processors Low-level instructions can be executed in parallel toachieve higher performance, typically more than one in-struction per clock cycle. The first commercial appear-ance was in 1988 with Intel i960CA [85].
SW As specified by the Oxford English dictionary; ”The
pro-grams and procedures required to enable a computer to perform a specific task, as opposed to the physical com-ponents of the system” [93]
Test Node Test nodes are typically smaller than production nodes and usually only accessible by corporate personnel. Eco-nomic reasons and keeping debugging simple drive the demand to keep test nodes being small.
xiv
← Continued from previous page
Abbreviation Description
Capacity As specified by the Oxford English dictionary; “Ability
to receive or contain; holding power”. We use the phrase in this thesis as the maximum available. We use capacity
as a description of the maximal capability of a resource. Compression
Ratio Compression ratio is denoted as cr =
sizeuncompr
sizecompr . A
high crmeans that the compressed data is smaller than
the uncompressed.
COTS Common Off The Shelf are devices that does not need to be tailored for a specific need, they can be bought from other device manufacturer that produce common hard-ware for many purposes.
CPI Cycles Per Instruction is a metric to determine the per-formance of a computer system. An average estimation explains how large part of total exection can be attributed to different execution parts, such as cache misses, branch misses, TLB misses etc. Eyerman, Eeckhout and Karkha-nis provides a good explanation a paper [40] explaining a modern CPI structure.
Five Nines 99.999% uptime, which results maximum of approx. 5 min downtime per year.
FPGA Field Progrmmable Arrays are generic circuits that can be programmed in runtime with new functionality. HW HW is a simple abbreviation for hardware, which means
all physical parts in the network, including computers, cables, circuit-boards etc.
ICT Information Communication Technology that makes it possible for people to communicate and easily access in-formation.
Continued on next page →
xv
← Continued from previous page
Abbreviation Description Low-intrusive
Monitoring The monitoring mechanism does not affect the behavioror performance of the monitored system. There is no no-ticeable effect on the system.
Node A computer designed for message processing, which is part of a telecommunication system.
Performance As specified by the Oxford English dictionary; “The
quality of execution of such an action, operation, or pro-cess; the competence or effectiveness of a person or thing in performing an action; spec. the capabilities, produc-tivity, or success of a machine, product, or person when measured against a standard.” [93]. More specifically;
a quantifiable metric on how good a particular action is performed.
PID
Controller Proportional Integrative Controller [12]. Production
Node One node that is running at a customer site handling realend-user traffic. Superscalar
Processors Low-level instructions can be executed in parallel toachieve higher performance, typically more than one in-struction per clock cycle. The first commercial appear-ance was in 1988 with Intel i960CA [85].
SW As specified by the Oxford English dictionary; ”The
pro-grams and procedures required to enable a computer to perform a specific task, as opposed to the physical com-ponents of the system” [93]
Test Node Test nodes are typically smaller than production nodes and usually only accessible by corporate personnel. Eco-nomic reasons and keeping debugging simple drive the demand to keep test nodes being small.
Contents
I
Thesis
3
1 Introduction 7
1.1 Monitoring a Production System . . . 8
1.2 Modeling a Production System . . . 8
1.3 Improving the Communication System . . . 9
1.4 Outline . . . 10
2 Background 15 2.1 Telecommunication Standards . . . 17
2.2 Telecommunication Services . . . 19
2.3 Industrial Systems . . . 20
2.4 Deploying Our Target System . . . 23
2.5 System Details . . . 25
3 Research Summary 33 3.1 Research Questions . . . 34
3.1.1 System Monitoring . . . 34
3.1.2 System Modeling . . . 34
3.1.3 Improving System Performance . . . 35
3.2 Delimitations . . . 36 3.3 Achievements . . . 37 3.3.1 System Monitoring . . . 37 3.3.2 System Modeling . . . 41 3.3.3 System Improvement . . . 43 3.3.4 Message Compression . . . 44 3.4 Research Methodology . . . 46 xvii
xviii Contents 3.5 Threats to Validity . . . 47 3.5.1 Construct Validity . . . 48 3.5.2 Internal Validity . . . 48 3.5.3 Conclusion Validity . . . 49 3.5.4 Method Applicability . . . 49 4 Contributions 53 4.1 Publication Mapping . . . 54
4.2 Publication Hierarchy and Timeline . . . 55
4.3 Paper A (Based on Papers C, E and I) . . . 56
4.4 Paper B (Based on Paper G) . . . 57
5 Related Work 61 5.1 System Monitoring . . . 62
5.2 System Modeling . . . 63
5.3 Message and Data Compression . . . 65
5.4 Adaptive Compression . . . 66
6 Conclusion and Future Work 71 6.1 Conclusion . . . 72
6.2 Future Work . . . 73
Bibliography 74
II
Included Papers
89
7 Automatic Load Synthesis for Performance Verification in Early Design Phases 93 7.1 Introduction . . . 95 7.2 Background . . . 96 7.3 Method . . . 99 7.3.1 Method Details . . . 101 7.4 Target System . . . 1027.4.1 Target System Details . . . 103
7.5 Implementation . . . 104
7.5.1 The Characteristics Monitor . . . 105
7.5.2 The CPI Stack . . . 106
7.5.3 The Load Controller . . . 107
7.5.4 Generating L1 I-cache Misses . . . 110
Contents xix 7.5.5 Generating L1 and L2 Data Cache Misses . . . 110
7.5.6 Experimental Setup . . . 111
7.6 Results . . . 111
7.6.1 Running The Test Application With The Load Generator113 7.6.2 Production vs. Modeled Characteristics . . . 113
7.6.3 System Performance Measurement . . . 116
7.6.4 Performance Prediction When Switching OS . . . 117
7.7 Related Work . . . 122
7.8 Future Work . . . 124
7.9 Conclusions . . . 126
References . . . 126
8 Automatic Message Compression with Overload Protection 132 8.1 Introduction . . . 134
8.1.1 Definitions . . . 136
8.2 Problem Formulation and System Model . . . 136
8.3 Adaption . . . 139
8.3.1 The Communication Procedure . . . 140
8.3.2 Network Measurements . . . 141
8.3.3 Compression Measurements . . . 141
8.3.4 Selecting the Best Compression Algorithm . . . 142
8.3.5 Compression Throttling . . . 143
8.4 Test System Setup . . . 145
8.4.1 The Test System . . . 145
8.4.2 Compression Algorithms . . . 146
8.4.3 Putting it All Together . . . 148
8.4.4 Real-World Compression Throttling . . . 150
8.5 Results . . . 151
8.5.1 Automatic Compression . . . 151
8.5.2 Algorithm Selection Methods . . . 153
8.5.3 Automatic Algorithm Selection for Changing Message Streams . . . 154 8.5.4 Overload Handling . . . 156 8.6 Related Work . . . 157 8.7 Future Work . . . 160 8.8 Conclusions . . . 161 References . . . 162
I
Thesis
I
Thesis
More and better collaboration between academia and the software industry is an important means of achieving the goals of more studies with high quality and relevance and better transfer of re-search results.
More and better collaboration between academia and the software industry is an important means of achieving the goals of more studies with high quality and relevance and better transfer of re-search results.
1
Introduction
W
Ehave investigated how to improve the communication performance of a large-scale telecommunication system [13] with a major market share [121]. Our most important driving force is the ever increasing demand for higher communication capacity. Mobile operators are compelled to make significant investments in more efficient and powerful telecommuni-cation equipment to meet the requests from end-users. As a telecommunica-tion equipment manufacturer, it is getting increasingly important to enhance the system performance continuously, both for current implementations and by developing new infrastructure. We describe the findings from our work on increasing the capacity of a large-scale telecommunication system. We have focused on two ways to improve the communication performance.The first improvement area investigated by us is how to achieve higher sys-tem capacity by increasing the release rate for new software and hardware. Our method is to reduce the development time by running performance verification earlier in the development process. Many development processes do perfor-mance verification at the end of the development phase. Our suggestion is to monitor the hardware characteristics of production systems, Section 1.1, and then synthesize a hardware usage model, Section 1.2. By using this model, it is possible to test a large part of the performance of newly developed software during the design phase, thus reducing the total development time.
As a second improvement area, we have designed, implemented and used a characteristics measurement tool to systematically monitor and improve the performance of selected subsystems. In this thesis, we have addressed one per-formance problem where we have reduced the round-trip message time through selective message compression, Section 1.3.
8 Chapter 1. Introduction
1.1 Monitoring a Production System
We have implemented a characteristics monitoring tool aimed for running at customer sites. Our goal with the monitoring tool was to get a better under-standing of real-world systems by sampling hardware (HW) characteristics.
Our monitor samples HW events from the CPU or any other low-level HW components. We have grouped these events into sets that represent a certain type of behavior, for example, cache-usage, TLB-usage, cycles per instruction. Running a monitoring tool in a production environment pose special re-strictions and requirements such as:
• It must be possible to run the monitor simultaneously to the production
system.
• The monitor must have a low probe-effect [43] since it is not allowed to
affect the behavior and performance of production system.
• The monitor must be able to capture long time intervals because the
sys-tem behavior changes slowly depending on end-customer usage. We have addressed the production environment constraints by being very re-strictive when implementing the monitoring application. First, we implemented our application as simple as possible. It is vital that no undesired behavior or faults occur when running in a sensitive environment. Secondly, we have cho-sen a low HW event sample frequency (1Hz) to reduce the probe effect. The sampling frequency is sufficient for the slowly changing behavior of our target system.
1.2 Modeling a Production System
We have devised a method that automatically synthesize an HW characteristics model from data obtained by the monitoring tool, see Section 1.1. The model can replicate the HW usage of the production system.
Our goal was to create an improved test suite consisting of an HW charac-teristics model together with a functional test suite. Our assumption was that a test suite covering both the functional- and the characteristics perspective should improve testing in the early stages of system development. Improving the test suite should also make it possible to discover, primarily performance related, bugs earlier in the development process. Finding bugs in the early
1.3 Improving the Communication System 9
design phases adheres well to the desire of reducing the total system develop-ment time since bug-fixing becomes much more difficult and time-consuming further from the introduction of the bug.
Our method uses a Proportional Integrative Derivative (PID) controller [12] to synthesize automatically the model from the HW characteristics data ob-tained through our monitoring tool. No manual intervention is needed. The overall method is generic and supports any hardware characteristics. The sys-tem we have investigated is IO-bound and mostly limited by cache and memory bandwidth. We have implemented one PID-control loop per characteristics en-tity. In our model, we have used L1-Instruction, L1-Data and L2-Data cache usage to represent the behavior of the system.
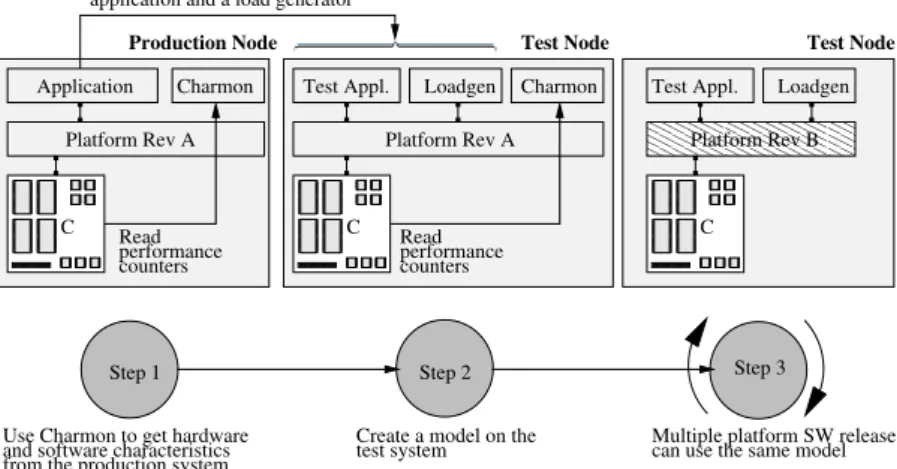
We have evaluated our monitoring and modeling method by synthesizing a model for L1 Instruction-, L1 Data-, and L2 Data cache misses according to the hardware characteristics extracted from a running production system. We have successfully tested the model on a test node together with an unmodi-fied functional test suite. Our experiments show that using our characteristics model during the test of a production system bug fix causes the detected mes-sage round-trip time to increase by 10.8%. Using the traditional performance measurement tests results in a 0.75% RTT increase, which may be a too small change to be detectable in an automated test suite.
1.3 Improving the Communication System
We have contrived and implemented a mechanism to automatically find and use a compression algorithm that provides the shortest message Round-Trip Time (RTT).
Our goal, when performing this work, was to improve the communication performance of our target system. We had already implemented the monitoring tool, Section 1.1, and the characteristics model, Section 1.2 and could use these tools for performance measurements.
We added a software metric to our monitoring tool, measuring message RTT. We could deduce that 1) The message RTT varied depending on the net-work congestion levels and 2) The hardware usage varied but was relatively low in certain conditions. Our assumption was that we could trade computational capacity for an increased messaging capacity by using message compression. We defined some critical considerations such as:
8 Chapter 1. Introduction
1.1 Monitoring a Production System
We have implemented a characteristics monitoring tool aimed for running at customer sites. Our goal with the monitoring tool was to get a better under-standing of real-world systems by sampling hardware (HW) characteristics.
Our monitor samples HW events from the CPU or any other low-level HW components. We have grouped these events into sets that represent a certain type of behavior, for example, cache-usage, TLB-usage, cycles per instruction. Running a monitoring tool in a production environment pose special re-strictions and requirements such as:
• It must be possible to run the monitor simultaneously to the production
system.
• The monitor must have a low probe-effect [43] since it is not allowed to
affect the behavior and performance of production system.
• The monitor must be able to capture long time intervals because the
sys-tem behavior changes slowly depending on end-customer usage. We have addressed the production environment constraints by being very re-strictive when implementing the monitoring application. First, we implemented our application as simple as possible. It is vital that no undesired behavior or faults occur when running in a sensitive environment. Secondly, we have cho-sen a low HW event sample frequency (1Hz) to reduce the probe effect. The sampling frequency is sufficient for the slowly changing behavior of our target system.
1.2 Modeling a Production System
We have devised a method that automatically synthesize an HW characteristics model from data obtained by the monitoring tool, see Section 1.1. The model can replicate the HW usage of the production system.
Our goal was to create an improved test suite consisting of an HW charac-teristics model together with a functional test suite. Our assumption was that a test suite covering both the functional- and the characteristics perspective should improve testing in the early stages of system development. Improving the test suite should also make it possible to discover, primarily performance related, bugs earlier in the development process. Finding bugs in the early
1.3 Improving the Communication System 9
design phases adheres well to the desire of reducing the total system develop-ment time since bug-fixing becomes much more difficult and time-consuming further from the introduction of the bug.
Our method uses a Proportional Integrative Derivative (PID) controller [12] to synthesize automatically the model from the HW characteristics data ob-tained through our monitoring tool. No manual intervention is needed. The overall method is generic and supports any hardware characteristics. The sys-tem we have investigated is IO-bound and mostly limited by cache and memory bandwidth. We have implemented one PID-control loop per characteristics en-tity. In our model, we have used L1-Instruction, L1-Data and L2-Data cache usage to represent the behavior of the system.
We have evaluated our monitoring and modeling method by synthesizing a model for L1 Instruction-, L1 Data-, and L2 Data cache misses according to the hardware characteristics extracted from a running production system. We have successfully tested the model on a test node together with an unmodi-fied functional test suite. Our experiments show that using our characteristics model during the test of a production system bug fix causes the detected mes-sage round-trip time to increase by 10.8%. Using the traditional performance measurement tests results in a 0.75% RTT increase, which may be a too small change to be detectable in an automated test suite.
1.3 Improving the Communication System
We have contrived and implemented a mechanism to automatically find and use a compression algorithm that provides the shortest message Round-Trip Time (RTT).
Our goal, when performing this work, was to improve the communication performance of our target system. We had already implemented the monitoring tool, Section 1.1, and the characteristics model, Section 1.2 and could use these tools for performance measurements.
We added a software metric to our monitoring tool, measuring message RTT. We could deduce that 1) The message RTT varied depending on the net-work congestion levels and 2) The hardware usage varied but was relatively low in certain conditions. Our assumption was that we could trade computational capacity for an increased messaging capacity by using message compression. We defined some critical considerations such as:
10 Chapter 1. Introduction
• The compression algorithm must be selected automatically because the
message content can change over time and depend on the location of system deployment.
• Our mechanism should only use message compression if there are
com-putational resources to spare since other co-located services should not starve.
• Our mechanism must handle overload situations with grace and message
compression can be resumed when the system has returned to normal operation.
Our implementation automatically selects the most efficient compression algorithm depending on the current message content, CPU-load and network congestion level. We have evaluated our implementation by using production system communication data gathered at customer sites and replayed it in a lab (with explicit customer concent). Our experiment shows that the automatic compression mechanism produces a 9.6% reduction in RTT and that it is re-silient to manually induced overload situations.
1.4 Outline
The thesis consists of two major parts. The first part puts our research into its context and explains the method we have used. The second part contains the scientific papers covered in the thesis.
Part I starts at Chapter 1 with an introduction to performance benchmarking and modeling of hardware behavior of industrial systems. The thesis continues in Chapter 2 with further explanations of our target system. We describe stan-dards and functionality supported by the telecommunication system we have investigated. We also describe system setup, design, and structure.
In Chapter 3 we give a detailed summary of our research problems, re-search questions, and rere-search methodology. A summary of our contributions is presented in Chapter 4. We further contextualize this thesis by reviewing re-lated work in Chapter 5. Chapter 6 concludes part I of the thesis by describing findings and references to future work.
Part II begins with Chapter 7 where Paper A describes how to monitor and model parts of a large scale industrial system. Chapter 8 includes Paper B that describe how to improve the performance of a telecommunication system by using online message compression.
I believe that many events in my work and life have been a matter of luck or accident. But I am also aware of several occasions on which I explicitly made choices to step off the obvious path, and do something that others thought odd or worse. . . I have come to think of these events as ’detours’ from the obvious career paths stretching before me. Frequently these detours have become the main road for me. There are obvious costs to such detours. Other choices might have made me richer, more influential, more famous, more productive, and so on. But I like what I am doing, even though the path has involved a lot of wandering through uncharted territory.
— L.D. Brown1
2
Background
I
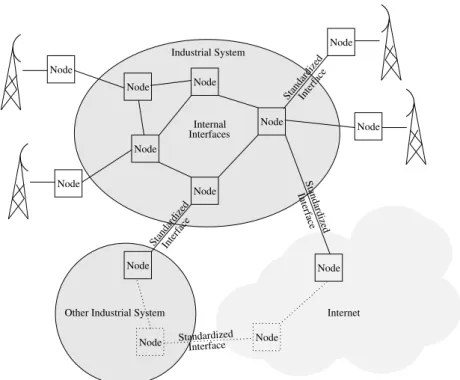
Nthis chapter, we will further describe our target system. We start by list-ing telecommunication standards, Section 2.1, and how they relate to cur-rent and future telecommunication services, Section 2.2. The platform we have worked with supports various standards spanning from 2G (GSM) via 3G (UMTS, WCDMA) and 4G (LTE) and further towards the current 5G standard. The main driver for new communication standards is the growing demand for higher communication bandwidth. Both traffic applications and remote control of equipment require low message latency and power efficient communication. We continue, in Section 2.3, by defining our view of large-scale industrial systems. Such systems have common attributes such as 1) low acceptance for system faults, 2) many simultaneously deployed software and hardware gen-erations within one system, 3) long lifetime spanning several decades, 4) very large size and complexity, and 5) continuous development over the complete system lifespan.Section 2.4 illustrates our production system, which is an example of a large-scale industrial system. We show several deployment scenarios and the effect on system complexity. A complete production system spans from single circuit boards with one CPU up to multiple circuit boards with a total of several thousand of CPU’s.
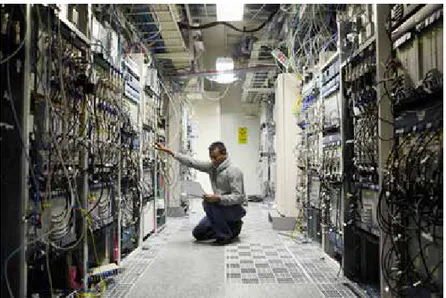
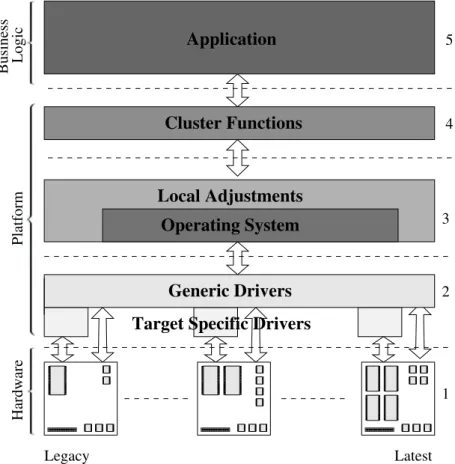
We conclude this chapter, Section 2.5, with a detailed description of our target system. The system we have investigated has a layered structure using many different programming languages and has continuously been developed during several decades. It is a very large system that is fault-tolerant with high requirements on uptime and robustness.
2
Background
I
Nthis chapter, we will further describe our target system. We start by list-ing telecommunication standards, Section 2.1, and how they relate to cur-rent and future telecommunication services, Section 2.2. The platform we have worked with supports various standards spanning from 2G (GSM) via 3G (UMTS, WCDMA) and 4G (LTE) and further towards the current 5G standard. The main driver for new communication standards is the growing demand for higher communication bandwidth. Both traffic applications and remote control of equipment require low message latency and power efficient communication. We continue, in Section 2.3, by defining our view of large-scale industrial systems. Such systems have common attributes such as 1) low acceptance for system faults, 2) many simultaneously deployed software and hardware gen-erations within one system, 3) long lifetime spanning several decades, 4) very large size and complexity, and 5) continuous development over the complete system lifespan.Section 2.4 illustrates our production system, which is an example of a large-scale industrial system. We show several deployment scenarios and the effect on system complexity. A complete production system spans from single circuit boards with one CPU up to multiple circuit boards with a total of several thousand of CPU’s.
We conclude this chapter, Section 2.5, with a detailed description of our target system. The system we have investigated has a layered structure using many different programming languages and has continuously been developed during several decades. It is a very large system that is fault-tolerant with high requirements on uptime and robustness.
16 Chapter 2. Background
Telecom.
Standard Max DownLink Speed FirstIntrod. Main Features 1G (NMT,
C-Nets, AMPS, TACS)
- Early
1980 Several different analog stan-dards for mobile voice tele-phony.
2G (GSM) 14.4kbit/s circuit switched, 22.8kbit/s packet data [45]
1991 The first mobile phone network using digital radio. Introduced services such as SMS.
→ GPRS 30–100kbit/s 2000 Increased bandwidth over GSM.
→ EDGE 236,8 kbit/s 2003 Increased bandwidth over GSM-GPRS.
3G (UMTS, WCDMA)
384kbit/s 2001 Mobile music and other types of smart-phone apps started to be used through more advanced smart-phones, which changed awareness and increased com-munication bandwidth.
→ HSPA 14.4–672Mbit/s [90] 2010 Increased bandwidth over 3G. 4G (LTE) 100Mbit/s–1Gbit/ 2009 Mobile video.
5G 1Gbit/s to many users
simultaneously 2018 Massive deployment of highbandwidth to mobile users, smart homes, high definition video transmission.
Table 2.1: The most important telecommunication standards and their commu-nication bandwidth linked to the main features introduced by the standard..
2.1 Telecommunication Standards 17
2.1 Telecommunication Standards
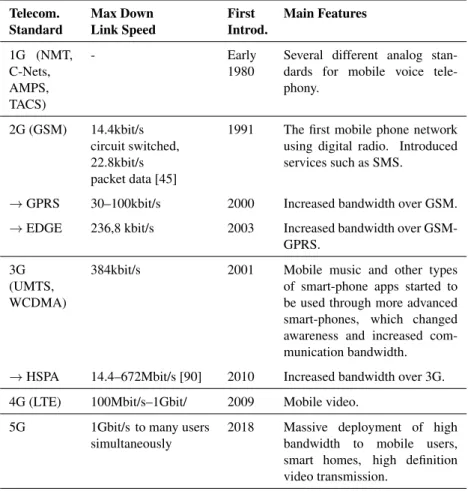
Telecommunication systems are complex because they implement several com-munication standards. Standards define how systems should interact and is a fundamental tool when connecting different manufacturer’s systems. The stan-dards continuously evolve to reflect customer demands, which drive equipment manufacturer to continually develop new features and system improvements. Several standards execute concurrently for efficiency reasons. See Table 2.1 for a list of telecommunication standards and their main features.
Groupe Sp´ecial Mobile (GSM) [120] (2G) was introduced in 1991 and pro-vided the second generation of mobile communication. It was the first commer-cial and widely available mobile communication system that supported digital communication [97]. Needless to say, the GSM system was an astonishing commercial success with 1B subscribers in 2002 [123] and 3.5B [52] in 2009. The introduction of GSM changed the way people communicate by allowing a significant portion of the population in industrialized countries to use mobile phones. Several extensions to the GSM standard, GPRS, and EDGE, further increased the communication bandwidth, thus allowing the implementation of even more complex services.
In 2001, the third generation (3G) standard was introduced as a response to customer demands for further increased bandwidth. The 3G standard is also known as Universal Mobile Telecommunication System (UMTS).
A fourth increment (4G) of the telecommunication standard, also called Long Term Evolution (LTE) [61], was introduced to the market in 2009. At this point, a large part of the industrialized world had adapted the “always-online” paradigm. The society, as a whole, looks favorably on mobile broadband and social networking services [62] demanding higher capacity in the telecommu-nication infrastructure.
Today, in 2016, we are standing on the brink of the next telecommunication standard to be implemented (5G). It is estimated to be released to the market in 2020 with substantial improvements compared to LTE [14]. The first improve-ment is a massive increase in bandwidth when there are many simultaneous users. A drastically reduced latency (below 1ms) is needed to support traffic safety and industrial infrastructure processes [36]. There is also an increasing demand for a reduction of energy consumption [21] so that it is environmen-tally friendly [37], while also making it possible to install network nodes in remote places [38] with scarce power supply.
16 Chapter 2. Background
Telecom.
Standard Max DownLink Speed FirstIntrod. Main Features 1G (NMT,
C-Nets, AMPS, TACS)
- Early
1980 Several different analog stan-dards for mobile voice tele-phony.
2G (GSM) 14.4kbit/s circuit switched, 22.8kbit/s packet data [45]
1991 The first mobile phone network using digital radio. Introduced services such as SMS.
→ GPRS 30–100kbit/s 2000 Increased bandwidth over GSM.
→ EDGE 236,8 kbit/s 2003 Increased bandwidth over GSM-GPRS.
3G (UMTS, WCDMA)
384kbit/s 2001 Mobile music and other types of smart-phone apps started to be used through more advanced smart-phones, which changed awareness and increased com-munication bandwidth.
→ HSPA 14.4–672Mbit/s [90] 2010 Increased bandwidth over 3G. 4G (LTE) 100Mbit/s–1Gbit/ 2009 Mobile video.
5G 1Gbit/s to many users
simultaneously 2018 Massive deployment of highbandwidth to mobile users, smart homes, high definition video transmission.
Table 2.1: The most important telecommunication standards and their commu-nication bandwidth linked to the main features introduced by the standard..
2.1 Telecommunication Standards 17
2.1 Telecommunication Standards
Telecommunication systems are complex because they implement several com-munication standards. Standards define how systems should interact and is a fundamental tool when connecting different manufacturer’s systems. The stan-dards continuously evolve to reflect customer demands, which drive equipment manufacturer to continually develop new features and system improvements. Several standards execute concurrently for efficiency reasons. See Table 2.1 for a list of telecommunication standards and their main features.
Groupe Sp´ecial Mobile (GSM) [120] (2G) was introduced in 1991 and pro-vided the second generation of mobile communication. It was the first commer-cial and widely available mobile communication system that supported digital communication [97]. Needless to say, the GSM system was an astonishing commercial success with 1B subscribers in 2002 [123] and 3.5B [52] in 2009. The introduction of GSM changed the way people communicate by allowing a significant portion of the population in industrialized countries to use mobile phones. Several extensions to the GSM standard, GPRS, and EDGE, further increased the communication bandwidth, thus allowing the implementation of even more complex services.
In 2001, the third generation (3G) standard was introduced as a response to customer demands for further increased bandwidth. The 3G standard is also known as Universal Mobile Telecommunication System (UMTS).
A fourth increment (4G) of the telecommunication standard, also called Long Term Evolution (LTE) [61], was introduced to the market in 2009. At this point, a large part of the industrialized world had adapted the “always-online” paradigm. The society, as a whole, looks favorably on mobile broadband and social networking services [62] demanding higher capacity in the telecommu-nication infrastructure.
Today, in 2016, we are standing on the brink of the next telecommunication standard to be implemented (5G). It is estimated to be released to the market in 2020 with substantial improvements compared to LTE [14]. The first improve-ment is a massive increase in bandwidth when there are many simultaneous users. A drastically reduced latency (below 1ms) is needed to support traffic safety and industrial infrastructure processes [36]. There is also an increasing demand for a reduction of energy consumption [21] so that it is environmen-tally friendly [37], while also making it possible to install network nodes in remote places [38] with scarce power supply.
18 Chapter 2. Background 0 2 4 6 8 10 12 2010 2011 2012 2013 2014 2015 2016 2017 2018 2019 Tr affi c [ ExaB yt es ] Voice Communication Mobile Phone Data Mobile Computer Data
(a) Voice and data traffic.
0 2 4 6 8 10 12 14 16 18 20 2010 2011 2012 2013 2014 2015 2016 2017 2018 2019 Tr affi c [ ExaB yt es ] Sum Video Audio,Web,File sharing, Social Networking Services
(b) Mobile application traffic.
Figure 2.1: World-wide market outlook for mobile traffic 2010 – 2019 [34]. Previously published in Paper H [62].
0.2 0.4 0.6 0.8 1 1.2 Jan-2 00 8 Jul-2 00 8 Jan-2 00 9 Jul-2 00 9 Jan-2 01 0 Jul-2 01 0 Jan-2 01 1 Jul-2 01 1 Jan-2 01 2 Jul-2 01 2 Jan-2 01 3 Jul-2 01 3 Jan-2 01 4 Jul-2 01 4 0 20 40 60 80 100 Available A pps [Mx#] D ownlo ade d A pps [ Bx# ]
Available Apple Apps Available Google Apps Apple Downloads Google Downloads
Figure 2.2: Download-statistics for mobile phone application [1,9,10,59,118]. Previously published in Paper H [62].
2.2 Telecommunication Services 19
2.2 Telecommunication Services
The introduction of mobile phones quicky made voice communication the most important service. It was the natural way to extend the already existing wire bound voice service into the mobile era. Voice services have now reached its peak from a capacity perspective [34], see Figure 2.1a. It is also apparent that data communication is rapidly increasing for both mobile phones and mobile computers. A report [35] by Ericsson Consumer Lab attributes the increased data usage to three main usage areas:
• Streaming services are quickly gaining acceptance among the population
and include on-demand services such as music, pay-per-view TV and movies. Ericsson estimates that mobile video will be one of the most requested services in the coming years (2010–2019), see Figure 2.1b.
• Home appliance monitoring is increasing rapidly. For example water
flood monitoring, heat and light control, refrigerator warning systems, coffee-machine refill sensors, entry and leave detection and much more.
• Data usage are expected to increase further at a rapid pace with the use
of Information Communication Technology (ICT) devices such as mobile phones, watches, tablets and laptops. There is a common acceptance to use ICT devices for a large portion of daily activities [24] such as bank transactions, purchases, navigation, etc. The use of devices is expected to further increase the utilization of telecommunication networks [129]. The extraordinary increase in download rate of mobile apps indicates the acceptance of mobile usage among people, see Figure 2.2.
• Vehicle communication to support self-driving cars [36] and automated
vehicle fleet management [37].
• Reduced network latency is needed to implement Industrial infrastruct-ure [36] operations over wireless networks.
The overall increase in geographical and population coverage paired with new services, such as the ones described above, will contribute to an enormous growth in mobile data traffic. The geographical coverage is in 2014 mainly fo-cused on Europe and USA with Asia, mainly India and China, quickly catching up and surpassing [37]. In 2015 there were approx. 7.4(3.4)1 billion mobile subscribers world-wide and it is estimated that there will be 9.1(6.4) billion subscriptions by 2021 [37]. Increasing both geographical and population cov-erage causes an unprecedented change in global mobile data usage, which is currently one of the biggest challenges for network operators.
![Figure 2.1: World-wide market outlook for mobile traffic 2010 – 2019 [34].](https://thumb-eu.123doks.com/thumbv2/5dokorg/4776195.127563/40.718.108.561.172.442/figure-world-wide-market-outlook-mobile-traffic.webp)