For statistics on generation of waste and
recovery and disposal of waste in Sweden 2006
report 5842 • June 2008
For statistics on generation of waste and recovery and disposal of waste in Sweden 2006
According to EU Regulation on Waste Statistics 2008
SMED at the request of SWEDISH ENVIRONMENTAL
Orders
Phone: + 46 (0)8-505 933 40 Fax: + 46 (0)8-505 933 99
E-mail: natur@cm.se
Address: CM Gruppen AB, Box 110 93, SE-161 11 Bromma, Sweden Internet: www.naturvardsverket.se/bokhandeln
The Swedish Environmental Protection Agency
Phone: + 46 (0)8-698 10 00, Fax: + 46 (0)8-20 29 25 E-mail: registrator@naturvardsverket.se
Address: Naturvårdsverket, SE-106 48 Stockholm, Sweden Internet: www.naturvardsverket.se ISBN 978-91-620-5842-5 .pdf ISSN 0282-7298 © Naturvårdsverket 2008 Elekrtonisk publikation
Contents
INTRODUCTION AND GUIDELINES 7
General information on the EU Waste Statistics Regulation 7
Annex I 7
Annex II 7
Annex III 8
Report description 8
PART I: DESCRIPTION OF THE DATA 9
Identification 9
Contact person 9
Organisation of reporting 9
General description of methods used 11
General information on the scope and limitations of the statistics 12
Definitions and interpretations 12
Key Aggregates and aggregation of sludge and dredging spoils 13
Overview of methods 13
Analysis regarding Agriculture, hunting and forestry (NACE A)
and Fishing (NACE B) 20
Survey regarding Mining and quarrying (NACE C) and
Manufacturing (NACE D) 20
Survey regarding Electricity, gas and water supply (NACE E) 20
Survey regarding Construction (NACE F) 21
Survey regarding Services (NACE G-Q excl. 51.57 and 90) 21 Survey regarding Recycling (NACE 37) and Wholesale of waste and
scrap (NACE 51.57) 22
Survey regarding Sewage and refuse disposal, sanitation and
similar activities. (NACE 90) 22
Survey regarding waste generated by households 23 Changes since the previous reference year 23 Expected changes to the 2010 reporting referring to reference year 2008 24
PART II: QUALITY ATTRIBUTES 26
1 Relevance 26
2 Accuracy 27
2.1 Sampling errors 30
2.2 Non-sampling errors 30
4 Accessibility and clarity 39
5 Comparability 40
5.1 Comparability with other member states and between sectors 40 5.2 Regional comparability of waste treatment 41
5.3 Comparability over time 41
6 Coherence 41
7 Burden on respondents 42
DEFINITIONS, UNITS AND ABBREVIATIONS 43
APPENDIX 1 45
Definitions and interpretations 45
1 The definition of waste 45
2 Waste and by-products 46
3 Application of the waste definition in this survey 47 4 Interpretation of recycling and recovery 48
5 Interpretation of landfilling 48
6 Interpretation of internal recycling 49
7 Changed interpretation in this survey 49
8 Capacities for waste treatment 49
APPENDIX 2 51
Agriculture, hunting and forestry (NACE A) 51
1 Sources 51 2 Accuracy 51 5 Comparability 54 APPENDIX 3 55 Fishing (NACE B) 55 1 Sources 55 2 Accuracy 55 5 Comparability 57 APPENDIX 4 58
Mining and quarrying (NACE C) and Manufacturing (NACE D) 58
1 Sources 58
2 Accuracy 60
APPENDIX 5 69
Energy, gas and water supply (NACE E) 69
1 Sources 69 2 Accuracy 71 5 Comparability 77 APPENDIX 6 78 Construction (NACE F) 78 1 Sources 78 2 Accuracy 79 5 Comparability 81 APPENDIX 7 83
Services (NACE G-Q, excl. 51.57 and 90) 83
1 Sources 83
2 Accuracy 84
5 Comparability 88
APPENDIX 8 89
Recycling (NACE 37) and Wholesale of waste and scrap (NACE 51.57) 89 Appendix 8.1. Recycling (NACE 37) and Wholesale of waste and scrap (NACE
51.57) excluding car dismantling 89
1 Sources 89
2 Accuracy 91
5 Comparability 93
Appendix 8.2. Car dismantling in NACE 51.57 93
1 Sources 93
2 Accuracy 94
5 Comparability 95
APPENDIX 9 96
Sewage and refuse disposal, sanitation and similar activities 96 Appendix 9.1. Collection and treatment of sewage (NACE 90.01) 96
1 Sources 96
2 Accuracy 96
5 Comparability 98
Appendix 9.2. Collection and treatment of other waste (NACE 90.02) 98
1. Sources 98
5 Comparability 103 Appendix 9.3. Sanitation, etc. (NACE 90.03) 103
1 Sources 103 2 Accuracy 104 5 Comparability 105 APPENDIX 10 106 Households 106 1 Sources 106 2 Accuracy 107 5 Comparability 109 APPENDIX 11 110
Recovery and disposal of waste 110
1 Sources 110
2 Accuracy 111
5 Comparability 116
APPENDIX 12 117
Uncertainty estimates of key aggregates 117 1 Uncertainty in the questionnaire surveys 117
2 Uncertainty in other sources 117
3 List of uncertainties in key aggregates 120
APPENDIX 13 122
Result tables 122
Uppkommen mängd avfall per sektor och totalt 2006 122 Behandlad mängd avfall totalt (per behandlingsmetod) 2006 143 Behandlad mängd avfall per sektor 2006 147
Introduction and guidelines
General information on the EU Waste
Statistics Regulation
The Regulation of the European Parliament and the Council No 2150/2002 of 25 November 2002 on waste statistics (hereafter referred to as “the Waste Statistics Regulation” or “WStatR”) contains rules for the reporting of waste statistics to the EU1. Reporting in accordance with the regulation is to take place every second year. Reporting shall be submitted each time 18 months after the end of the report-ing period. The first round of reportreport-ing by all member states was completed by 30 June 2006 and concerned waste generation and recovery and disposal of waste during 2004. This quality report is part of the obligation to report by no later than 30 June 2008 and concerns the generation and treatment of waste in Sweden during 2006.
The regulation contains three annexes that describe in more detail what should be reported:
Annex I
The generated quantities of waste are to be reported for a total of 20 different sec-tors including
- all economic activities (sections A-Q according to NACE Rev.1 or SNI 2002) - waste arising from recovery and/or disposal operations
- waste generated by households.
The generation of waste for these 20 sectors should be given according to the EWC-Stat waste classification. EWC-Stat is a special material-based waste classi-fication that is founded on the usual list of waste. There are a total of 48 different categories of waste in EWC-Stat.
Annex II
The treatment of waste is to be reported by treatment method for the different types of waste according to EWC-Stat and broken down by region according to NUTS 1. Up to and including 2007, Sweden comprised one NUTS 1 region. From 2008, Sweden is now divided into three NUTS 1 regions. In this survey we have we have invented waste treatment according to the earlier NUTS classification, that is with Sweden as one NUTS 1 region.
1
An "EU regulation" implies that the legislation is immediately applicable in all member states (in con-trast to a directive which becomes applicable in every member state only once it has been incorporated into the country's own legislation).
The method of treatment relates to various recovery and disposal operations2 (“R and D codes”) have been compiled into 5 different groups:
1) Incineration: Main use as fuel or other methods of generating energy 2) Incineration: Incineration on land
3) Recovery excluding energy recovery
4) Disposal operations: Land filling, deep injection, surface impoundment, permanent storage and others
5) Disposal operations: land treatment, release into water
Some recovery and disposal operations that constitute pre-treatment should not be reported.
According to Annex II, the number of treatment facilities and the capacity for different treatments should also be reported regionally according to NUTS 2 (i.e. 8 aggregates of counties for Sweden)3.
Annex III presents a division of the types of waste according to EWC-Stat. The original Annex III has been revised .
Report description
The following report constitutes one part of the obligatory delivery to the EU. Ac-cording to the waste statistics regulation, every member state should submit a re-port on the coverage and quality of the statistics. The rere-port is also published in Sweden in Swedish for Swedish users of statistics. The contents and structure of the report have been determined by the European Commission in a specific regula-tion . The report is structured in conformity with this regularegula-tion4.
The report is divided into three parts: - Part 1: This part contains primarily
• General information, for example, on the responsibility and organisa-tion of the reporting
• General description of the methods used. An overview is presented of how the statistics have been compiled.
- Part II: Quality attributes. This part includes a description of the various aspects that affect the quality of the produced data, in particular, in relation to Sec-tion 2 Accuracy. The headings are taken from the European Commission’s regula-tion on the contents of quality reports.
- Appendices to Part II: This part contains a more detailed description of the most important quality attributes of the survey.
2
Processes for recovery and disposal are defined in Annexes 4 and 5 of the Swedish Waste Ordinance (2001:1063) and in Annexes IIA and IIB of the EU Framework Directive on Waste (1975/442/EEC). The different recovery processes are classified as R1 to R13 (R stands for Recovery) and there are different disposal processes classified as D1 to D16 (D stands for Disposal).
3
COMMISSION REGULATION (EC) No 574/2004 of 23 February 2004 amending Annexes I and III to Regulation (EC) No 2150/2002 of the European Parliament and of the Council on waste statistics
4
Part I: Description of the data
This part deals first with some obligatory formal details. This is followed by a general description of the methods used to compile the data.
Identification
Country: Sweden Reference year: 2006 Datasets: waste_regio_a2_se_2006_0000 waste_recov_a2_se_2006_0000 waste_dispo_a2_se_2006_0000 waste_incin_a2_se_2006_0000 waste_gener_a2_se_2006_0000 Transmission date: 17 June 2008Contact person
Name: Anna Nordin Telephone: +46 8 698 100
E-mail: anna.nordin@naturvardsverket.se
Organisation: Swedish Environmental Protection Agency, SE-106 48 Stockholm, Sweden
Organisation of reporting
There are a number of laws and regulations governing the work with waste statis-tics. The European Union’s waste statistics regulation (WStatR) relates directly to this as well as the Swedish Official Statistics Act and Ordinance5. The waste
statis-tics regulation governs the content, reporting frequency and format of the statisstatis-tics to be reported to the EU. The Swedish Ordinance on official statistics allocates responsibility for the official statistics on waste to the Swedish Environmental Protection Agency as well as the right of decision-making on the scope and content of the statistics.
Adjacent legislation and conventions that primarily indirectly govern the re-sponsibility of the Swedish Environmental Protection Agency relating to statistics production and reporting include the Secrecy Act6, Personal Data Act7, Ordinance
concerning government authorities’ collection of data8 and the SimpLex
Ordi-nance9, but also the Århus Convention10 regarding data on emissions. According
5
Official Statistics Act (2001:99) and Ordinance (2001:100) on official statistics
6
Secrecy Act (1980: 100) and the Secrecy Ordinance 1980
7
Personal Data Act (1998:204)
8
SFS 1982:668
9
SimpLex ordinance SFS 1998:1820, Ordinance on individual analysis of consequences of the effect of legislation on conditions for small enterprises
10
to the Århus Convention, data on emissions should not be confidential. Where the dividing line is between the Århus Convention’s public access and the Secrecy Act’s requirement for confidentiality as regards data that forms the basis of statis-tics is currently under review. Enterprises’ obligations to document waste man-agement for the purposes of environmental protection are primarily governed by the Environmental Code11 and the Waste Ordinance12, the Ordinance Concerning
Environmentally Hazardous Activities and the Protection of Public Health13, and
others.
In addition to these, there are several other directives and ordinances in the field of waste that govern Sweden’s commitments regarding international report-ing, including statistics and data on waste14.
In Sweden, the Swedish Environmental Protection Agency is responsible for producing, publishing and reporting national waste statistics. The Swedish Envi-ronmental Protection Agency has a framework agreement with the SMED consor-tium (Swedish Methodology for Environmental Data)15 for the provision of
ser-vices regarding data collection, statistics production and the development of meth-odology for reporting activities. The waste statistics with accompanying documen-tation have been produced by SMED.
11 Environmental Code 1998:808 12 Waste Ordinance (2001:1063) 13
Ordinance on environmentally harmful operations and health protection (1998:899)
14
How to produce better and cheaper waste statistics? Preliminary study on Swedish reporting sys-tems for waste data, Swedish Environmental Protection Agency, Report 5530: Dec 2005.
15
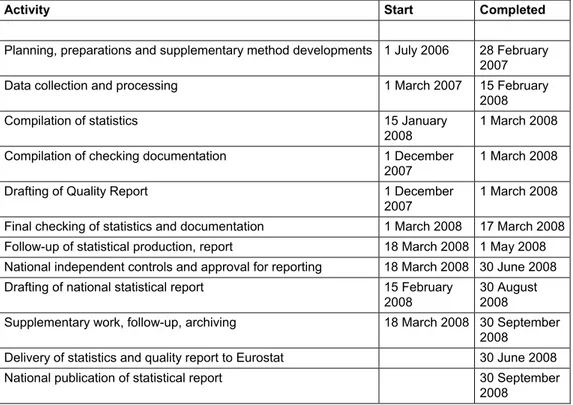
In preparation for the current reporting, the work has been organised as follows:
Statistics production
SMED
Sub-projects led by sub-project managers
Project management and coordination team
Respondents
Enterprises, local units or facilities in questionnaire surveys and other surveys
Other respondents
Avfall Sverige (Swedish Waste Management)
Jernkontoret (Swedish Steel Producers' Association)
Swedish Forest Industries Association Other sector organisations
Industry experts
Statistics Sweden Energy Unit
Swedish Car Recyclers Association (SBR)
Registers
EMIR
Swedish Portal for Environmental Reporting (SMP)
Statistics Sweden Business Register Kretsloppsregisterregister (transports of hazardous waste) SMED’s coordinator Development and preparation projects Post Project Activities Requirement specifiers Swedish EPA
Board of Swedish Industry and Commerce for Better Regulation (NNR)
Swedish Association of Local Authorities and Regions (SALAR)
Commissioner and competent authority
Swedish EPA
For the reporting according to the waste statistics regulation, a quality system has been developed covering the areas of responsibility for SMED16 and the Swedish
Environmental Protection Agency17. This ensures the possibility to repeat and trace the work carried out.
General description of methods used
The statistics on the generation of waste and the recovery and disposal of waste are based on a comprehensive inventory of waste flows in Sweden. Several different methods have been used and combined: own questionnaire surveys, cooperation with the questionnaire surveys of sector organisations, waste factors, calculation models and expert assessments. An overall description of the scope and limitations of the inventory is given below. There is also a general overview of the methods applied, with reference to the appendices where more detailed information on the various surveys can be found.
16
Manual for SMED's Quality System for waste reporting according to WStatR, 10 April 2006
17
Swedish Environmental Protection Agency Quality Manual for reporting of waste statistics according to EU Regulation No 2150/2002
General information on the scope and limitations of the statistics The statistics cover the generation of waste in all economic sectors and households. They cover waste activities of both small and large enterprises. In Sweden in 2006, there were more than 990 000 enterprises and about 917 000 local units, and more than 4.4 million households.
The statistics do not cover imports and exports of waste. However, imported waste quantities can be seen as a subset of the statistics when the waste is treated in Sweden. Similarly, waste can be generated in Sweden, which is seen in the statis-tics, but is treated abroad, which is not seen in Sweden’s waste statistics. Definitions and interpretations
Definitions and interpretations of waste treatment have a considerable impact on the end results. Appendix 1. Definitions and interpretations describes, discusses and justifies the interpretations we have made.
In the survey, we have applied a broad interpretation of the concept of waste. We have included several by-products in the concept of waste, e.g. sawdust, wood chips and off-cuts from sawmills, food waste from the food industry used as animal feed, etc. The European Commission published clarification of interpretations of the dividing-lines between waste and by-products in February 200718. Our survey
was already underway at this point in time, which meant that we could not follow the Interpretative Communication to the letter.
In connection with recovery, we have classified a waste as waste until it has become a new product or part of a new construction, etc.
Generated quantities of waste may have been counted twice in the event of a waste firstly being generated as one type of waste and during treatment becoming another. For example, when waste is sorted in different facilities, new waste is generated from the old waste. This may, for example, be mixed industrial waste or bulky waste from households which is sorted into different recoverable materials, combustible waste and landfill residue. The new fractions generated during sorting are classified as generated waste.
Recovery is, as stated above, when the waste has become a new product or part of a new construction, etc. We have not included recovery preparations, e.g. sort-ing, fragmentation, evaporation, de-watersort-ing, etc., in the recovery statistics. This interpretation ensures that recovery is not reported twice, since one particular waste flow is only reported once in the statistics on the recovery of waste.
In Accordance with the Waste Statistics Regulation, waste recycled internally (internal recycling is when the waste is material recycled in the same facility where it has been generated) is not reported, either as generated waste or as recovered waste, see Appendix 1 for further information.
Incineration of municipal waste and most industrial facilities are classified as R1, Use as fuel. These facilities have been primarily built to produce energy and not to dispose of waste.
18
Waste from mining is included in the survey of the Mining and quarrying sector (NACE C). Some of the waste from mining is used in various ways to restore the mining pits (terracing, landscaping and such like). We have classified this as Land filling D1.
Key Aggregates and aggregation of sludge and dredging spoils According to the waste statistics regulation, a number of summations and aggrega-tions of types of wastes shall be calculated. In the Swedish statistics these have been done as follows:
• The key aggregates of generated waste (summations of “total hazard-ous waste”, “total non-hazardhazard-ous waste” and “total amount of waste”), are based on dry amounts for those types of waste given as both wet and dry amounts19 and total quantities (which are wet amounts) for others.
• The tables with incineration and disposal of waste include the waste-type EWC-Stat 11, consisting of Normal sludges including dredging spoils (EWC-Stat 11.3) as a single item. Both wet amounts and dry substance amounts are given. The summations in these tables are based on the wet amount of the waste-type EWC-Stat 11, and the total amount (i.e. wet amount) of other waste-types. The waste-type 03.2 Industrial effluent sludges is aggregated with waste-types EWC-Stat 01, 02 and 03 as one item, and only the wet weight is counted. • The recovery table shows EWC-Stat Normal sludges (incl. 11.3
Dredging spoils) aggregated with a number of other waste-types as one item. For EWC-Stat 11, only wet weight is counted in this item, and the total quantities of other waste-types (i.e. wet amount). Overview of methods
We have used several methods to capture data and in almost all sectors, we have used several different methods. When selecting methods, our starting-point has been to prioritise good quality of statistics for flows of hazardous waste and large flows of waste that has been associated with environmental or resource problems.
We have mostly used local unit, facility, station or equivalent as survey objects. A local unit, facility, station or equivalent can have several different activities, one main activity and several secondary activities. We have in this event classified the entire local unit, facility, station or equivalent by its main activity. For example, coking plants can be found at steelworks. Independent coking plants should be classified as NACE 23 and steelworks as NACE 27. In our survey, coking plants at steelworks have been classified as belonging to NACE 27, and the waste generated there has been allocated to NACE 27.
19
The following types of waste are given as both dry and wet weights: 03.2 Industrial effluent sludges (both hazardous and non-hazardous) 11 (excl. 11.3) Normal sludges
We have cooperated with several sector organisations that make their own compi-lations in order to reduce the burden on respondents. We have partly estimated small waste flows based on data from the previous reporting. This applies in par-ticular to smaller local units or sub-sectors that generate less amounts of waste and do not do waste treatment.
The questionnaire surveys implemented have been voluntary for the respon-dents. The surveys have been carried out using paper questionnaires. Question-naire surveys have been covered by statistical confidentiality20. As a result of this,
partial results can be confidential if the data originate from only a few question-naire responses or can, in some way, indirectly or directly, be attributed to a spe-cific local unit, facility or enterprise.
In some sectors, the questionnaire surveys have been total, i.e. covering all lo-cal units/facilities/enterprises in the sector/sub-sector, while sample surveys have been used in other sectors. With the sample surveys, a division into different strata or sub-populations has been done first (by number of employees). A random sam-ple of facilities who will receive the questionnaire was then taken from every stra-tum. When data are then compiled, a proportional extrapolation is carried out of the waste quantities received within each stratum, i.e. those responding within each stratum are considered representative of the stratum as a whole.
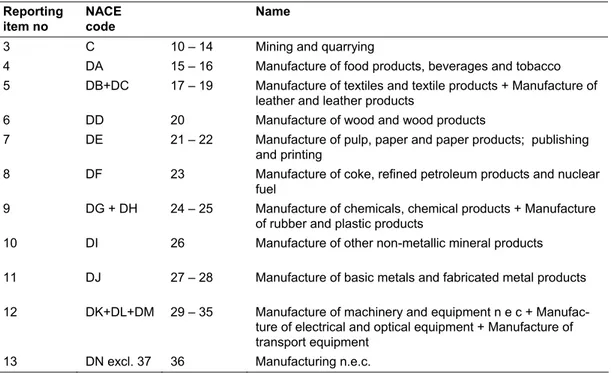
The inventory work has been divided into several sub-surveys. The division of sectors described in Annex I in the waste statistics regulation, i.e. the sectors for which generation of waste are to be reported, have been used as a basis for the division into sub-surveys. Every sub-survey has involved an inventory of both data on waste generated and data on the recovery and disposal of waste, including ca-pacities in the sector or sub-sector. Tables I.1a-b provides an overview of the methodology used. Appendices 2 - 10 give a more detailed description for each sector, both in terms of waste generation in accordance with Annex 1 and recovery and disposal in accordance with Annex II in the Waste Statistics Regulation.
Table I.1.a. Overview of the methods used. Bold crosses refer to the main methods, which cover the largest and most important waste flows, smaller crosses refer to supplemen-tary methods used to provide full coverage.
NACE Own questio nn aire surveys Question n
aire surveys from
sector orga nis ations From WStat R 2006 Enviro nmental reports
Administrative data Waste factors Sector or
ganis
ations
Other statistic
s
Other information
Waste generation in accordance with Annex I
1 A Agriculture, hunting and forestry X X X
2 B Fishing X X X
3 C Mining and quarrying x X
4 DA Manufacture of food products, bev-erages and tobacco
X x
5 DB + DC Manufacture of textiles and textile products + manufacture of leather and leather products
X
6 DD Manufacture of wood and wood products
X X x X
7 DE Manufacture of pulp, paper and paper products publishing and printing
X X x X
8 DF Manufacture of coke, refined petro-leum products and nuclear fuel
x X
9 DG + DH Manufacture of chemicals, chemical products + manufacture of rubber and plastic products
X x
10 DI Manufacture of other non-metallic mineral products
X x
11 DJ Manufacture of basic metals and fabricated metal products
X X x
12 DK + DL + DM
Manufacture of machinery and equipment n.e.c + manufacture of electrical and optical equipment + manufacture of transport equipment
X x
13 DN excl. 37
Manufacturing n.e.c x
14 E Electricity, gas and water supply X x x x x
15 F Construction X X 16 G-Q excl. 90 and 51.57 Services X X X X X 17 37 Recovery X x x
18 51.57 Wholesale of waste and scrap X X x
19 90 Sewage and refuse disposal, sanita-tion and similar activities
X x X x x
20 - Waste generated by households X X X X
Recovery and disposal in accordance with Annex II X X X x
ing capacities) 1 A Agriculture, hunting and forestry Inventories of agriculture and forestry have been
per-formed in separate sub-surveys and then added together. Agriculture: Waste factors for discarded equipment with sub-groups, discarded vehicles and tyres and for paper and household waste. Information from sector organisa-tions for the majority of waste-types.
Forestry: Waste factors for all waste-types apart from animal and vegetal wastes, where the data were gathered from a sector organisation.
No waste treatment is thought to occur in this sector, see Appendix 1.
2 B Fishing Waste factors from previous Nordic surveys, in some
cases with minor adjustments. Detailed statistics on the physical and economic structure of the fishing fleet from the National Board of Fisheries. Official statistics on production and employment in aquaculture. Expert as-sessments / calculations of the quantity of discarded equipment and scrapped vessels.
No waste treatment is thought to occur in this sector, see Appendix 1.
3 C Mining and quarrying Information from environmental reports for the 18 largest mines and dressing plants. Data from 2004 have been reused for the rest of the sector.
Information from environmental reports for the 18 largest mines and dressing plants. Data from 2004 have been reused for the rest of the sector. 4 DA Manufacture of food products, beverages
and tobacco
Questionnaire survey - sample survey, only about gener-ated food waste (EWC-Stat 09 and 09.11 respec-tively).2004 data have been reused for other waste-types and smaller industries.
Questionnaire survey - sample survey, only about treatment of food waste (EWC-Stat 09 and 09.11 respectively). 2004 data have been reused for own treatment of other waste-types.
5 DB +
DC
Manufacture of textiles and textile products + manufacture of leather and leather prod-ucts
No new survey, 2004 data have been reused. No waste treatment has been identified in this sector in previous surveys.
6 DD Manufacture of wood and wood products Data on quantities of sawed quantities of wood from saws, NACE 20.1, was received from the Swedish Forest Industries Association. Using factors, these figures were converted to quantities of off-cuts/wood waste. 2004 data were reused for other waste-types in sub-sector NACE 20.1. Questionnaire survey - sample survey, for larger local units in other sectors NACE 20. Data from 2004 have been reused for the rest of the sector.
Recovery of wood waste for use in sawdust and wood fibre manufacturing and pellet production by special analysis. Use as fuel in NACE 20.1 from the Swedish Forest Industries Association. Questionnaire survey - sample survey, to larger local units in the rest of sector NACE 20. Data from 2004 have been reused for the rest of the sector.
7 DE Manufacture of pulp, paper and paper prod-ucts; publishing and printing
Detailed data on the large pulp and paper mills were received from the Swedish Forest Industries Association. Questionnaire survey - sample survey, to larger local units in the rest of NACE 21. 2004 data were reused for the remaining local units in NACE 21 and for the whole of NACE 22.
Detailed data on the large pulp and paper mills was received from the Swedish Forest Industries Associa-tion. Questionnaire survey - sample survey, to larger local units in the rest of NACE 21. Recovery of waste paper in pulp and paper mills and wood chips from sawmills to pulp mills by special analysis.
8 DF Manufacturing of coke, refined petroleum products and nuclear fuel
Data from environmental reports for 10 local units with major waste quantities. Data from 2004 have been re-used for the rest of the sector.
Data from environmental reports for 10 local units with major waste quantities. Data from 2004 have been reused for the rest of the sector.
9 DG +
DH
Manufacture of chemicals, chemical prod-ucts + manufacture of rubber and plastic products
Questionnaire survey – sample survey for all NACE 24-25, excluding 24.5. Data from 2004 were reused for NACE 24.5 and small industry <10 employees.
Questionnaire survey – sample survey for all NACE 24-25, excluding 24.1. Data from 2004 were reused for NACE 24.1 and small industry <10 employees 2004. Recovery of scrap plastic and rubber waste in the sector by special analysis.
10 DI Manufacture of other non-metallic mineral products
Questionnaire survey of 25 selected local units. The selection criteria were local units that had large quantities of waste in 2004 and/or own treatment activities, and large local units that did not respond to the survey in 2004. Data from 2004 have been reused for the rest of the sector.
Questionnaire survey of 25 selected local units. The selection criteria were local units that had large quanti-ties of waste in 2004 and/or their own treatment activi-ties, and large local units that did not respond to the survey in 2004. Recovery of glass wastes in the sector by special analysis.
11 DJ Manufacture of basic metals and fabricated metal products
Data for large iron and steelworks were obtained from Jernkontoret.4 other large local units in NACE 27 from environmental reports. Questionnaire survey - sample survey to others in NACE 27 and all of NACE 28 with at least 20 employees. Data from 2004 were reused for small industry.
Data for large iron and steelworks were obtained from Jernkontoret (the Association of Swedish Steel Pro-ducers' Association). 4 other large local units in NACE 27 from environmental reports. Questionnaire survey - sample survey to others in NACE 27 and all of NACE 28 with at least 20 employees. Recovery of steel scrap in the sector by special analysis.
12 DK +
DL + DM
Manufacture of machinery and equipment n.e.c + manufacture of electrical and optical equipment + manufacture of transport equipment
Questionnaire survey - sample survey to local units with at least 20 employees. Small industry according to the 2004 survey.
Questionnaire survey - sample survey to local units with at least 20 employees.
13 DN excl. 37
Manufacturing n.e.c No new survey, 2004 data have been reused. No waste treatment has been identified in this sector in previous surveys
14 E Electricity, gas and water supply Incineration facilities: Questionnaire survey – total popu-lation survey of incineration facilities on waste generation from incineration and separated metal. Projection of 2004 data for other generation of waste.
Analysis (telephone enquiries, calculations) from the electricity grid
Projections: nuclear power plants, hydroelectric power stations, wind power stations
Reuse of 2004 data: gas supply, water supply Waste factors for household waste and office paper waste
Incineration:
Questionnaire survey – total population survey of waste incineration facilities.
Incineration of tall pitch oil collected from the energy statistics
Other treatment: Based on 2004 data
Treatment capacities: Based on data on treated quanti-ties
15 F Construction Expert panel - assessments Expert panel - only recovery of excavated material
(mineral waste) occurs in the construction sector, 16 G-Q excl. 90 and 51.57 Services:
wholesale and retail trade; repair of motor vehicles, household and personal articles + hotels and restaurants + transport, storage and communication + financial mediation + real estate, rental and business activities + public service, defence and compulsory social insurance + education + health and social services; + other community, social and personal service activities + activities in households + extraterritorial organisations and bodies
Contact with sector organisations/industry representatives Kretsloppsregister (for transported hazardous waste) Waste factors for household waste, office paper and biological waste
Telephone and e-mail contact with
enter-prises/facilities/local units where waste treatment has been identified
17 37 Recovery Waste data for the largest facilities have been compiled
with the help of environmental reports from the largest facilities.
Environmental report analysis and telephone and email contact with facilities/local units whose environmental reports have not provided sufficient information Data for smaller facilities have been extrapolated using factors extracted from the environmental report survey
No recovery or disposal in accordance with Annex II has been identified
18 51.57 Wholesale of waste and scrap Waste factors for dismantling of cars.
For others: data for the largest facilities have been com-piled with the help of environmental reports from B
facili-No recovery or disposal in accordance with Annex II has been identified
19 90 Sewage and refuse disposal, sanitation and similar activities.
Sewage treatment: Use of sludge quantities from Swe-den’s reporting of sludge quantities in accordance with the Sludge Directive (86/278/EEC).
Collection and treatment of waste: Questionnaire survey - total population survey of about 600 treatment facilities (other NACE-90 facilities are assumed to contribute minimal quantities of waste)
Waste from sanitation activities: Use of data produced for reporting in accordance with WStatR 2006.
Questionnaire survey – total population survey to all waste treatment facilities
20 - Waste from households Data from Avfall Sverige (Swedish Waste Management) and other sector organisations and material recovery enterprises, industrial experts and authorities.
No waste treatment has been assumed to occur (home composting is considered equal to internal recycling).
As can be seen in the table, the inventory has been divided up into different sub-surveys as follows:
Analysis regarding Agriculture, hunting and forestry (NACE A) and Fishing (NACE B)
Generated waste in agriculture, hunting and forestry and in fishing was examined for the first time. A large proportion of the enterprises in the sectors included in NACE A and B have fewer than ten employees, and a questionnaire survey is therefore considered inappropriate as a data collection method. Waste factors, data from sector organisations and contacts with experts in each sector respectively have instead been used to estimate generated waste quantities. The waste factors have been obtained from studies previously performed by SMED, from interna-tional research studies and/or developed during the course of the project. No waste treatment is adjudged to occur in any of the sectors.
Survey regarding Mining and quarrying (NACE C) and Manufacturing (NACE D)
The Mining and quarrying and Manufacture sectors cover 11 different items in total in the reporting of waste generation in accordance with the Waste Statistics Regulation. Recovery and disposal occurs in many of these sectors/sub-sectors. In contrast to the previous 2004 surveys, when all sub-sectors were examined in a coordinated survey, several different methods depending on the sub-sector in ques-tion have been applied this time to produce waste data. In addiques-tion, those parts of the survey based on sample surveys have this time been performed using paper questionnaires. These have however been adapted to each sector as regards e.g. the waste-types pre-printed on the form. A total of 1 300 local units have been tioned, of which all had more than 100 employees. In addition to the various ques-tionnaire surveys, a lot more data were also obtained this time from various sector organisations. Furthermore, the intention from the start was to partly obtain data for some sectors from environmental reports. Data from the 2004 survey were reused for some smaller sub-sectors and for small local units, not covered by the sample. Survey regarding Electricity, gas and water supply (NACE E)
Both generation and recovery and disposal of waste have been examined for the Electricity, gas and water supply sector (NACE E).
All incineration of waste in this sector is classified as R1, Use as fuel. Most of the recovery in the sector is done at facilities that produce energy by combusting different types of waste fuel. Energy production from the combustion of all kinds of fuels also gives rise to a large part of the waste generated in the sector. A ques-tionnaire survey (total population survey) has been performed for these enterprises in NACE 40. Use of tall pitch oil (EWC-Stat 3.1. Hazardous) has been obtained from the energy statistics. Furthermore, the generation of waste-types not requested in the questionnaire has been supplemented somewhat.
As regards electricity network enterprises, the quantity of generated waste has been examined via targeted questions to a small number of large and small enterprises, after which obtained data has been extrapolated based on cable length.
Data have been projected or reused from 2004 for other sub-sectors. These sec-tors are Nuclear power plants, Manufacture of gas, Hydroelectric power stations, Wind power stations and Water supply. Electricity trade enterprises only generate minimal quantities of waste.
Waste factors have been used for the sector as a whole as regards household waste and waste office paper.
Survey regarding Construction (NACE F)
A separate study based on expert assessments was carried out. Representatives from the waste industry, construction industry and public authorities as well as consultants and researchers have participated in the expert assessments. The survey has also been supplemented by the use of waste factors for household waste and waste office paper.
Survey regarding Services (NACE G-Q excl. 51.57 and 90)
In the Services reporting item, Wholesale of waste and scrap (NACE 51.57) and Sewage and refuse disposal, sanitation and similar activities (NACE 90) are ex-cluded since these make up their own reporting items. The sector is large and het-erogeneous. As a result, not all activities that give rise to waste could be covered, causing a certain amount of undercoverage. The survey has focused on surveying flows of hazardous waste as well as flows of waste that occurs in large quantities, or that is important to monitor with respect to Sweden’s environmental quality objectives (e.g. food waste). The survey was performed by asking various indus-trial representatives and sector organisations about waste: county councils, the Swedish Maritime Administration (all ports), the Swedish Civil Aviation Authority (all airports), the Swedish Rescue Services Agency and the Armed Forces. Fur-thermore, the Kretsloppsregister21 is used to cover the total amount of hazardous
waste in the sector (excluding sub-sectors for which other sources have been used). Waste factors have been used for household waste, paper and office waste (counted as office paper) and animal and vegetal waste. Lead batteries and end-of-life vehi-cles have been calculated from other sources.
Treatment of waste only occurs to a limited extent and relates to the treatment of food waste, cremation of small animals and incineration of healthcare waste. This has been covered by telephone contact with the treatment enterprises.
21
The Kretsloppsregister is a system managed by Sveriges Åkeriföretag (Swedish Road Hauliers' Association). The system is voluntary. The members of the Register send in electronically all their transport documents referring to completed transports of hazardous waste. The system is thought to cover about 50 - 60% of transports of conventional hazardous waste.
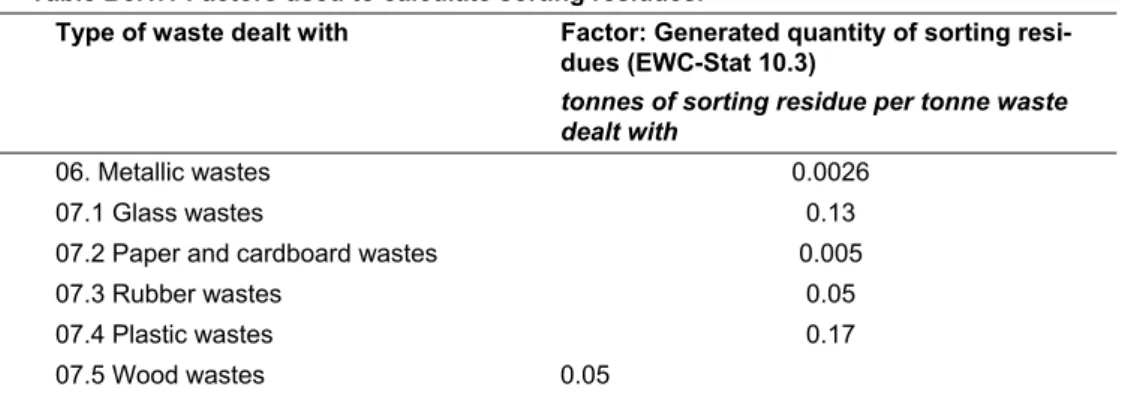
Survey regarding Recycling (NACE 37) and Wholesale of waste and scrap (NACE 51.57)
The Recycling sector (NACE 37) and the Wholesale of waste and scrap sector (NACE 51.57), excluding car dismantling, have been studied in a survey based on data collected from environmental reports covering the major players in both sec-tors.
The survey has covered the generation of waste. Treatment, which is to be re-ported in accordance with Annex II, does not occur in these sectors, only prepara-tions for recovery and disposal occur in the form of waste sorting, fragmentation, etc.
Data on quantities of generated waste obtained from environmental reports from the major facilities have been used to calculate waste factors. Waste factors combined with the number of employees obtained from the Statistics Sweden Business Register have resulted in an estimation of the total quantities of generated waste in each sector.
Quantities of generated waste from car dismantling have been calculated using waste factors. The Swedish Car Recyclers Association (SBR) sends out an annual questionnaire on generated waste quantities and numbers of issued scrapping cer-tificates to its members. Waste quantities per scrapping certificate are calculated from this. Data on the total number of scrapping certificates issued in Sweden are obtained from the Swedish National Road Administration. The dismantling of cars has been classified as a form of pre-treatment and is not included in the statistics on recovered and disposed waste.
Car dismantling facilities are classified as both NACE 37 and NACE 51.57 in the Business Register. Adhering strictly to the NACE classification, car disman-tling should be allocated to NACE 51.57. In this year’s survey, car dismantlers’ waste has been allocated in full to NACE 51.57, whilst in the 2006 reporting (refer-ring to waste in 2004), it was divided in accordance to how car dismantlers were actually classified in the Business Register.
Survey regarding Sewage and refuse disposal, sanitation and similar activities. (NACE 90)
The Sewage and refuse disposal, sanitation and similar activities sector (NACE 90) has been examined in three different studies using different approaches:
1) Collection and treatment of sewage: (NACE 90.01): For this sub-sector, only data on generated sludge have been produced. Types of waste not reported in-clude screenings and such like, which are considered only to generate rela-tively small quantities. The data are estimates/expert assessments obtained from the international reporting done by Sweden in 2007 in accordance with the Sludge Directive (86/278/EEC) regarding 2004-2006. The reporting refers to just over 400 licensed facilities that perform “final treatment of sludge”. This sludge originates to some extent also from smaller sewage facilities and private sewers. Data on sludge are entered as “Generated waste”. Liquid, wa-ter-containing waste that is released into sewers has not been included as
dis-2) Collection and treatment of other waste (NACE 90.0dis-2): A total population survey has been carried out of waste treatment facilities covering the genera-tion of waste, the recovery and disposal of waste as well as treatment capaci-ties. The survey method was a questionnaire survey with paper questionnaires as the measurement instrument. Nearly 600 waste treatment facilities have been approached.
3) Sanitation, remediation and similar activities (NACE 90.03): Use of data of waste generation produced for reporting in accordance with WStatR 2006 concerning 2004.
Survey regarding waste generated by households
The survey is based on data from Avfall Sverige (Swedish Waste Management) for “municipal” waste and from various material recovery enterprises for the wastes covered by producer responsibility. Regarding waste-types for which no statistics have been available, own analyses have been carried out with the help of data from sector organisations, industrial experts and authorities. For each waste stream, expert assessments have been made of how much of the waste has come from households and how much from businesses. No waste treatment is considered to have occurred (home composting is considered as equal to internal recycling).
Changes since the previous reference year
This is the second report in compliance with the European Waste Statistics Regula-tion. Several changes have been made to this reporting compared to the previous round as regards methodology and scope. The most important changes are: 1) This year, water-containing wastes have normally not been classified as waste
when they have undergone a treatment process. One example is leachate water from landfill sites (classified as EWC-Stat 03.2) which is cleaned before being released into sewers or into recipient surface water. Other wastewater-related wastes have also been classified in this way. Last time, even the cleaned water was classified as waste.
2) In the last round of reporting, Sweden had been granted derogeration from reporting waste generation in sectors NACE A (Agriculture, hunting and for-estry), NACE B (Fishing) and NACE G-Q (Services). These sectors have been included this time.
3) We have changed methodology in several sectors. In NACE 21 and NACE 27, we have this time used data from relevant sector organisations, whilst last time we performed an own questionnaire survey. In several cases, we have also used environmental reports instead of questionnaires.
4) All car dismantling facilities have been allocated to NACE 51.57. Last time we reported, these facilities were split between NACE 37 and 51.57 in accor-dance with their activity classification in the Business Register.
5) In this survey, we have tried to incorporate sorting facilities for waste in a better way, especially in NACE 90. As a result, the quantities of generated waste of various recycling materials (paper and carton waste, metallic wastes,
plastic waste, etc.) as well as combustible waste and landfill residue (both classified as EWC-Stat 10.2 and 10.3) in NACE 90 have increased considera-bly. Last time, we did not include specialist sorting facilities in the survey be-cause we considered them as specialist pre-treatment facilities. The sorting fa-cilities affect generated quantities of secondary waste in NACE 90 but are not included in the statistics on treated waste.
6) We have improved the questionnaires. This time, the forms are more sector-specific with more pre-printed examples of waste-types that occur in the sec-tor. It has also been possible in several of the sub-surveys to answer using common waste codes. The questions on the treatment of waste have been clarified. This year’s questionnaire responses should therefore contain fewer inaccuracies caused by respondents misunderstanding the questions.
7) Harvesting residue and other by-product fuel from forestry (EWC-Stat 09) are classified as waste in this year’s survey. This was not the case last time since we had respite from reporting NACE A. The quantity of incinerated waste (in-cineration R1, use as fuel) has therefore increased. The same interpretation is used for generated waste from forestry.
Expected changes to the 2010 reporting
referring to reference year 2008
Planning for 2010 reporting will start during 2008. The starting-point is to basically use the same methodology and have the same level of ambition as for the 2008 reporting. The following changes are currently being discussed:
1) Certain changes can be carried out to reduce the costs to society of the statis-tics production and to raise the level of ambition regarding statistical quality for some sectors/types of waste. This will be discussed in more detail when planning for the next survey begins.
2) We will examine changed interpretations of the distinctions between wastes and by-products, as a result of the Commission’s Interpretative Communica-tion on waste and by-products. A lot of off-cuts from sawmills, harvesting residue from forestry, metallic scrap from the metal industry, etc., will proba-bly not be classified as waste.
3) In accordance with a decision by the Commission22 a new NUTS
classifica-tion applies from 2008, dividing Sweden into three NUTS 1 regions. Previ-ously, the whole of Sweden was one NUTS 1 region. An amended NUTS classification affects the design of surveys on recovery and disposal of waste since recovery and disposal quantities should be reported on the NUTS 1 level. The classification on the NUTS level remains the same.
4) The classification of activities, popularly known as the industrial classifica-tion, has been revised. The Swedish Industrial Classification standard (SNI) is a statistical standard for the classification of production units (enterprises,
22
cal units, etc.) into different activities/sectors. SNI uses the EU classification NACE (Nomenclature statistique des Activités économiques dans la Com-munauté Européenne) as a basis. A project to revise the current industrial clas-sification standard, called NACE Rev 1.1 was completed in 2006 and a new version of NACE, NACE Rev. 2 has been established. The new Swedish stan-dard, SNI 2007, was established by Statistics Sweden in May 2007 and is valid as from 1 January 2008. The new classification may lead to the waste statistics not being completely comparable with previous years.
Part II: Quality attributes
This report on quality attributes includes various different descriptions of the qual-ity of the statistics. Important aspects of the description of qualqual-ity are the rele-vance of the statistics, their accuracy and precision, accessibility and clarity, com-parability, coherence and the burden on respondents.
The content of Part II describes the quality of the statistics primarily in relation to these aspects. The descriptions given are general. More detailed descriptions for each sub-survey are given in Appendices 2 – 10.
1 Relevance
Relevance (validity) refers in general to whether we measure what we intend to measure with the surveys performed. Relevance refers here to how the statistics are used on a national level and how complete the produced statistics are (using the requirements in the waste statistics regulation as a starting point).
Apart from our reporting obligation to the EU in accordance with the waste sta-tistics regulation, stasta-tistics on waste generation and recovery and disposal of waste are needed in Sweden for the follow-up and development of environmental policies and action plans.
Environmental work is governed by 16 environmental quality objectives23 that need to be achieved in order to solve the major environmental problems within one generation. Waste flows and waste management have an impact on developments within the objectives: A good built environment, Reduced climate impact and A non-toxic environment. A national waste plan has been drawn up24 to help achieve these objectives, in which the different objectives and instruments available within the field of waste are put into context. The impact of the measures that have been taken has been analysed and the areas which need to be prioritised in the work in the field of waste over the coming years have been highlighted in waste plans. The national environmental objectives are currently being reviewed, however, and sev-eral of the intermediate targets relating to waste management will be amended. Waste statistics are needed in order to be able to follow up these environmental objectives.
The existing waste statistics are considered to be useful for both the follow-up and the development of action plans in this field, even if follow-up indicators and other uses based on the new statistics need to be developed.
There are many different users of waste statistics - citizens, politicians, munici-pal, regional and national authorities, central government offices, industry, re-searchers, etc. This is because development towards good environmental quality is seen as everyone’s responsibility. Authorities competent for the follow-up and analysis of measures regarding the waste-related aspects of the environmental qual-ity objectives, such as the National Board of Housing, Building and Planning, the
23
Swedish Environmental Protection Agency, the Swedish Chemicals Agency and county administrative boards and municipalities are considered to be more depend-ent on the statistics.
The datasets in the reporting are complete. The value zero (0) has been reported in some cases, based on expert assessments that the quantity of waste of a certain category is practically zero. The European Commission’s regulation on reporting formats25 states that member states may write “L” (logically impossible) instead of
0 for some waste types to indicate that a certain type of waste can absolutely not occur within a certain sector. Sweden has not classified data as “L” in this report-ing as we considered it difficult to truly identify when a type of waste is “logically impossible”.
2 Accuracy
Table II.1 presents the key aggregates reported.
Table II.1. Key aggregates for generated and treated waste in 2006. Country: Sweden Reference year: 2006 Total hazardous waste (key aggregates), 1000 tonnes Total non-hazardous waste (key aggregates) 1000 tonnes Coefficient of variation hazardous waste % Coefficient of variation non-hazardous waste % Generation of waste 1 Households 489.073 3851.596 7 8 2 Enterprises 2164.270 108939.050 10 2
Recovery and disposal of waste 1 Incineration with energy recovery R1 208.781 18587.709 16 3 2 Incineration as a means of disposal D10 103.477 1.210 1 5 3 Recovery R2-R11 338.837 26059.194 11 12 4 Landfilling D1, D3, D4, D5, D12. Land treatment and release to water D2, D6, D7
378.028 66491.038 3 1
Inventories of some types of waste (mostly sludge and dredging spoils) have been performed using both dry and wet quantities, whilst other types are just total quan-tities (which are the same as wet quanquan-tities). How wet weights and dry weights are dealt with in various summations is described on page 13 of the previous report.
Appendix 12 shows how uncertainty estimates for these key aggregates have been done. Uncertainties have been produced for all surveys, and we have made an
25
COMMISSION REGULATION (EC) No 782/2005 of 24 May 2005 setting out the format for the transmission of results on waste statistics
assessment of the certainty of the figure for each piece of data. The variation coef-ficients in the table above do not just include statistically estimated uncertainties caused by sampling and non-response in the questionnaire surveys. Uncertainties for other types of surveys and systematic errors have also been estimated and taken into account in the variation coefficients.
In order to understand the key aggregates in the table, the following informa-tion should be noted:
1) The largest items of generated waste (wet weight) are - mineral waste from mining (62 million tonnes) - off-cuts from sawmills (18 million tonnes) - leachate from landfill sites. (3.8 million tonnes)
- sludge from the production of drinking water (1 million tonnes) - excavated material from construction activities (7 million tonnes)
These five waste-types are together responsible for about 74% of the total wet amount of waste generated.
2) The definition of wood off-cuts as waste or by-product can be discussed. Here we have classified all off-cuts from sawmills and other wood product indus-tries as waste. Several things point to off-cuts being classifiable as by-product in accordance with the Commission’s Interpretative Communication on waste and by-products26. A classification of off-cuts from sawmills and harvesting
residue from forestry as by-product instead of waste reduces the quantity of generated non-hazardous waste by 20 000 ktonnes. The quantity of waste re-covered as R1 "Main use as fuel or other methods of generating energy" de-creases by about 7 300 ktonnes and the quantity recovered (R2-R11) by 8 900 ktonnes.
3) Households produce a relatively large quantity of hazardous waste. About 62% of this quantity is made up of end-of-life vehicles and more than 26% of waste from electric and electronic equipment (WEEE).
4) The quantity of incinerated waste includes use of wood waste (classified as EWC-Stat 07.5) and harvesting residue (classified as EWC-Stat 09) in heating plants, and incineration of bark and wood waste in the paper and pulp indus-try, see also Point 2 above.
5) The quantity of landfilled waste is large because the depositing of mining waste is included. 62 million tonnes, corresponding to 94% of reported land-filled waste, is landland-filled waste within the sector Mining and quarrying (NACE C), which is in turn completely dominated by mining.
6. The reported quantity of recovered and disposed waste is less than the re-ported quantity of waste generated. This could be for several reasons: • Uncertainty in the estimations.
• Generated waste includes double reporting of the same material stream which can change classification during the waste management process. For example, a type of waste can occur within the mining and manufacturing industries (NACE C and NACE D) and then further
processed in NACE 37, NACE 51.57 or NACE 90, giving rise to sec-ondary waste, which is also counted as generated waste. The secon-dary waste is treated by recovery or disposal. Pre-treatment in NACE 37, NACE 51.57 and NACE 90 is not included as waste treatment but can give rise to the generation of secondary waste.
• The reporting of recovery and disposal of waste only covers facilities which require a permit or registration according to Articles 9, 10 or 11 in Directive 75/442/EEC. In practice, not all recycling comes under this rule:
- Secondary raw materials are classified as waste according to the Mayer Parry judgment from the European Court of Justice (C 444/00) but, before this ruling, were often considered as a commodity instead of a waste. We have mainly examined recovery in the manufacturing industry through contacts with material recycling enterprises (for pro-ducer responsibility material) and sector organisations (for other mate-rial). It is often difficult in questionnaire surveys to capture this recov-ery since the companies don’t consider it as waste or recovrecov-ery mate-rial. This means that there may be an undercoverage of recovery. - Mineral wastes, certain combustion wastes, treated contaminated soil,
etc are widely used as construction materials in construction works. Much of this usage is difficult to survey.
- Use of sludge from sewage treatment in agriculture has not been re-ported as a treatment method, nor when sludge has been used in con-struction work and the like. Production of compost and biofertiliser (anaerobic digestion residue) from the anaerobic digestion of waste is included as recovery, as is the case when sludge is mixed with other material to produce soil.
- Return of biofuel ash to the forest has not been included.
- Uncontaminated dredging spoils dumped in water in conjunction with dredging operations is not included either.
• Certain other types of waste treatment have not been captured in the surveys either. For example, we have identified the following cases where the inventories are not complete:
- Liquid water-containing waste that is released into sewers has not been included as disposed waste. It has been reported as generated, but at the sewage treatment plant it goes through biological treatments (D8) and physic-chemical treatments (D9) that are not supposed to be reported in accordance with the waste statistics regulation.
- Dismantling of cars has not been included as a treatment method. We have classified dismantling of cars as pre-treatment. This means that end-of-life vehicles are counted as waste twice: first, they are generated as hazardous waste mostly in the household sector. Then, they reach a car dismantler (NACE 51.57) who removes reusable components and hazardous products. This generates non-hazardous
end-of-life vehicles as waste. Hazardous components (oils, anti-freeze, etc.) are also generated as waste.
The accuracy of the data on the generation of waste and recovery and disposal of waste is described in detail in Appendices 2 - 10 for the different sectors. The text is structured on the basis of the headings dictated by Eurostat. This has occasion-ally led to difficulties as the headings are adapted for simple questionnaire surveys and are difficult to apply when several survey methods have been used, especially if different methods have been used for different sub-sectors within a sector. All the relevant information has however been included.
2.1 Sampling errors
Sampling errors occur when only a selection of the local units/facilities/enterprises that are included in the group in question is surveyed. The error is due to the degree of variation in the data and can be controlled by choosing the right sample design.
Different sampling methods have been used in some sectors within NACE D (Manufacturing). Sampling errors occur primarily when extrapolations are carried out of inhomogeneous groups. If the sample group is small, it is easy for extreme values from one responding local unit to result in a considerable adjustment error. This is reflected at the same time in the coefficients of variation. Sampling errors for generated and treated waste and treatment capacity are described in Appendix 4 for the sectors examined using sample surveys within NACE D.
2.2 Non-sampling errors
2.2.1 COVERAGE ERRORS
2.2.1.1 Coverage errors regarding the population
Coverage errors regarding the population occur when the survey method results in waste:
- quantities from some local units/facilities included in the target group be-ing missed in the survey, known as “undercoverage”.
- the same local unit or facility is included in several sub-surveys, known as “overcoverage”.
Coverage errors lead to waste quantities either being missed or counted twice. Coverage errors are described in more detail in Appendices 2 - 10 for generated waste, the recovery and disposal of waste and the capacities for recovery and dis-posal for each sub-survey.
Different frames have been used in different surveys, i.e.:
• NACE C and NACE D are based on local units in the Statistics Swe-den Business Register.
• NACE E (sub-sector Energy production from combustion) is based on the register of energy enterprises used for the official energy statistics.
• NACE 90 (sector NACE 90.02 Collection and treatment of other waste) is based on the emissions database (EMIR) from the county administrative boards and the Swedish Environmental Protection Agency, which covers facilities with permits for environmentally harmful operations according to the Environmental Code. Facilities with permits for the treatment of waste were selected from this data-base.
• NACE 37 and 51.57 are based on a combination of EMIR and the Business Register.
Within many sub-sectors, supplementary sources, such as sector organisations or environmental reports, have also been used.
The use of different frames can, in theory, have resulted in both overcoverage (an object being counted twice in several surveys) and undercoverage (an object being missed by several frames) in several sectors. The different surveys have been checked against each other with the aim of detecting any objects that have ap-peared in several of the frames. Any cases identified where data have apap-peared twice have been corrected. We therefore assume that no data have been counted twice.
None of the questionnaire surveys cover the entire reporting sector in question. The questionnaire surveys are instead designed to capture data on the most impor-tant waste flows in the sector and then supplementary work has been done to achieve 100% coverage. An example of such supplementary work is as follows:
• Results from WStatR 2006 have been used within NACE D for enter-prises with less than 10 employees (20 employees in certain sectors) which were not included in the frame. A supplementary study within NACE D has been performed to capture recovery operations defined by the Mayer Parry judgment, i.e. recovery of paper, plastic, rubber, wood and metal in the manufacturing industry
• Within NACE D, some sub-sectors with small quantities of waste have been excluded from the questionnaire survey. Waste quantities from the previous survey for 2004 have been reused for these.
• Within the Manufacturing industry (NACE D, i.e. NACE 15-36), data for certain sub-sectors have been either partly or entirely gathered from other sources instead of from questionnaire surveys. This applies e.g. to data on large pulp and paper mills from the Swedish Forest In-dustries Association and data on large iron and steelworks from Jernkontoret. Environmental reports have been used for large mines and dressing plants and for petrol refineries.
• Within NACE E, separate studies have been performed or data pro-jected or reused for the most significant operations that have not been covered by the questionnaire survey.
• Within the Sewage and refuse disposal, sanitation and similar activi-ties sector (NACE 90), data from a study performed for reporting in accordance with WStatR 2006 for NACE 90.03 (Sanitation) were used. Further, data from international reporting in accordance with the Sludge Directive have been used for NACE 90.01 Collection and treatment of sewage.
2.2.1.2 Coverage errors regarding waste quantities
The survey has been designed to cover all operations and all households in princi-ple.
We have interpreted the definition of waste rather broadly. Some difficulties af-fecting data collection have been due to the fact that respondents have in practice not fully applied the official definition. This concerns for example:
a. By-products. The boundary between a by-product and waste is sometimes hard to define. The Commission’s Interpretative Communication on waste and by-products specifies some criteria for when a residue product need not be classified as waste, see discussion in Appendix 1. Definitions and interpretations. We have not followed the Interpretative Communication in the survey since the survey had already been planned and started when the communication was published. For example, the following “by-products” (occurring in large quantities) have been classified as waste:
- Off-cuts from sawmills. This is used as a raw material in the pulp industry and for manufacturing pellets. Alternatively, it is used as fuel in e.g. the energy sector.
- Felling residue etc. from forestry. This is sold as fuel to the energy sec-tor.
- Metallic wastes (scrap) from the metal industry. This is sold to the scrap industry (normally in NACE 37 or 51.57) which then sells it on to metalworks (NACE 27).
- Excavated material. The majority of excavated material dug-up during construction or foundation projects is reused in other construction pro-jects.
Data on these wastes are associated with uncertainties since many respon-dents do not consider this material as waste. We have estimated these waste quantities using an extrapolation process, see Appendix 4 (for wood and metallic wastes) and Appendix 6 (excavated material). “Used fuel” in-stead of “incinerated fuel” is requested in the questionnaire survey for the energy sector. This should give good coverage for “by-product fuel” as well.
b. Liquid water-containing waste that is released into sewers. In practice, some liquid waste that is released into sewers the respondents consider it to