A DRIVING SIMULATOR EVALUATION OF ROAD MARKINGS AND
SYMBOLIC SIGNS ON VEHICLE-PEDESTRIAN CONFLICTS
Radhameris A. Gómez
Graduate Researcher, Ph.D. Candidate Human Performance Laboratory
Department of Civil and Environmental Engineering University of Massachusetts Amherst
Amherst, MA 01033 Telephone: 413-545-3393 Email: radha.gomez@gmail.com
Siby Samuel
Graduate Researcher, Ph.D. Candidate Human Performance Laboratory
Department of Mechanical & Industrial Engineering University of Massachusetts Amherst
Amherst, MA 01033 Telephone: 413-545-3393 Email: samuelsiby@gmail.com
Matthew R. E. Romoser Senior Research Scientist Human Performance Laboratory
Department of Mechanical & Industrial Engineering University of Massachusetts Amherst
Amherst, MA 01033 Telephone: 413-545-4543 Email: mromoser@ecs.umass.edu
Luis Roman Gerardino Summer Research Intern Human Performance Laboratory
Department of Mechanical & Industrial Engineering University of Massachusetts Amherst
Amherst, MA 01033 Telephone: 413-545-3393 Email: luis.roman111@gmail.com
Associate Professor
Department of Civil and Environmental Engineering University of Massachusetts Amherst
Amherst, MA 01003 Telephone: 413-545-0228 Email: mknodler@ecs.umass.edu
John Collura Professor
Department of Civil and Environmental Engineering University of Massachusetts Amherst
Amherst, MA 01003 Telephone: 413-687-1957 Email: collura@ecs.umass.edu
Donald L. Fisher Professor and Head
Department of Mechanical & Industrial Engineering University of Massachusetts Amherst
Amherst, MA 01033 Telephone: 413-549-1734 Email: fisher@ecs.umass.edu
ABSTRACT
According to the World Report on Road Traffic Injury Prevention by the World Health Organization, fatalities and injuries involving road traffic have already been a burden to global economic development, seriously influencing safety and the quality of life of people in
countries worldwide. The Decade of Action for Road Safety is upon us and vulnerable road users need our attention. Pedestrians are amongst the most vulnerable of road users. A common way of accommodating pedestrians at non-signalized intersections is through the use of mid-block crosswalks. Pedestrian crashes at marked mid-block crosswalks are often no less frequent than at unmarked mid-block crosswalks.
The risk to pedestrians is especially high when a driver’s view of pedestrians in a crosswalk is obstructed as the driver approaches the crosswalk creating a multi-threat situation for the pedestrian. Such a situation is too risky to study on the open road, but not on a driving simulator. Among the most effective and least costly of the safety alternatives are advance yield markings. This study uses a driving simulator to evaluate vehicle-pedestrian conflicts in sight-limited scenarios with advance yield markings and “Yield Here to Pedestrians” symbol signs as well as the standard crosswalk treatments and signs. Measures of drivers’ performance include actual crashes as well as the drivers’ glancing behavior to determine if the drivers approaching a
marked midblock crosswalk look for pedestrians in the crosswalk more frequently and sooner in high risk, multiple-threat scenarios when advance yield markings and prompts are present than when standard markings and prompts are used. The results suggest that fewer crashes occur with advance yield markings. And we find that drivers look much more frequently and much sooner for pedestrians with advance yield markings. Uses and limitations surrounding the development of scenarios on a driving simulator and the advantages and limitations of using driving simulation to study problems such as this are discussed.
1 INTRODUCTION
Safety data for the United States indicate that a pedestrian is killed in a crash every 110 min and one is injured every 9 min (Copeland, 2008). Pedestrian crossings at midblock points are an important issue to be addressed for operations and safety. Various traffic control devices are employed at a typical midblock crosswalk, including pavement markings, advance warnings, and traffic signals (Lu & Noyce, 2009).
Pedestrians are the most vulnerable road users and are at a greater risk of being injured in a traffic crash than vehicle occupants. Seventy-two percent of all pedestrian deaths occur at non-intersections. Contrary to popular belief, nearly 90% of pedestrian fatalities occur during normal weather conditions, as opposed to rain, fog or snow. Nearly 70% of all fatalities occur at night, and nearly half occur on Friday, Saturday or Sunday (National Highway Traffic Safety Administration (NHTSA) 2009). In developing countries, pedestrians represent the group of road users with the largest number of fatalities (Mohan, Tiwari, Khayesi, & Nafukho, 2006) Studies generally point to male pedestrians as those most frequently involved in pedestrian crashes, and they point to the elderly and children as the most vulnerable pedestrians (Campbell, Zegeer, Huang, & M. J. Cynecki, 2004).
Pedestrian walking patterns represent a huge challenge for both engineers and drivers.
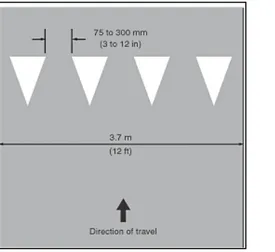
One of the preferred methods traditionally used to accommodate heavy pedestrian activity is the use of mid-block crosswalks. A number of alternatives to the traditional (standard stop line) midblock crosswalk markings and the “Yield Here to Pedestrians” sign ( Figure 1, right side) have been proposed as ways to decrease vehicle-pedestrian conflicts at marked midblock crosswalks (Pradhan, Divekar, Masserang, Romoser, Zafian, Blomberg, Thomas, Reagan, Knodler, Pollatsek, & Fisher, 2010). Among the most effective and least costly of the alternatives are advance yield markings (Zeeger, Stewart, Huang, & Lagerwey, 2001; Snyder, 1972). Advance yield markings are a set of solid white triangles that linearly extends across the lane(s) in the direction of travel. The triangles, also referred to as “Shark’s teeth”, point towards approaching vehicles (Figure 1, left side). Yield markings (either standard or advanced) are placed upstream of the crosswalks to indicate the point at which the yield must be made. A sign (“Yield Here to Pedestrians”) is placed adjacent to the yield markings. Information on the dimensions and placement of the advance yield markings and its associated sign are provided in the Manual on Uniform Traffic Control Devices (2009 Edition; also see Van Houten, Malenfant, & McCusker, 2001). Advance yield markings currently have the status of a guidance, not a standard.
Figure 1: Left: Example of Yield Line Layout. Right: Advance Yield Sign R1-5 (Source: MUTCD, 2009)
The research reported below is an attempt to determine whether additional evidence should be gathered to help in the determination of whether to change the status of advance yield markings from a guidance to a standard. Specifically, the research reported in this article examined the effect of advance yield markings and advance yield signs on both drivers’ and pedestrians’ behavior at midblock crosswalks, especially in those multi-threat situations where the drivers’ or pedestrians’ view of critical information is obstructed by one or more vehicles (Figure 2) Previous research suggests that advance yield markings and advance yield signs do provide significant advantages over other, more common midblock treatments; the question is whether the combination of the advance yield markings and their placement further upstream of the crosswalk prompt the driver to scan sooner for pedestrians and yield further back from the crosswalk as a result.
To address this concern, a driving simulator and an eye tracker was used to measure drivers’ awareness of the potential for pedestrian-vehicle conflicts as well as the occurrence of actual or potential vehicle-pedestrian conflicts at midblock crosswalks. Measures of drivers’ awareness were obtained by monitoring the drivers’ point of gaze to determine if the drivers approaching an a midblock crosswalk looked for pedestrians more frequently in high risk scenarios when advance yield markings and associated yield signs were present than they do when the advance yield markings were not present and a yield sign and stop line were placed just in front of the marked crosswalk.
Figure 2: Sight-Limited Scenario. Left Panel: Standard Yield Markings and Sign. Right Panel: Advance Yield Markings and Sign.
Previous comparisons of advance yield markings (AYM) and standard yield markings (SYM) indicate that when the sight distance is suitable, drivers exposed to AYM yield more often and do so farther upstream of the crosswalk (Zeeger et al., 2001; Snyder, 1972). (Note that we speak of the comparison of AYM with SYM we are referring to the comparison of the advance yield markings upstream of the crosswalk with the standard yield markings adjacent to the crosswalk.) Additionally, again when the sight distance is suitable, drivers exposed to AYM glance towards the area where a pedestrian might emerge from behind an obstruction more often (Van Houten, McCusker, Huybers, Malenfant, JEL, & Rice-Smith, 2002). However, when the sight distance is limited, as in Figure 2 (orange car represents obstruction) there is no increase in yielding behavior for those exposed to AYM, although those drivers who do yield do so sooner.
A driving simulator allows one to evaluate the most dangerous of the marked, mid-block scenarios in the field, a scenario where a pedestrian emerges suddenly in the crosswalk. Such a study was undertaken by Garay-Vega et al. in 2007. In this study, participants were asked to navigate two virtual drives of approximately 10 minutes each. Each drive consisted of multiple marked, mid-block crosswalk scenarios, some of which were sight-limited and some of which were not. In the experimental scenarios (sight-limited), an obstruction appeared in the right or left lane of two travel lanes on the immediate near side of advance yield or standard yield markings. The obstruction consisted of one or more vehicles (parked cars and/or trucks). A pedestrian was never present in the crosswalk in any of the experimental scenarios included in the first drive or the initial scenarios of the second drive, but was always present in the last experimental scenario of the second drive. For the last scenario, an invisible trigger was placed on the road at the same location for the AYM and SYM conditions. When the driver crossed the trigger, the pedestrian started walking towards and then into the crosswalk, emerging from behind the stopped vehicle but then turning back so that no collision would occur. Drivers exposed to the AYM yielded 61% of the time whereas drivers exposed to the SYM never
yielded. By design, there were no crashes since the pedestrian never entered the driver’s travel lane.
What the above study doesn’t tell us is whether the driver would have actually struck the pedestrian if the pedestrian had proceeded to cross the street. We also do not know from the above study whether a larger difference in the two conditions might have been observed if drivers had been performing a secondary task at the same time as they were driving. Thus, the number of potential collisions that was imputed was potentially much smaller than it would have been in the AYM condition if the pedestrian had actually continued walking and the driver was performing a secondary task. A recent study was run which overcame these two limitations (Gomez et al., 2011). It was found that there more crashes in the AYM condition than the SYM condition. Although the difference was statistically significant, the total number of participants was relatively small. Thus, in this study the number of participants was increased.
2 METHODOLOGY
Participants in the study were asked to navigate through a world that consisted of a number of unsignalized, marked midblock crosswalks while performing a secondary task. Participants were told to follow all standard rules of the road and remain in the right most travel lane unless they needed to overtake another vehicle. As the driver approached a crosswalk, simulated pedestrians would sometimes be triggered to cross the street, either from the left or right sides of the road. When pedestrians were present, there was never an obstruction in the travel lane adjacent to the driver except for the last scenario. When no pedestrians were present, sometimes an obstruction was placed in the adjacent travel lane and sometimes not. The distance between the crosswalk and the obstruction was consistent with the placement of the markings throughout the drive - 10ft in front of the crosswalk for the standard condition and 30ft upstream of the crosswalk for the advanced yield marking condition. The obstruction encountered by the participant driver was always a work zone on the left lane which consisted of cones surrounding construction equipment. Dimensions and placement of the yield markings followed the guidelines of the 2009 Edition of the Manual on Uniform Traffic Control Devices for Streets and Highways (MUTCD, 2009)
2.1 Participants
A total of thirty-nine successful participants were used in this study. Participation was distributed amongst three main age groups: 18-19, 25-40, and 45-60 years old. Nineteen (19) participants were randomly assigned to the control (standard markings or SYM) and twenty (20) participants were assigned to the experimental (advance yield markings or AYM) conditions. Participants in either group had some level of familiarity on the road with the advance yield markings and the associated sign. Subjects in both groups indicated they frequently drive in the vicinity of Amherst, Massachusetts where yield markings have been installed for at least three years. Subjects were recruited from the local area using information posted around the University of Massachusetts Amherst, regional online newspapers, and local businesses. Participants were compensated $25 for their participation.
2.2 Stimuli
The SYM condition consisted of a stop line placed 10 ft before the crosswalk and its associated sign, asking drivers to yield for pedestrians. Similarly, the AYM condition consisted of advance yield markings and prompt signs. Yield markings were placed 30 feet upstream of the crosswalks to indicate the point at which the driver was expected to yield. Dimensions and placement of the yield markings followed the guidelines of the 2009 Edition of the Manual on Uniform Traffic Control Devices for Streets and Highways (MUTCD, 2009).
2.3 Design and Description of Simulator Drive
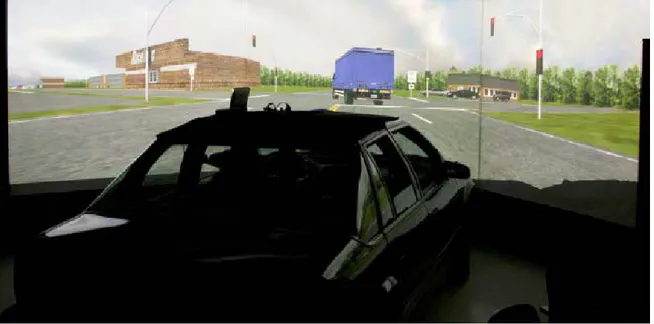
2.3.1 Driving Simulator
The driving simulator setup consists of a fully equipped 1995 Saturn sedan placed in front of three screens subtending 135 degrees horizontally (Figure 3). The virtual environment
is projected on each screen at a resolution of 1400 × 1050 pixels and at a frequency of 60 Hz. The participant sits in the car and operates the controls, moving through the virtual world according to his or her inputs to the car. The audio is controlled by a separate system that consists of four high frequency speakers located on the left and right sides of the car and two sub-woofers located under the car. This system provides realistic road, wind and other vehicle noises with appropriate direction, intensity, and Doppler shift.
Figure 3: University of Massachusetts Amherst Driving Simulator (Source: http://www.ecs.umass.edu/hpl)
2.3.2 Scenarios
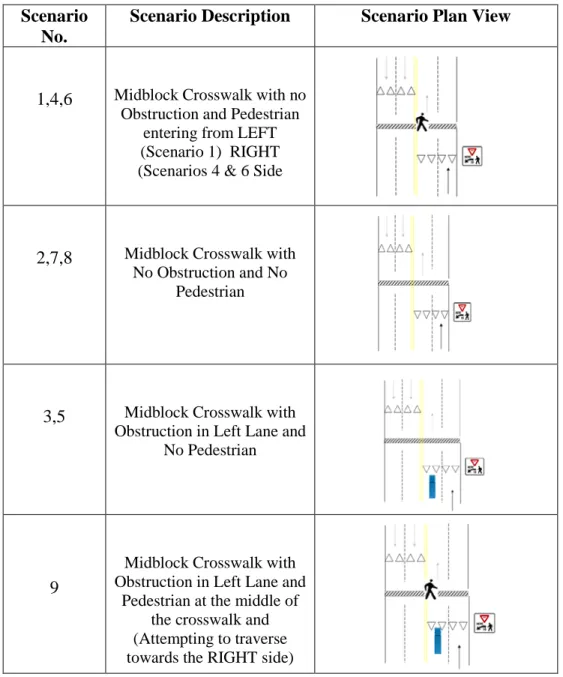
Participants were randomly assigned to a single drive, either the SYM drive with the standard yield markings and associated sign or the AYM drive with the advanced yield markings and associated sign. There were a total of 9 identical scenarios in either drive (Table 1). Each drive was made up of four types of scenarios with 2 factors varied orthogonally: the presence or absence of an obstruction in left lane and the presence or absence of a pedestrian at the side of the crosswalk. A top-view and description of each scenario is provided in Table 1 below.
Pedestrian presence was included in the simulation (e.g., pedestrians completing street crossings at unobstructed intersections) to show the driver that it was possible to encounter such an event elsewhere throughout the simulation. As shown in Table 1, a pedestrian was present in the crosswalk during the first, fourth, sixth and last (sight-limited) scenarios of both drives. In the last scenario, there was a programmed (invisible) trigger on the road at the same location for the SYM and AYM conditions; when the driver crossed the trigger the pedestrian started walking towards and into the crosswalk. Walking characteristics such as the initial position, speed and time of entry of the pedestrian were coordinated to remain the same for all participants in both the AYM and SYM conditions, regardless of where the markings were placed on the road. This makes the last scenario one in which we can determine whether drivers maintain their vigilance in both the AYM and SYM conditions. Scenario descriptions and plan views are shown below (Table 1). The obstruction is represented by the blue truck; the north pointing arrow represents the direction of travel of the participant driver.
Table 1: Description of Scenarios in Advanced Yield Marking and Standard Yield Markings Used on Driving Simulator. (The obstruction is represented by blue truck. The driver’s direction of travel is represented by the north pointing arrow in the bottom of the far right travel lane.)
Scenario No.
Scenario Description Scenario Plan View
1,4,6 Midblock Crosswalk with no Obstruction and Pedestrian
entering from LEFT (Scenario 1) RIGHT (Scenarios 4 & 6 Side
2,7,8 Midblock Crosswalk with No Obstruction and No
Pedestrian
3,5 Midblock Crosswalk with Obstruction in Left Lane and
No Pedestrian
9
Midblock Crosswalk with Obstruction in Left Lane and
Pedestrian at the middle of the crosswalk and (Attempting to traverse towards the RIGHT side)
2.3.3 Procedure
Participants were given an Informed Consent form and were then provided with a pre-test questionnaire consisting of questions related to the participant’s driving history and
demographics. A Simulator Sickness Questionnaire (SSQ) (Kennedy et al., 1993) was given as a pre-test and post-test in order to asses any symptoms. The pre-test was followed by an introduction to the driving simulator along with a practice drive of about 5 minutes in length. The post-test also included one multiple choice question used to assess the participant’s understanding of the advance yield marking.
The participant was familiarized with the simulator through practice scenarios that included situations where the driver approached uncontrolled, marked mid-block crosswalks with an obstruction in the left lane. The virtual world was made to look like an urban environment with a posted speed limit of 30 mph. The driver traveled a two-way/four-lane road with controlled traffic in the opposite direction. Participants were instructed to remain in the right-most lane at all times unless they needed to overtake a vehicle. Each participant was randomly assigned to one drive, either the drive that contained nine scenarios with SYM markings or another drive that contained nine scenarios with AYM markings (the order of the scenarios was the same for each drive and is represented by the assigned numerical value as shown in Table 1). Each participant navigated only one of these drives. Participants followed directional display signs just before intersections that were provided to guide them along the virtual environment to an unknown destination.
The participants were given a secondary task to increase cognitive load (Muttart, Fisher, Knodler & Pollatsek, 2007) while driving. There were a set of 50 sentences scripted into the drive. These 50 sentences were played using an audio player and the participants were asked both to identify the subject and object of the sentence and to indicate whether the sentence made sense. An example would be, “Matt picked up the tractor”. The expected response for the above sentence would be, “Matt, Tractor, and No”. A four second pause was inserted between sentences to provide the participants with sufficient time to cognitively process the information. As part of the practice drive, participants were given a practice run with the cognitive loading task.
2.3.4 Dependent Variables
The dependent variables for our two main scenarios of interest (Scenario 4 and Scenario 9) were: whether the drive glanced at the area on the roadway from which a pedestrian could emerge, whether drivers yielded, and whether drivers had a near crash or actual crash.
It was assumed that drivers predicted the risk if they glanced toward the side of the road where a pedestrian may emerge or is actually located. If the driver looked towards this area, a hit or a correct response was recorded (value=1); otherwise a miss was recorded (value=0). Drivers were scored as yielding if they initiated braking in advance of the crosswalk and gradually slowed before stopping. Drivers were scored as not yielding if they ignored the pedestrian either by passing in front of the pedestrian or not stopping when the pedestrian arrived at the crosswalk. As it relates to collisions, drivers were scored for collisions if the participants failed to apply the brakes in time to avoid contact with the pedestrian on the crosswalk. Near collisions were defined as collisions that were effectively avoided due to last minute evasive maneuvers employed by the participants – such as slamming on their brakes and swerving.
2.3.5 Hypotheses
Knowing that drivers are looking more often in the AYM condition than in the SYM condition, it is then not unreasonable to expect differences in the behavior of the drivers when the advance yield markings are present. It was anticipated that drivers approaching a crosswalk would be more likely to look for pedestrians when the crosswalks have advance yield markings and their associated pedestrian crosswalk signs than when they have the standard traditional markings and signs. It was also expected that the frequency of drivers’ stopping/yielding behaviors would be higher when advance yield markings were used. Finally, it was hypothesized that due to the shorter response time available in the SYM condition drivers assigned to this drive would experience more collisions
3 RESULTS & DISCUSSION
3.1 Crashes
The total number of crashes and near crashes for Scenarios 4 and 9 in the SYM condition (28) is exactly twice as high as it is in the AYM condition (14) (Table 2). Looking just at the number of crashes, this number in the SYM condition is four times (24) that of the AYM condition (6). Using the two scenarios of interest (Scenarios 4 and 9), we reject the hypothesis that the number of crashes in the AYM and SYM conditions is identical, Χ2
(1) = 10.8, p < .001. In the critical last scenario, drivers in the SYM condition have 15 crashes whereas drivers in the AYM condition only have one crash (the person who crashed did not take any precautionary glances throughout the entire drive).
It is important to note that the number of crashes in Scenario 4 is much larger in the SYM condition (9 crashes) than it is in the AYM condition (1 crash). In this condition, there is no obstruction to vision. A pedestrian enters the crosswalk on the right hand side and continues walking into the path of the driver. There is plenty of time for the driver to yield, yet clearly such did not happen in many cases for the drivers in the SYM condition.
In a later repetition of this scenario, Scenario 6, drivers have seemingly become more cautious. There are no crashes in either the AYM or SYM conditions. This indicates that drivers were alerted to the potential pedestrian and were more cautious the second time that they were exposed to the scenario.
This raises the question of whether the crashes and near crashes in Scenarios 4 and 6 which occurred early in the drive sensitized the drivers to the possible emergence of pedestrians in the very last scenario (Scenario 9). This should greatly have attenuated the number of crashes in the very last scenario. However, the sharp increase in the number of crashes in Scenario 9 (23 crashes) compared to Scenario 6 (2 crashes) shows that drivers were not expecting the pedestrian to appear behind the obstruction.
Table 2: Number of Crashes and Near Crashes in AYM and SYM Conditions for Scenarios Interest
No. Scenarios of Interest AYM SYM
Crashes Near
Crashes
Crashes Near
Crashes 4 No Obstruction and Pedestrian entering from RIGHT Side 5 0 9 4 6 No obstruction and Pedestrian entering from RIGHT Side 1 1 1 1
9 Obstruction in Left Lane and Pedestrian at the middle of the crosswalk and (Attempting to traverse towards the RIGHT side)
1 8 15 0
Total 7 9 16 5
Average 0.35 0.45 1.31 0.26
The fact that drivers in the SYM condition have 15 crashes in the last scenario whereas drivers in the AYM condition only have one crash (this person did not take any precautionary glances throughout the entire drive) supports the effectiveness of placing advance yield markings upstream of the crosswalk. However, clearly more work needs to done. On the one hand, one cannot determine from this study whether the standard yield markings would have been as effective as the advance yield markings had they been placed far upstream of the crosswalk. On the other hand, one cannot determine whether the advance yield markings would have been just as effective had they been placed as close to the crosswalk as had the standard yield markings. All one knows is that installing advance yield markings upstream is more effective than installing standard yield markings downstream. More research will be needed to tease apart whether it is the placement; the markings or both that are having the effect they are.
Having said this, there are no obvious disadvantages that come from installing markings considerably upstream of the crosswalk. Thus, until such time as more experiments have been undertaken, it would appear best to install the markings upstream of the crosswalk.
3.2 Glances
Participants who were assigned to the AYM drive glanced more often towards the side (57.54%) than did drivers exposed to the SYM drive (39.5%). The finding that drivers were much more likely in the AYM than the SYM condition to glance towards the pedestrian when an obstruction was present points to the reason that the drivers in the AYM condition have many fewer crashes than do the drivers in the SYM condition. If glance behavior is taken as an indicator of
awareness of a potential pedestrian on the part of the drivers then the driver in the AYM condition is looking more frequently for pedestrians as he or she approaches the obstruction. And the finding that drivers were more likely in the AYM than the SYM condition to glance in Zone 1 towards the pedestrian when no obstruction was present points to the reason that the drivers in the AYM condition are more likely to yield, as reported in several studies (Van Houten et al., 2002; Gomez et al., 2011)
3.3 Limitations of Driving Simulation
A major worry when using driving simulators is that the participants may not treat their driving as seriously as they do in the real world. Increasingly, evidence points to the fact that this is not the case, at least with respect to patterns of visual search (Garay-Vega, Fisher, Knodler, 2008; National Cooperative Highway Research Program, 2004) and the division of attention (Garay et al., 2008). But, there is still a very real concern that what one learns on a driving simulator may not generalize to the real world for any one of a number of different reasons.
For this study, there is evidence consistent with the conclusion that the drivers in this experiment were taking their driving seriously, at least in the very last scenario (Scenario 9) specifically. Perhaps somewhat unrealistically drivers in Scenario 4 either crash or have a near crash when a pedestrian enters the crosswalk from the right hand side. The pedestrian is always visible as the driver approaches the crosswalk and clearly appears to be heading towards the crosswalk. However, in a later repetition of that scenario (Scenario 6) we find that only two participants have a crash and near crash. Moreover, in the last scenario which can be considered the most difficult, only one (1) of the drivers exposed to the advanced yield markings actually crashed. Thus, one can have some confidence that the participants in the experiment are taking their driving seriously.
4 CONCLUSIONS
It is very important to consider all factors when planning for the safe accommodation of pedestrians at midblock and other non-signalized intersections. Factors such as demographics, resources and traffic density are only some of the factors that should be taken into account. There are also human aspects such as attention, reaction time and comprehension which can sometimes influence the effectiveness of traffic signals and markings (Wuhong, Hongwei, Ziyou & Heiner Bubb, 2011; Jiangang, Yanyan, Futian, & Rong, 2007). None of these aspects have been described in any detail above, but they are known to impact drivers’ behavior and should also be considered.
In this study, we have discussed the use of scenarios on a driving simulator to evaluate the effectiveness of two different types of pavement markings: advance yield markings and standard yield markings (together with prompt signs). We specifically developed scenarios that could not safely be evaluated in the real world and that were designed to accentuate the differential effectiveness of the two different types of pavement markings. The effects for field implementation are very direct; advance yield markings, both in the field and on the driving simulator, lead drivers both to behave more safely (e.g., look more often for pedestrians) and, as the behaviors imply, actually to crash less frequently on a driving simulator. It cannot be determined from these studies whether it is the upstream placement of the yield markings, the type of yield markings, or the combination which is having an effect. Nevertheless, from the standpoint of practice, the combination clearly averts crashes and the effect is large enough that an argument can be made that advance yield markings should become a standard in the MUTCD instead of simply guidance.
Having said this, it could prove useful in the future to determine how much of the advantage of advance yield markings is due to their placement upstream of the crosswalk and how much of
the advantage is due to their shape (diamonds). Moreover, it would be important to determine where the placement minimizes the likelihood of a crash.
5 ACKNOWLEDGEMENTS
This research has been supported in part by a grant from the New England University Transportation Center to John Collura and Donald Fisher and by a grant to Donald Fisher from the National Institutes of Health (R01HD057153). Its contents are solely the responsibility of the authors and do not necessarily represent the official views of either agency.
REFERENCES
Copeland, L. Cities Try to Improve Crosswalk Safety. USA Today (online news) 24 Feb. 2008.Web. 11 Dec.2012.
www.usatoday.com/news/nation/2008-02-24 crosswalk_N.htm
Campbell, B. J., C. V. Zegeer, H. H. Huang, and M. J. Cynecki. A Review of Pedestrian Safety
Research in the United States and Abroad. FHWA-RD-03-042. FHWA, U.S. Department
of Transportation, 2004.
FHWA, U.S. Department of Transportation (2009). Manual of Uniform Traffic Control Devices (MUTCD). 2009 Edition.
Garay-Vega, L., Fisher, D.L., Pollatsek, A., 2007. Hazard Anticipation of Novice and Experienced Drivers: Empirical Evaluation on a Driving Simulator in Daytime and Night time Conditions. Transportation Research Record: Journal of the Transportation Research Board, No. 2009, Transportation Research Board of the National Academies, Washington, DC, pp. 1–7.
Garay-Vega, L., Fisher, D. L., Knodler, M. (July 2008). Evaluation of Drivers Performance in Response to Sight-Limited Crash Scenarios at Midblock Crosswalks: Benefits of
Advance Yield Markings and Symbolic Signage. Proceedings of the Annual Meetings of
the Human Factors and Ergonomics Society, New York, New York.
Garay, Lisandra. (Co-Advisor with Michael Knodler, CEE). Drivers Performance In Response
To Sight-Limited And Multi-Threat Crash Scenarios At Mid-Block Crosswalks: An Evaluation Of Advance Yield Markings And Sign Prompts. University of Massachusetts,
CEE, May 2008.
Gomez, R. A., Samuel, S. Gerardino, L. R., Romoser, M. R. E., Collura, J., Knodler, M., and Fisher, D. L. Do advance yield markings increase safe driver behaviors at unsignalized, marked midblock crosswalks? Transportation Research Record: Journal of the
Transportation Research Board, No. 2264, 2011, pp. 27-33.
Jiangang Shi, Yanyan Chen, Futian Ren, and Jian Rong Research on Pedestrian Behavior
and Traffic Characteristics at Unsignalized Midblock Crosswalk Case Study in Beijing Transportation Research Record: Journal of the Transportation Research Board, No.
2038, Transportation Research Board of the National Academies, Washington,
D.C., 2007, pp. 23–33
Kennedy, R.S.,LaneN.E.,Berbaum K.S., and Lilienthal M.G., Simulator sickness questionnaire: an enhanced method for quantifying simulator sickness. International Journal of
Aviation Psychology, 3(3):203-220, 1993
Lu, G., and Noyce, D. (2009) . Pedestrian Crosswalks at Midblock Locations: Fuzzy Logic Solution to Existing Signal Operations. Transportation Research Record,2140, 63-78. Mohan, D., G. Tiwari, M. Khayesi, and F. M. Nafukho. Road Traffic Injury Prevention Training
Manual. World Health Organization, Geneva, Switzerland, and Indian Institute of
Technology Delhi, India, 2006.
Muttart, J., Fisher, D. L., Knodler, M. and Pollatsek, A. (2007). Driving Simulator Evaluation of Driver Performance during Hands-Free Cell Phone Operation in a Work Zone: Driving without a Clue Transportation Research Record, 2018, 9-14
National Highway Traffic Safety Administration (NHTSA), National Center for Statistics and Analysis. Traffic Safety Facts, 2009 Data. Department of Transportation Publication No DOT HS 811 394, 2009.
NCHRP Report 500. (2004) Guidance for implementation of the AASTHO Strategic Highway
Safety Plan. Volume 10. A Guide for reducing collision involving pedestrians.
Washington, D.C.: Transportation Research Board
Pradhan, A. K., Pollatsek, A., Knodler, M. and Fisher, D. L. (2009). Can younger drivers be trained to scan for information that will reduce their risk in roadway traffic scenarios that are hard to identify as hazardous? Ergonomics, 62, 657-673.
Pradhan, A.K., Divekar, G, Masserang, K., Romoser, M., Zafian, T., Blomberg, R.D., Thomas, F.D., Reagan, I., Knodler, M., Pollatsek, A. and Fisher, D.L. (May 2010). The effects
of focused attention training (FOCAL) on the duration of novice drivers’ glances inside and outside the vehicle (technical report). Amherst, MA: Human Performance
Laboratory, Department of Mechanical and Industrial Engineering, University of Massachusetts Amherst.
Snyder, M.B. (1972). Traffic engineering for pedestrian safety: some new data and solutions.
Highway Research Records, 406, 21-27.
Van Houten, R., Malenfant, J. E. L., and McCusker, D. (2001). Advance yield markings reduce motor vehicle/pedestrian conflicts at multilane crosswalks with an uncontrolled
approach. Transportation Research Record,1773, 69-74.
Van Houten, R., McCusker, D, Huybers, S, Malenfant, JEL, Rice-Smith, D. (2002). Advance yield markings and fluorescent yellow-green RA-4 signs at crosswalks with
uncontrolled approaches. Transportation Research Record, 1818, 119-124.
Wuhong Wang, Hongwei Guo, Ziyou Gao & Heiner Bubb (2011): Individual differences of pedestrian behaviour in midblock crosswalk and intersection, International Journal of Crashworthiness, 16:1, 1-9
Zeeger, C. V., Stewart, J. R., Huang, H. and Lagerwey, P. (2001). Safety effects of marked versus unmarked crosswalks at uncontrolled locations: Analysis of crashes in 30 cities. Transportation Research Record, 1773, 56-68.