Master Thesis in International Marketing: EFO705
School of Sustainable Development of Society and Technology
Internationalization of Pricing Strategy
(A case study on 9-Ending Prices using by Thai and Swedish retailers)
Group 2566
Ms. Naree Kupadakvinij (840310)
Ms. Saruta Cholviroj (831029)
Superviosr: Jean-Charles Languilaire
Examiner: Ole Liljefors
Abstract
Date June 4, 2010.
Program MIMA- International Marketing
Course Name Master Thesis (EFO705)
Title
Internationalization of Pricing Strategy
(A case study on 9-Ending Prices using by Thai and Swedish retailers)
Authors
Naree Kupadakvinij Saruta Cholviroj nkj09001@student.mdh.se scj09001@student.mdh.se 840310 831029
Supervisor Jean-Charles Languilaire
Research Problem “Do the 9-ending on promotion prices used by Thai retailers different from
the use of Swedish retailers?”
Purpose The purpose of this thesis is to evaluate the differences between 9-ending
on promotion prices used by Thai retailers and Swedish retailers.
Method
The quantitative research approach is the chosen method in order to evaluate the differences between 9-ending on promotion prices used by Thai retailers and Swedish retailers. The collection of data will be mainly concentrated on primary data through brochures from retailers in both countries.
Conclusion
Evaluation of the price endings for advertised products in the brochures from Thai and Swedish retailers founded the distinctions between the use of 9-ending prices in many ways such as the way the retailers used left and right digits for price endings, the way they set the prices compared between the same product category and the same product sub-category.
Keyword 9-Ending Prices, Price Endings, Left Digit, Right Digit, Two Ending
Table of Contents
Chapter 1: Introduction ...1 1.1 Background ...1 1.2 Problem Statement ... 2 1.3 Purpose ... 3 1.4 Limitation ... 3 1.5 Audience ...3 1.6 Thesis Structure ...4Chapter 2: Theoretical Framework ...5
2.1 Psychological Pricing ... 5
2.2 Odd-Even Pricing ...5
2.3 The 9-Ending Prices ... 6
2.3.1 Left Digit ... 6
2.3.2 Right Digit ...7
2.4 Cognitive Effect of Price Endings ...7
Chapter 3: Conceptual Framework ...9
Chapter 4: Method ... 10
4.1 Choices of Research Approach ... 10
4.1.1 Qualitative Research ... 10
4.1.2 Quantitative Research ... 10
4.2 Choices of Data Collection ... 11
4.2.1 Secondary Data ... 11
4.2.2 Primary Data ... 11
4.3 Collection of Data in the Research ... 12
4.3.1 Sources of Data... 12 4.3.1.1 Brochure ... 12 4.3.1.2 Promotion Price ... 12 4.3.1.3 Price Ending ... 13 4.3.2 Period of Collection ... 15 4.3.3 Retailers ... 15 4.3.3.1 Thai Retailers ... 15 4.3.3.2 Swedish Retailers ... 16
4.3.4 Selected Product Category... 17
4.3.4.1 Food Category ... 18
4.3.4.2 Personal Care Products Category ...18
4.3.4.3 Electrical Appliances Category ... 20
4.4 Analyzing Tool ... 21
4.5 Validity and Reliability of the Research ... 21
Chapter 5: Empirical Material ... 23
5.1 Overview of Collected Brochures and Prices ... 23
5.1.1 Thailand ... 23
5.2 Prices Ending Digits in Two Countries ... 30
5.2.1 Thailand ... 30
5.2.1.1 Left Ending Digits ... 30
5.2.1.2 Right Ending Digits ...31
5.2.2 Sweden ... 32
5.2.2.1 Left Ending Digits ... 32
5.2.2.2 Right Ending Digits ...33
5.3 Prices Ending Digits of Product Categories ... 34
5.3.1 Thailand ... 34
5.3.1.1 Left Ending Digits ... 34
5.3.1.2 Right Ending Digits ...40
5.3.2 Sweden ... 41
5.3.2.1 Left Ending Digits ... 41
5.3.2.2 Right Ending Digits ...46
5.4 Prices Ending Digits of Product Sub-Categories ... 48
5.4.1 Thailand ... 48
5.4.1.1 Left Ending Digits ... 48
5.4.1.2 Right Ending Digits ...54
5.4.2 Sweden ... 56
5.4.2.1 Left Ending Digits ... 56
5.4.2.2 Right Ending Digits ...59
5.5 Prices Ending Digits from Selected Retailers ... 62
5.5.1 Thailand ... 62
5.5.1.1 Left Ending Digits ... 62
5.5.1.2 Right Ending Digits ...64
5.5.2 Sweden ... 65
5.5.2.1 Left Ending Digits ... 65
5.5.2.2 Right Ending Digits ...66
Chapter 6: Analysis ... 67
6.1 Price Endings in Two Countries ... 67
6.1.1 Differences between Left Ending Digits ………..67
6.1.2 Differences between Right Ending Digits ………... 70
6.2 Price Endings of Product Categories ... 71
6.2.1 Food Category ……….. 71
6.2.1.1 Differences between Left Ending Digits ………... 71
6.2.1.2 Differences between Right Ending Digits ……… 74
6.2.2 Personal Care Products Category ………. 76
6.2.2.1 Differences between Left Ending Digits ………... 76
6.2.2.2 Differences between Right Ending Digits ……… 77
6.2.3 Electrical Appliances Category ……… 78
6.2.3.1 Differences between Left Ending Digits ……….. 78
6.3 Price Endings of Product Sub-Categories ... 80
6.3.1 Food Category ……….. 80
6.3.1.1 Differences between Left Ending Digits ………... 80
6.3.1.2 Differences between Right Ending Digits ……… 81
6.3.2 Personal Care Products Category ………. 81
6.3.2.1 Differences between Left Ending Digits ………... 81
6.3.2.2 Differences between Right Ending Digits ……… 81
6.3.3 Electrical Appliances Category ………. 81
6.3.3.1 Differences between Left Ending Digits ……….. 81
6.3.3.2 Differences between Right Ending Digits ……… 82
6.4 Price Endings from Selected Retailers (Tesco-Lotus & Coop) ... 82
6.4.1 Differences between Left Ending Digits ………..82
6.4.2 Differences between Right Ending Digits ………... 84
Chapter 7: Conclusion ... 86
7.1 The Answer to the Research Question ... 86
7.2 Reflection ... 86
7.3 Contribution ... 87
7.4 Suggestion for Further Research ... 87
List of Figures and Tables
Figures Chapter 3
Figure 1: Conceptual Framework (developed by the authors)………... 9
Chapter 4 Figure 2: Collected Price from the Brochure………...………...13
Figure 3: Products in Food Category from retailer’s brochure………...18
Figure 4: Products in Personal Care Products Category from retailer’s brochure………. 19
Figure 5: Products in Electrical Appliances Category from Retailer’s Brochure……….. 20
Chapter 6 Figure 6: Ten most commonly used numbers for two price ending digits from the leftmost digit in Thailand………. 68
Figure 7: Ten most commonly used numbers for two price ending digits from the leftmost digit in Sweden………... 68
Figure 8: Numbers used for the last price ending digits of left digits in Thailand……… 69
Figure 9: Numbers used for the last price ending digits of left digits in Sweden………. 69
Figure 10: The most commonly used numbers for right price ending digits in Thailand…………. 70
Figure 11: The most commonly used numbers for right price ending digits in Sweden…………... 71
Figure 12: Ten most commonly used numbers for two price ending digits from the leftmost digit of Food Category in Thailand……… 72
Figure 13: Ten most commonly used numbers for two price ending digits from the leftmost digit of Food Category in Sweden………. 72
Figure 14: Numbers used for the last price ending digits of left digits of Food Category in Thailand………. 73
Figure 15: Numbers used for the last price ending digits of left digits of Food Category in Sweden………... 73
Figure 16: The most commonly used numbers for right price ending digits of Food Category
in Thailand………. 74 Figure 17: The most commonly used numbers for right price ending digits of Food Category
in Sweden………... 74 Figure 18: Ten most commonly used numbers for two price ending digits from the leftmost digit
of Personal Care Products Category in Thailand………... 75 Figure 19: Ten most commonly used numbers for two price ending digits from the leftmost digit
of Personal Care Products Category in Sweden……… 75 Figure 20: Numbers used for the last price ending digits of left digits of Personal Care Products Category in Thailand………..76 Figure 21: Numbers used for the last price ending digits of left digits of Personal Care Products Category in Sweden………... 76 Figure 22: The most commonly used numbers for right price ending digits
of Personal Care Products Category in Thailand……….. 77 Figure 23: The most commonly used numbers for right price ending digits
of Personal Care Products Category in Sweden……… 77 Figure 24: Ten most commonly used numbers for two price ending digits from the leftmost digit of Electrical Appliances Category in Thailand……… 78 Figure 25: The most commonly used numbers for two price ending digits from the leftmost digit of Electrical Appliances Category in Sweden……… 78 Figure 26: The most commonly used numbers for the last price ending digits of left digits
of Electrical Appliances Category in Thailand……… 79 Figure 27: The most commonly used numbers for the last price ending digits of left digits
of Electrical Appliances Category in Sweden……… 79 Figure 28: Ten most commonly used numbers for two price ending digits from the leftmost digit by Tesco-Lotus………... 82
Figure 29: Ten most commonly used numbers for two price ending digits from the leftmost digit
by Coop……….. 83
Figure 30: Numbers used for the last price ending digits of left digits by Tesco-Lotus……… 83
Figure 31: Numbers used for the last price ending digits of left digits by Coop………... 84
Figure 32: The most commonly used numbers for right price ending digits by Tesco-Lotus……... 85
Figure 33: The most commonly used numbers for right price ending digits by Coop……….. 85
Tables Chapter 4 Table 1: Left Digits and Right Digits……….14
Table 2: Two Digits from the Leftmost Digit and the Last Ending Digit of Left Digits…………... 14
Table 3: Right Digits and the Rightmost Digit………...14
Chapter 5 Table 4: Quantity of Prices from Thai Retailers……….………...23
Table 5: Sub-Category on Food Products……….. 24
Table 6: Sub-category on Personal Care Products………...…….. 24
Table 7: Sub-category on Electric Appliances………..………. 24
Table 8: Quantity of Odd-Even Price Endings from Thai Retailers………..……… 25
Table 9: Quantity of Prices from Swedish Retailers……….………. 26
Table 10: Sub-category on Food Products………...…………..26
Table 11: Sub-category on Personal Care Products……….. 27
Table 12: Sub-category on ElectricalAppliances……….. 27
Table 13: Quantity of Odd-Even Price Endings from Swedish Retailers………..……… 27
Table 14: Total Price Sets from Coop Chains……….……….. 28
Table 15: Total Price Sets from ICA Chains……….……… 28
Table 16: Total Price Sets from LiDL………..………. 29
Table 18: The Last Price Ending Digit of Left Digits in Thailand……… 31
Table 19: Right Price Ending Digits in Thailand………...………31
Table 20: Rightmost Price Ending Digit in Thailand………...………. 31
Table 21: Two Price Ending Digits from the Leftmost Digit in Sweden……….. 32
Table 22: The Last Price Ending Digit of Left Digits in Sweden……….. 33
Table 23: Right Price Ending Digits in Sweden………...………. 33
Table 24: Rightmost Price Ending Digit in Sweden……….. 34
Table 25: Two Price Ending Digits from the Leftmost Digit of Food Category in Thailand…... 35
Table 26: The Last Price Ending Digit of Left Digits of Food Category in Thailand………..……. 36
Table 27: Two Price Ending Digits from the Leftmost Digit of Personal Care Products Category in Thailand………. 37
Table 28: The Last Price Ending Digit of Left Digits of Personal Care Products Category in Thailand……….……… 38
Table 29: Two Price Ending Digits from the Leftmost Digit of Electrical Appliances Category in Thailand………...……….. 39
Table 30: The Last Price Ending Digit of Left Digits of Electrical Appliances Category in Thailand………. 39
Table 31: Right Price Ending Digits of Food Category in Thailand……….………… 40
Table 32: Rightmost Price Ending Digit of Food Category in Thailand………... 40
Table 33: Right Price Ending Digits of Personal Care Products Category in Thailand……… 40
Table 34: Rightmost Price Ending Digit of Personal Care Products Category in Thailand……….. 41
Table 35: Right Price Ending Digits of Electrical Appliances Category in Thailand…………..…. 41
Table 36: Rightmost Price Ending of Electrical Appliances Category in Thailand………. 41
Table 37: Two Price Ending Digits from the Leftmost Digit of Food Category in Sweden………. 42
Table 38: The Last Price Ending Digit of Left Digits of Food Category in Sweden………...……. 43
Table 39: Two Price Ending Digits from the Leftmost Digit of Personal Care Products Category in Sweden………..………. 44
Table 40: The Last Price Ending Digit of Left Digits of Personal Care Products Category in
Sweden………... 44
Table 41: Two Price Ending Digits from the Leftmost Digit of Electrical Appliances Category in Sweden………...…… 45
Table 42: The Last Price Ending Digit of Left Digits of Electrical Appliances Category in Sweden……… 45
Table 43: Right Price Ending Digits of Food Category in Sweden……….……….. 46
Table 44: Rightmost Price Ending Digit of Food Category in Sweden………. 46
Table 45: Right Price Ending Digits of Personal Care Products Category in Sweden……….. 47
Table 46: Rightmost Price Ending Digit of Personal Care Products Category in Sweden………… 47
Table 47: Right Price Ending Digits of Electric Appliances Category in Sweden……… 47
Table 48: Rightmost Price Ending Digit of Electric Appliances Category in Sweden………... 47
Table 49: Two Price Ending Digits from the Leftmost Digit of Food Sub-Category in Thailand………... 49
Table 50: The Last Price Ending Digit of Left Digits of Food Sub-Category in Thailand………....50
Table 51: Two Price Ending Digits from the Leftmost Digit of Personal Care Products Sub-Category in Thailand……… 51
Table 52: The Last Price Ending Digit of Left Digits of Personal Care Products Sub-Category in Thailand………. 52
Table 53: Two Price Ending Digits from the Leftmost Digit of Electrical Appliances Sub-Category in Thailand………... 53
Table 54: The Last Price Ending Digit of Left Digits of Electrical Appliances in Thailand……… 53
Table 55: Right Price Ending Digits of Food Sub-Category in Thailand……….……. 54
Table 56: Rightmost Ending Digit of Food Sub-Category in Thailand………. 54
Table 57: Right Price Ending Digits of Personal Care Products Sub-Category in Thailand………. 54
Table 58: Rightmost Ending Digit of Personal Care Products Sub-Category in Thailand………… 55
Table 59: Right Price Ending Digits of Electrical Appliances Sub-Category in Thailand………… 55
Table 61: Two Price Ending Digits from the Leftmost Digit of Food Sub-Category in Sweden…. 56
Table 62: The Last Price Ending Digit of Left Digits of Food Sub-Category in Sweden…...…….. 57
Table 63: Two Price Ending Digits from the Leftmost Digit of Personal Care Products Sub-Category in Sweden………57
Table 64: The Last Price Ending Digit of Left Digits of Personal Care Products Sub-Category in Sweden……….……… 58
Table 65: Two Price Ending Digits from the Leftmost Digit of Electrical Appliances Sub-Category in Sweden………..…...58
Table 66: The Last Price Ending Digit of Left Digits of Electrical Appliances in Sweden………. 59
Table 67: Right Price Ending Digits of Food Sub-Category in Sweden………... 59
Table 68: Rightmost Ending Digit of Food Sub-Category in Sweden……….. 60
Table 69: Right Price Ending Digits of Personal Care Products Sub-Category in Sweden……….. 60
Table 70: Rightmost Ending Digit of Personal Care Products Sub-Category in Sweden……….……… 60
Table 71: Right Price Ending Digits of Electrical Appliances Sub-Category in Sweden……... 61
Table 72: Rightmost Ending Digit of ElectricalAppliances in Sweden……….. 61
Table 73: Two Price Ending Digits from the Leftmost Digit Set by Tesco-Lotus……… 63
Table 74: Last Price Ending Digit of the Left Digits Set by Tesco-Lotus……….………… 64
Table 75: Right Price Ending Digits Set by Tesco-Lotus……….. 64
Table 76: Rightmost Ending Digit Set by Tesco-Lotus……….………… 64
Table 77: Two Price Ending Digits from the Leftmost Digit Set by Coop……….…….. 65
Table 78: Last Price Ending Digit of the Left Digits Set by Coop……… 66
Table 79: Right Price Ending Digits Set by Coop……….……… 66
Table 80: Rightmost Ending Digit Set by Coop……… 66
1
1. Introduction
This chapter presents the background of the topic, the research problem, the purpose of the research, the limitation of the topic and the audience. The structure of the thesis is also included.
1.1 Background
According to Linfo (2006), internationalization is the process of designing a product (i.e., a good or a service) so that it can be localized without major engineering changes while, it is different from localization in which to localize the product is to adapt the product to a specific country, region, language, dialect, culture, etc. Due to numerous differences that exist among countries, regions and cultures, internationalization and localization are important when marketers want to launch the product into a market (Linfo, 2006). Several distinctions in each country are respected to languages, weights and measures, currency, date and time formats, names and titles, citizen identification numbering systems, telephone numbers, addresses and postal codes, religious, cultural and political sensitivities, profanity and legal systems.
Nielson Thailand (n.d.) states that most retailers will be challenged to attract consumers to their stores, persuade them to spend money once inside and achieve this with the most efficient retail operations in the foreseeable future. According to Coleman (n.d.), retailers of fast-moving consumer goods face more pressure in order to compete and succeed in a competitive market. Moreover, to understand the impact of an optimized price strategy and a powerful option that the strategy can deliver in order to empower retailers to achieve new levels of business success (Coleman, n.d.). Therefore, retailers have to be more cautious with their pricing in order to survive and thrive in the highly competitive retail world. In consumers’ perspective, consumers demand fair prices in exchange for their business and they are constantly comparison shopping (Coleman, n.d.). Bolton and Shankar (2003) discover that retailers made pricing decisions for each brand-store combination based on a complex set of factors such as market, chain, store (size, category assortment), category (storability, necessity), brand (preference, advertising), customer (price sensitivity) and competitor characteristics. Specifically, retailer pricing decisions at the brand-store level are heavily influenced by the relative price level and deal frequency of brands in the same category at competing stores, for example, retailers are less price consistent, offer
2
aggressive promotions, more actively coordinate price-promotion and charge lower prices when their competitors offer deals more frequently (Bolton and Shankar, 2003).
Nowadays, consumers encounter with odd pricing when they are presented with prices of consumer goods at retail stores, therefore, odd-pricing could be considered as the most common pricing strategy used by retailers all consumers would be familiar with (Helium, 2010). Odd pricing is also known as psychological pricing which is the practice of ending a price in .99 or sometimes .95. The most obvious reason why retailers use the .99 strategy is to play a psychological game with consumers as when consumers see the price as 9.99, they may round it up in their head, but it doesn't look as expensive as 10.00 does (Helium, 2010).
1.2 Problem Statement
There is slow growth of retailing in Thailand as consumers continue to limit their spending due to political and economic uncertainties (Euromonitor International, 2009). As consumers preferred to shop for all their needs in one place to save travelling time and expense, retailers tend to expand company portfolios by partnership with other grocery and non-grocery retailers in order to be competitive in the market as well as to offer the widest possible range of products and services and to attract the maximum number of shoppers to their stores (Euromonitor International, 2009). OfficeWire (2010) states that retailing in Sweden also grew at a significantly slower current value rate due to the rising rate of unemployment and food price increases. Therefore, it results in decreasing of consumers’ disposable income that encourage consumers to shift to more affordable products and they also postponed the purchase of perceived non-essential products, especially bigger investment items such as large domestic electrical appliances or furniture (OfficialWire, 2010). As a result of economic influences, effective pricing strategy tends to be the most important factor for retailers to attract consumers to make more purchase when shopping in their stores. Many retailers often advertise the price of their products by using numbers below round numbers such as 99 instead of 100. The study from Dr. Schindler showed that consumers usually feel that items with prices using 9 are the items that are on sale (Schindler, 2006). On the other hand, the study from Dr. Thomas mentioned that the use of price ending does not appear in every country. He stated that people in Asian countries would be less likely to see or feel the difference in numbers (Thomas, 2005). Hence, it leads us to our research question that “Do the
3
1.3 Purpose
The purpose of this thesis is to evaluate the differences between 9-ending on promotion prices used by Thai retailers and Swedish retailers.
1.4 Limitation
Due to lack of time, the authors are unable to collect relevant information (e.g. flyers, and brochures from websites) from all retailers both in Thailand and Sweden as there are various retailing brands in both markets. Therefore, the authors have to focus on major retailers while conducting the research. Especially for the retailers in Sweden, the authors have to choose the retailers and their chains that operate in the town where the authors conduct the research due to logistics and time constraints. Moreover, there are various prices that the retailers use on their products, therefore, the authors have to choose to collect only promotion prices which are mostly advertised through retailers’ brochures due to limitation of collecting time. Furthermore, the variety of products provided by the retailers is another concern. Therefore, the authors have to choose some of the products and group them in each specific category.
1.5 Audience
Our target audience is retailers in Thailand and Sweden. Also, this research can be used for further studies on retail pricing strategy for marketing students.
4
1.6 Thesis Structure
Here, the thesis structure is being presented including, a brief introduction of each chapter. The thesis is divided into 7 chapters as follows:
Chapter 1: Introduction chapter presents the background, the problem, the purposes, the limitation of
the research and the target audience.
Chapter 2: Theoretical framework chapter includes the theories related to pricing strategies such as
psychological pricing, odd-even pricing and 9-ending prices, including left and right digit of prices and the cognitive effect of price ending.
Chapter 3: Conceptual framework chapter presents developed framework by the authors based on
theories in chapter 2.
Chapter 4: Method chapter explains how and why the research is done in the way it is presented. It
consists of choices of research approach, choices of data collection, collection of data in the research and analyzing tool of the research. The validity and reliability of the research are also included.
Chapter 5: Empirical material chapter presents the results from the collection of primary data.
Chapter 6: Analysis chapter presents the discussion and analysis of differences of price endings
between both countries related to product categories, product sub-categories and retailers.
Chapter 7: Conclusion chapter presents the discussion on the answer to the research question, the
reflection of the research, the contribution of the research is provided and recommendation on further research.
5
2. Theoretical Framework
In this chapter, theories related to the main research are presented which consist of several pricing strategies such as psychological pricing, odd-even pricing and 9-ending prices. Moreover, the left and right digit of prices and the cognitive effect of price ending are described.
2.1 Psychological Pricing
Kotler, Armstrong, Wong and Saunders (2008) states that psychological pricing is reference prices that consumers would have in their minds and would refer to when considering buying a given product. The reference price can be formed by noting current prices, remembering past prices or assessing the buying situations which the retailers can influence or use these consumers’ reference prices when setting price (Kotler, Armstrong, Wong & Saunders, 2008). According to Pride, Hughes and Kapoor (2010, p.388), “psychological pricing strategies encourages purchases based on emotional responses rather than on economically rational responses. These strategies are used primarily for consumer products rather than business products.”
2.2 Odd-Even Pricing
Regarding to Lamb, Hair and McDaniel (2008, p.581), “odd-even pricing (or psychological pricing) means pricing at odd-numbered prices to connote a bargain and pricing at even-numbered prices to imply quality.” Odd-number pricing is the strategy when prices are set using odd numbers that are slightly below whole-dollar amounts and the most popular ending figures for odd-number prices are nine and five. The retailers who use this pricing strategy believe that consumers would respond more positively to odd-number prices such as $99.95 than to whole-dollar prices such as $100 (Pride, Hughes & Kapoor, 2010).
While psychological, and particularly odd, pricing is mostly used in retailing with regard to consumer product, even pricing tends to be used where connotations of quality are important in determining product and brand choice (Lancaster and Withey, 2006). Even-numbered pricing is sometimes used to denote quality, for example, a fine perfume at $100 a bottle, a good watch at $500, or a mink coat at $3,000 (Lamb, Hair & McDaniel, 2008). Pride and Ferrell (2010) states that a product with even prices is often perceived as having an exclusive or upscale image, therefore, an even price supposedly will
6
influence a customer to view the product as being a high quality and premium brand. For example, a shirt maker may print on a premium shirt package suggested retail price for $42.00 instead of $41.95; in this case, the even price of the shirt is used to enhance its upscale image (Pride and Ferrell, 2010).
2.3 The 9-Ending Prices
The price digit can be divided into two categories, which are the leftmost digit and the digits to the right of the leftmost digit, or ending digits. In this thesis, the presence of including one or more 9’s in the leftmost ending digit of a price will be referred to the 9-ending pricing. According to Whalen (1980, p. 54-55), “A variety of mechanisms, including such fanciful ideas as the possibility that 99-ending prices attract attention because they are perceived by consumers as eyes looking at them”, therefore, it indicates that the use of 9’s in a price ending serves as a signal or communicates an image, such as that the product in low-priced or on sale. According to Schindler and Kirby (1997), retail prices appearing in newspaper advertisements with 9-ending prices were more likely to be used by retail managers when the 0-ending price one cent (or one dollar) higher would have changed the price’s leftmost digit than when the one-cent increase would not have changed the price’s leftmost digit. Moreover, there is evidence indicated that “9-ending prices are at least 24% (and as much as 73%) less likely to change in comparison to prices ending with other digits” (Levy, Lee, Chen, Robert & Bergen, 2007). They also find that the average size of change of ending prices are systematically larger, in comparison to non 9-ending prices.
2.3.1 Left Digit
Considering left digit of prices (e.g., $5.99 and 20.00), it is the numbers that come before the .99 (Lamb, Hair & McDaniel, 2008). Lamb, Hair & McDaniel (2008) also state that the left digit can determine whether consumers perceive a penny reduction as a bargain. “Left-digit effect” is considered when changing the left digits to a lower number (20 to 19) rather than the right digits (.60 to .59) that would affect the consumers’ perception of the price (Lamb, Hair & McDaniel, 2008). Moreover, the left-digit effect also refers to the observation that using a nine ending versus a zero ending, for example, $59.99 versus $60.00, changes the leftmost digit (i.e., the dollar digit changes from three to two) and that it is this change in the left digit, rather than the one cent drop (Thomas and Morwitz, 2005). According to Rao (2009), the use of a 9-ending price can effect judgments of the magnitude of the differences
7
between two prices when using of such an ending leads to a change in the left-most digit (e.g. $3.00 versus $2.99), but has no effect on the perceived magnitude when the left-most digit remains unchanged (e.g. $3.50 versus $3.49).
2.3.2 Right Digit
Right digit of prices can be referred to the numbers that come after the left digit, for example, $3.60 and 19.59; the right digits are .60 and .59 (Lamb, Hair & McDaniel, 2008). Coulter (2007) states that "right-digit effect" influences consumer perception of sale prices. It occurred when the right digits are small then, consumers perceive the discount to be larger than when the right digits are large.For example, an item on sale for $211 from the original price of $222 is thought to be a better deal than an item on sale for $188 from an original price of $199, even though both discounts are $11 (Coulter, 2007). There is also single rightmost digits (e.g., the 5 in $6.95) (Paliwoda and Ryans, 2008). Clark, Brock & Stewart (1994) states that the rightmost digits can be considered as common practice in using as an advertised price so that the price falls just below a round number (e.g. $49.99, $5.98, $1.89). Regarding to a number of studies of the common observation about certain digits that are more likely than others to appear as the rightmost digit, or “ending,” of an advertised price, in particular, the digits 0, 5, and 9 have been found to occur as the rightmost digit of price much more often that chance would predict (Schindler and Kirby, 1997).
2.4 Cognitive Effect of Price Endings
Suri, Anderson and Kotlov (2003) states that there are certain numbers that people encounter more frequently in their everyday activities and use more often than others. Therefore, it is important to understand which numbers are more accessible than others because if certain cognitive representations come to mind more easily, then such representations are more likely to influence evaluations. By setting prices at numbers that have relatively high cognitive accessibility, the price setter communicates with consumers in terms of how consumers think.As a result, prices are more easily perceived, remembered, and compared (Suri, Anderson & Kotlov, 2003). When looking through prices, consumers would read those prices from left-to-right when examining multi-digit regular and sale prices in an advertisement. In the price comparison process, if the left (hundreds) digits are identical, consumers will pay less attention to those digits and focus primarily upon the disparate right-most (tens and units) digits. Although it is a
8
belief that the “.99” part of a price would make the difference in purchasing behavior, there is new research finding that the numbers that come before the .99 or the left digits would determine whether consumers perceive a penny reduction as a bargain (Lamb, Hair & McDaniel, 2008).
9
3. Conceptual Framework
In this chapter, the authors develop the conceptual framework regarding to the theories mentioned earlier. As shown in Figure 1, the main concept of this research is to study the 9-ending on promotion prices, which can be determined as odd pricing or psychological pricing. Although the collection of data will be focusing on 9-ending prices, even prices is also being considered in this research. Moreover, both left and right digit of prices is being collected in order to examine the pattern of prices setting. As a result, the research will compare the 9-ending on promotion prices set by retailers in Thailand and Sweden in order to evaluate the differences of price endings on each product category.
10
4. Method
This chapter presents the tools of collecting data that authors use to conduct the research. Firstly, the methodological approach will be described and then, the chosen method will be discussed in details.
4.1 Choices of Research Approach
4.1.1 Qualitative ResearchAccording to Newman and Benz (1998, p.16), “qualitative research is multi-method in focus, involving an interpretive, naturalistic approach to its subject matter.” This research approach involves the collection of various empirical materials such as case study, personal experience, introspective, life story, interview, observational, historical, interactions and visual texts in which it describes routine and problematic moments and meanings in individuals’ lives. Moreover, qualitative research is concerned with qualitative phenomenon that relates to or involves quality or kind. There are two types of research as follows:
Motivation Research is being conducted when the researchers are investigating the reasons for human behavior such as why people think or do certain things. It aims to discover the motives and desires by using in depth interviews for the purpose. Other techniques of such research include word association tests, sentence completion tests, and story completion tests (Kothari, 1990).
Attitude or opinion research is designed to explore how people feel of what they think about particular subject or institution (Kothari, 1990).
4.1.2 Quantitative Research
According to Kothari (1990, p.3), “quantitative research is based on the measurement of quantity or amount. It is applicable to phenomena that can be expressed in terms of quantity.” A quantitative approach uses strategies of inquiry such as experiments and surveys, and collects data on predetermined instruments that yield statistical data (Creswell, 2003). In doing so, quantitative researchers would be looking for explanations and predictions that will generalize to other persons and places. Their role is to
11
observe and measure. Moreover, they have to be aware of contaminating the data through personal involvement with the research subjects (Murray, 2003).
Regarding the research question, the authors aim to use quantitative approach to collect the data on retail price. As there is variety of prices among selected products, this method will help the authors in measuring the amount of price endings on those selected products from retailers in Thailand and Sweden.
4.2 Choices of Data Collection
4.2.1 Secondary dataWhen collecting data, the researchers usually start by gathering secondary data because it can be obtained more easily, quickly and at a lower cost than primary data (Kotler, Armstrong, Wong & Saunders, 2008). Secondary data can be used as possibility of reanalyzing data that have already been collected for some other purpose. It includes both raw material and published summaries which could be both quantitative and qualitative data (Thornhill, Lewis & Saunders, 2007). The collection of data from books (i.e. textbooks and academic monographs) and journals (i.e. academic journals) will be our main sources. According to Fisher (2007), textbooks are helping the authors in orientating in a field of literature and they can be used as a source of references while journals are the most up-to-date research and debates will be found in journals which are more applicable to use as main source of a research dissertation.
The authors collect data from marketing textbooks on related theories used for developing the conceptual framework for this research. In addition, marketing journals are helpful in generating ideas from previous researches on pricing.
4.2.2 Primary data
Ghauri and Gronhaug (2005) states that primary data are considered useful when secondary data are not available or cannot be used to answer the research questions. The primary data will be collected depending on the research problem and design. In this case, it is quantitative method. There are several choices of collecting primary data including observations, experiments, surveys (questionnaires) and
12
interviews. The advantage of primary data is that they are more compatible with the research questions and objectives (Ghauri and Gronhaug, 2005).
The authors choose direct observation as a method of collecting data for this research. In doing so, the authors will collect brochures from selected retailers both in Thailand and Sweden.
4.3 Collection of Data in the Research
With regard to the chosen method on quantitative approach of direct observation, the method is described in details as followed;
4.3.1 Sources of Data 4.3.1.1 Brochure
The collected brochures come from two sources. For retailers in Thailand, the authors collect brochures via their websites which are;
Tesco-Lotus: http://tescolotus.com/promotion.php?lang=en Big-C: http://www.bigc.co.th/en/promotions/ebrochure/
Carrefour: http://www.carrefour.co.th/eng/promotion/MonthlyBrochure.aspx
For retailers in Sweden, the authors visit each selected store and collect the brochures that usually are placed at the store entrance. Moreover, the brochures can be obtained via mail.
4.3.1.2 Promotion Price
As mentioned earlier in the limitation part, promotion prices usually appear in the brochures which are the main source that the authors choose to collect the data. An example of collected prices is shown in Figure 2 below;
13
Figure 2: Collected Price from the Brochure (Big C, 2010)
According to Figure 2, the authors choose to collect the promotion price in a big red numbers with background because a price is being advertised as lower price than an original price; a small red numbers with green background.
4.3.1.3 Price Endings
According to the collected promotion prices from the brochures, price ending digits in Thai Baht and Swedish Kronor can be divided into two parts which are left digits and right digits as shown on Table 1. Left digits include the numbers before decimal point and right digits consist of the numbers after decimal point.
14
Table 1: Left Digits and Right Digits
The first collection of promotion price endings is the left digits. The authors had collected two digits from the leftmost digit and the last digit of left digits. Two digits from the leftmost digit are the last two numbers before the decimal point while, the last digit of left digits is the last number before the decimal point. Examples of collected price endings in Thai Baht and Swedish Kronor are shown on Table 2.
Table 2: Two Digits from the Leftmost Digit and the Last Ending Digit of Left Digits
The second collection of promotion price endings is the right digits and the last digit of right digits or the rightmost digit. The right digits are the two numbers after the decimal point while, the rightmost digit is the last number of the ending. Examples of collected price endings in Thai Baht and Swedish Kronor are shown on Table 3.
Table 3: Right Digits and the Rightmost Digit
Left Digits Right Digits
฿
579.00SEK69.99
฿
49.50SEK14.99
Two Digits from the Leftmost Digit
Last Digit of Left Digits
฿
579.00SEK69.99
฿
579.00SEK69.99
Right Digits Rightmost Digit
฿
49.50SEK14.99
฿
49.5015
4.3.2 Period of Collection
The authors collect brochures from all selected retailers during April 1, 2010 to May 15, 2010. During this period of time, the authors were able to gather various pricing ranges on promotion prices of each product category as the retailers would launch different pricing promotion and campaign via their weekly and monthly brochures.
4.3.3 Retailers
The authors choose three retail outlets each in Thailand and in Sweden. Thai retailers are Tesco-Lotus, Big-C and Carrefour. They are the top three hypermarket brands in Thailand according to a publication by Price Waterhouse Cooper (2006). And Swedish retailers are Coop (Extra, Konsum, Forum and Bygg), ICA (Maxi and Supermarket) and LIDL. As mentioned earlier in the limitation part, the authors choose these three retailers and their chains because they are operating in Västerås where the authors conduct the research. A brief overview of each retailer will follow.
4.3.3.1 Thai Retailers Tesco-Lotus
Tesco-Lotus Hypermarket is the biggest store of Tesco-Lotus. Tesco Lotus currently has 48 hypermarkets, 9 Express stores, 8 Value stores and a supermarket (Price Waterhouse Cooper, 2006). It serves every need of customers with products variety up to 36,000 items covering every department such as consumer products, fresh foods, hardware and electrical appliances. Tesco-Lotus is claimed to be the leader of "sell for less" that always presents promotion discount products at Tesco-Lotus Hypermarket. Customers can check the products, price and promotion from various media such as flyers at the customer service counter, Tesco-Lotus website, press ads in newspaper, posters or the sign boards in the store and promotion labels on the shelves (Tesco-Lotus, 2009).
Big-C
Big-C operates business in the form of "Hypermarket" or "Supercenter" as a modern retail business which is managed under the umbrella of Big-C Supercenter Public Company Limited and its subsidiaries. At present, Big-C has total 68 branches - 26 branches in Bangkok and the vicinity, 42 branches in the provinces. At all Big-C stores, the majority of the space is devoted to the sale of
16
consumer goods and foodstuffs at reasonable prices and of excellent quality. Products available in a Big-C store can be divided into 5 main categories which are fresh food, dry food, clothing and accessories, electrical appliances and home décor and accessories (Big-C, 2010).
Carrefour
Carrefour emphasizes on price as one of its key elements of the brand strategy, together with a constant pursuit of improvement in ranges and services. Carrefour has 30 stores nationwide and more than 7,000 employees in Thailand; 23 Carrefour stores are located in Bangkok areas and 7 in upcountry. Carrefour hypermarkets operates under the concept of everything-under-one-roof which offers its customers a range of between 20,000 and 80,000 food and non-food items at extremely attractive prices. Carrefour hypermarkets combine choice, quality, innovation and modernity with the best prices around and a pleasurable buying experience (Carrefour, 2008).
4.3.3.2 Swedish Retailers Coop
Coop is the name of the KF Group's grocery retail group. It runs grocery retail trade in chains which accounts for 21.4% of the grocery retail market in Sweden. There are five chains under Coop’s operation including Coop Forum, Coop Extra, Coop Konsum, Coop Nära and Coop Bygg (Coop, 2010). In this research, the authors choose only four chains that are operated in Västerås which are;
Coop Forum: there are 42 hypermarkets that offer a broad range of goods, with emphasis on foods, can often be found next to biggest commercial centers. Customers can find everything under one roof of Coop Forum (Coop, 2010).
Coop Extra: it aims to be the best food store in each location with 36 stores available. Customers can find it easily and walk straightforward to the shop with full product ranges at great prices (Coop, 2010).
Coop Konsum: there are 169 stores of Coop Konsum. It offers inspiration for food and recipes which bear the Keyhole label and lists of nutrients. Coop Konsum runs business under the concept of value-for-money goods, top quality fresh goods and also Sweden's broadest range of organic options (Coop, 2010).
17
Coop Bygg: there are 32 stores that offer a broad range of do-it-yourself and gardening goods. Also, the stores are well stocked and offer low prices (Coop, 2010).
ICA
ICA Group is one of the Northern Europe’s leading retail companies, with around 2,220 of its own and retailer-owned stores in Sweden, Norway and the Baltic countries. There are 1,359 ICA stores in Sweden with four chains under ICA’s operation including ICA Nära, ICA Supermarket, ICA Kvantum and Maxi ICA Stormarknad (ICA’s Annual Report, 2009). In this research, the authors choose only two chains that operate in Västerås which are;
ICA Supermarket: the store provides wide assortment for everyday meals or special occasions together with high personal service. Moreover, the stores carry a wide range of fresh foods (ICA’s Annual Report, 2009).
ICA Maxi Stormarknad: the stores operate under the concept of everything at good prices under one roof. It provides customers wide variety of foods and nonfoods such as house wares, sporting goods and garden supplies with extended store hours and convenient for drivers (ICA’s Annual Report, 2009).
LiDL
LiDL currently has over 140 stores and total of over 2,300 people working at LiDL Sweden. LiDL have forced prices while operating in Sweden for nearly seven years. LiDL's business concept and the key to success is simplicity as selling products of highest quality at the lowest possible price. By being cost conscious and cost-effective offering customers lower food prices, LiDL is the shop for the savvy customers who want to buy food with high quality at a low price (LiDL, 2010).
4.3.4 Selected Product Category
As mentioned earlier in the limitation part, there is wide variety of product range provided in retail store. Therefore, the authors choose to collect promotion prices on three product categories of consumer goods which are food, personal care products and electrical appliances because these products are mostly advertised in the brochures as shown in Figure 3, 4 and 5, respectively.
18
4.3.4.1 Food Category
Products in food category provided in the retailer can be divided into five groups as following; 1) Fresh food such as egg, meat, fish, vegetables, fruits, dairy products and bakery.
2) Frozen food such as frozen meat, meal box and ice-cream.
3) Dried food such as canned food, seasoning, spread, rice, milk powder and instant coffee. 4) Snacks such as nuts, candy, chocolate and potato chip.
5) Beverages such as pasteurized milk, juice and soft drink.
19
4.3.4.2 Personal Care Products Category
The authors divide personal care products category into five groups which are; 1) Hair care including shampoo, conditioner and color cream.
2) Skin care such as soap, shower cream, body lotion, facial foam, facial cream and deodorant. 3) Mouth care such as toothbrushes, toothpaste and mouth wash.
4) Fabric care which are washing powder and fabric softener.
5) Others including sanitary napkin, razor, shaving cream, cosmetics and toilet paper.
Figure 4: Products in Personal Care Products Category from retailer’s brochure (Tesco Lotus, 2010 and Big C, 2010)
20
4.3.4.3 Electrical Appliances Category
This category can be divided into two groups including;
1) Major appliances such as air conditioner, refrigerator, washing machine, dish washer and stove. 2) Small appliances including microwave oven, blender, rice cooker, coffee maker, electrical fan, vacuum, iron, hair dryer, television and DVD player.
Figure 5: Products in Electrical Appliances Category from Retailer’s Brochure (Big C, 2010 and Carrefour, 2010)
Therefore, each product category contributes differences in price setting by selected retailers both in Thailand and Sweden.
21
4.4 Analyzing Tool
Regarding to the research question, the authors will compare the way the retailers from Thailand and Sweden set their price on three product categories. In doing so, the authors use Microsoft Office Excel as a statistical tool and then key-in all data in order to calculate results between two countries. In this research, the authors choose to calculate the results using rank and percentile function. According to Microsoft Office Online (2010), the Rank and Percentile analysis tool produces a table that contains the ordinal and percentage rank of each value in a data set. Moreover, the authors also use pivot-table as a tool to sort, count, and total the data stored spreadsheet and display the summarized data in Excel (Microsoft Office Online, 2010).
4.5 Validity and Reliability of the Research
4.5.1 Validity
According to Cohen, Manion & Morrison (2000), validity is an important key to effective research and a requirement for both quantitative and qualitative research. In quantitative data, validity can be improved through careful sampling, appropriate instrumentation and appropriates statistical treatments of data while in qualitative data, degree of bias is contributed by the subjectivity of respondents, their opinions, attitudes and perspectives (Cohen, Manion & Morrison, 2000). Therefore, the researchers are striving to minimize invalidity and maximize validity.
In this research, the method of collecting data can be considered as a valid one. The authors had collected the data in order to measure the differences between promotion price endings in two countries, therefore, all data were carefully collected and used in the way it is supposed to measure. Moreover, we chose proper statistical tool which is Microsoft Office Excel. As a result, the software proves to generate good statistical analyses as it can accumulate all collected data and calculate precise outcomes.
4.5.2 Reliability
Reliability in quantitative research is based on the possibility of replication which means that the results should come out the same when using the same method with the same sample while in qualitative research, reliability can be considered as adequate between what researchers record as data and what actually occurs in the natural setting that is being researched (Cohen, Manion & Morrison, 2000).
22 Regarding to our research method, the replication of the research is highly reliable because we use Microsoft Office Excel as statistical tool in order to accumulate data and calculate the outcomes. Therefore, the results should come out the same if the similar method is being used and the similar sample size is being collected.
23
5. Empirical Material
In this chapter, the results of primary data collection are presented which consists of five parts. Every part includes the results from Thailand and Sweden. Part one presents the overview of collected brochures and promotion prices. Part two presents the results of all promotion price endings in two countries. Part three presents the results of promotion price endings of product categories. Part four presents the results of promotion price endings of product sub-categories. Lastly, part five presents promotion price endings by specific retailing brands from two countries.
5.1 Overview of Collected Brochures and Prices
5.1.1 ThailandAs mentioned earlier in this research, we had collected brochures from three retail brands in Thailand which are Tesco-Lotus, Big-C and Carrefour. As shown on Table 4, there are 1,900 prices in total including 1,110 price sets of food category, 450 price sets of personal care products category and 340 price sets of electrical appliances category. Quantity of prices in each product category and retailer are also shown on Table 4.
Product Category/ Retailer Tesco-Lotus Big-C Carrefour Total Percentage
Food 504 313 293 1110 58.4%
Personal Care 170 131 149 450 23.7%
Electrical Appliance 149 85 106 340 17.9%
Total 823 529 548 1900 100.0%
24
Each product category contains sub-categories. Food category divides into five groups as shown on Table 5. Personal care products category also divides into 5 groups, shown on Table 6. And electrical appliances category is divided into 2 groups as shown on Table 7.
Food Category
Subcategory Quantity Percentage
Fresh Food 162 14.6% Frozen Food 23 2.1% Dried Food 443 39.9% Snack 236 21.3% Beverage 246 22.2% Total 1110 100.0%
Table 5: Sub-Category on Food Products
Personal Care
Subcategory Quantity Percentage
Hair Care 53 11.8% Skin Care 177 39.3% Mouth Care 29 6.4% Fabric Care 100 22.2% Others 91 20.2% Total 450 100.0%
Table 6: Sub-category on Personal Care Products
Electrical Appliances
Subcategory Quantity Percentage
Major appliances 84 24.7% Small appliances 256 75.3%
Total 340 100.0%
25
Also, quantity of odd-even price endings are shown in table 8 below.
Product Category/ Odd-Even Price Ending Odd-Ending Even-Ending Total
Food 631 479 1110
Personal Care Products 357 93 450
Electrical Appliances 40 300 340
Grand Total 1028 872 1900
Table 8: Quantity of Odd-Even Price Endings from Thai Retailers
In Thailand, the retailers use the same brochure for every branch they operate. According to the observation, the brochures consist of 30-45 pages and all retailers would introduce their promotion of the month (e.g. buy 2 in lower price and buy 2 get 3) on the front page. They also promote seasonal products on the first 10 pages of the brochure, for example, Big-C had promoted products for school such as student uniform and stationery products on page 1-9 of their late April issue as it was school opening season in Thailand during late April to beginning of May.
After several pages of special products promotion, the brochure is organized into pattern that begins with food category, personal care products category and electrical appliances category, respectively. As food category has the widest range of products, most part of the brochure is dedicated to products in food category, for example, Tesco-Lotus had allocated 15 pages of their 40 pages brochure to advertise prices of food. The next 7-10 pages are dedicated to personal care products and electrical appliances, respectively and other 5-7 pages are dedicated to other products such as clothes, household products and gardening products. The samples of brochure from three retailers are presented below.
26
5.1.2 Sweden
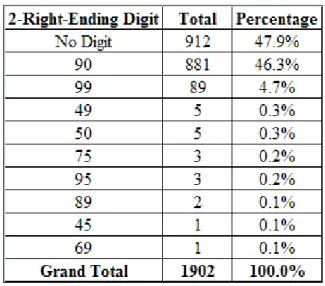
As mentioned earlier in this research, we had collected brochures from three retail brands in Sweden which are Coop (Extra, Konsum, Forum and Bygg), ICA (Maxi and Supermarket) and LiDL. As shown on Table 9, there are 1,902 price sets in total including 1,651 price sets of food category, 158 price sets of personal care products category and 93 price sets of electrical appliances category. Quantity of prices in each product category from each retailer is shown on Table 9.
Product Category/ Retailer Coop ICA LiDL Total Percentage
Food 858 539 254 1651 86.8%
Personal Care 39 90 29 158 8.3%
Electrical Appliance 63 14 16 93 4.9%
Total 960 643 299 1902 100.0%
Table 9: Quantity of Prices from Swedish Retailers
Each product category contains sub-categories. Food category divides into five groups as shown on Table 10. Personal care products category also divides into 5 groups, shown on Table 11. And electric appliances category is divided into 2 groups as shown on Table 12.
Food Category
Subcategory Quantity Percentage
Fresh Food 869 52.6% Frozen Food 209 12.7% Dried Food 308 18.7% Snack 147 8.9% Beverage 118 7.1% Total 1651 100.0%
27
Personal Care
Subcategory Quantity Percentage
Hair Care 38 24.1% Skin Care 53 33.5% Mouth Care 18 11.4% Fabric Care 18 11.4% Others 31 19.6% Total 158 100.0%
Table 11: Sub-category on Personal Care Products
Electrical Appliances
Subcategory Quantity Percentage
Major appliances 17 18.3% Small appliances 76 81.7%
Total 93 100.0%
Table 12: Sub-category on Electrical Appliances
Furthermore, quantity of odd-even price endings is shown in table 13 below.
Product Category/ Odd-Even Price Ending Odd-Ending Even-Ending Total
Food 1,013 638 1651
Personal Care Products 126 32 158
Electrical Appliances 89 4 93
Grand Total 1228 674 1902
28
Unlike in Thailand, retailers in Sweden use different brochures for each chain they operate as some chains are offering only specific types of product.
Firstly, we had chosen four chains of Coop which are Coop Extra, Coop Konsum, Coop Forum and Coop Bygg. Mostly, every page of the brochures from Coop Extra, Coop Konsum and Coop Forum had advertised prices of food products. There are only 1-2 pages dedicated to advertisement of personal care products and other products (e.g. clothes and outdoor products). Coop Bygg which provides electrical appliances, household products and gardening products had shared the same brochure with Coop Forum. As different chains offer different kinds of product, there are different price sets from each chain as shown on Table 14.
Retailer/ Product Category Food Personal Care Electric Appliances Total
Coop Extra 320 12 2 334
Coop Konsum 197 4 0 201
Coop Forum 341 23 17 381
Coop Bygg 0 0 44 44
Grand Total 858 39 63 960
Table 14: Total Price Sets from Coop Chains
Secondly, we had chosen two chains of ICA which are ICA Maxi and ICA Supermarket. Almost every page in the brochure had dedicated to advertisement of prices on food products. Only 2-3 pages had advertised prices on personal care products. Electrical appliances are usually advertised in the same page of household products. As ICA Supermarket provides only food and personal care products, the total price sets between two chains are different as presented on Table 15.
Retailer/ Product Category Food Personal Care Electric Appliances Total
ICA Maxi 345 62 14 421
ICA Supermarket 194 28 0 222
Grand Total 539 90 14 643
Table 15: Total Price Sets from ICA Chains
Lastly, LiDL uses the same brochure for every chain they operate. They allocate pages to advertise each product category equally as each 1-2 pages of the brochures would advertise prices on food, personal
29
care products, electrical appliance, clothes and household products, respectively. Therefore, there are the same price sets of all product categories as shown on Table 16.
Retailer/ Product Category Food Personal Care Electric Appliances Total
Grand LiDL 254 29 16 299
30
5.2 Prices Ending Digits in Two Countries
5.2.1 ThailandThe collection of price endings is divided into two groups which are left ending digits that consist of two and one ending digit. And right ending digits including, two and one ending digit.
5.2.1.1 Left Ending Digits
The group of left ending digits consists of A) two digits from the leftmost digit and B) the last digit of left digits.
A) Two Digits from the Leftmost Digit
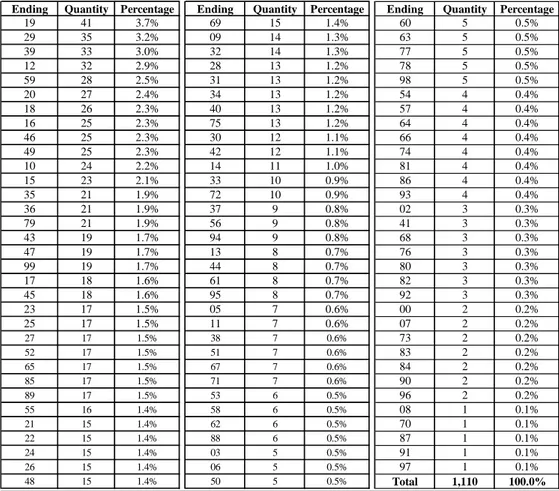
Ending Quantity Percentage Ending Quantity Percentage Ending Quantity Percentage
90 234 12.3% 23 17 0.9% 93 8 0.4% 29 63 3.3% 26 17 0.9% 63 7 0.4% 39 63 3.3% 42 17 0.9% 71 7 0.4% 99 60 3.2% 48 17 0.9% 77 7 0.4% 19 51 2.7% 32 16 0.8% 41 6 0.3% 79 51 2.7% 37 16 0.8% 60 6 0.3% 00 49 2.6% 24 15 0.8% 62 6 0.3% 49 49 2.6% 28 15 0.8% 66 6 0.3% 59 49 2.6% 40 15 0.8% 80 6 0.3% 69 44 2.3% 95 15 0.8% 03 5 0.3% 45 37 1.9% 14 14 0.7% 06 5 0.3% 89 37 1.9% 30 14 0.7% 54 5 0.3% 12 36 1.9% 31 14 0.7% 64 5 0.3% 85 35 1.8% 33 14 0.7% 70 5 0.3% 18 31 1.6% 34 14 0.7% 74 5 0.3% 15 30 1.6% 38 14 0.7% 02 4 0.2% 75 30 1.6% 56 14 0.7% 76 4 0.2% 20 28 1.5% 88 14 0.7% 81 4 0.2% 35 28 1.5% 72 13 0.7% 86 4 0.2% 16 27 1.4% 50 12 0.6% 92 4 0.2% 46 27 1.4% 98 11 0.6% 82 3 0.2% 65 27 1.4% 05 10 0.5% 84 3 0.2% 25 26 1.4% 44 10 0.5% 87 3 0.2% 10 25 1.3% 53 10 0.5% 96 3 0.2% 36 25 1.3% 67 10 0.5% 07 2 0.1% 55 25 1.3% 13 9 0.5% 08 2 0.1% 43 22 1.2% 51 9 0.5% 73 2 0.1% 09 21 1.1% 61 9 0.5% 83 2 0.1% 47 20 1.1% 78 9 0.5% 91 2 0.1% 27 19 1.0% 94 9 0.5% 04 1 0.1% 52 19 1.0% 11 8 0.4% 97 1 0.1% 17 18 0.9% 57 8 0.4% 21 18 0.9% 58 8 0.4% 22 18 0.9% 68 8 0.4% Total 1,900 100.0%
31
B) The Last Digit of Left Digits
Table 18: The Last Price Ending Digit of Left Digits in Thailand
5.2.1.2 Right Ending Digits
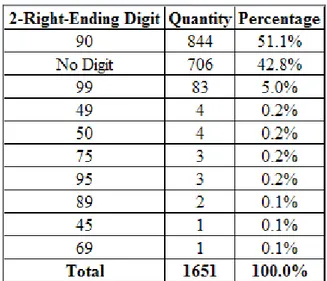
The group of right ending digits consists of C) right digits and D) rightmost digit.
C) Right Digits
Table 19: Right Price Ending Digits in Thailand
D) Rightmost Digit
32
5.2.2 Sweden
The collection of price endings is divided into two groups which are left ending digits that consists of two and one ending digit. And right ending digits including, two and one ending digit.
5.2.2.1 Left Ending Digits
The group of left ending digits consists of A) two digits from the leftmost digit and B) the last digit of left digits.
A) Two Digits from the Leftmost Digit
Ending Quantity Percentage Ending Quantity Percentage Ending Quantity Percentage
19 161 8.5% 20 30 1.6% 54 5 0.3% 29 134 7.0% 34 29 1.5% 23 4 0.2% 39 126 6.6% 45 29 1.5% 31 4 0.2% 49 105 5.5% 89 26 1.4% 90 4 0.2% 14 94 4.9% 21 25 1.3% 37 3 0.2% 24 88 4.6% 55 25 1.3% 47 3 0.2% 99 85 4.5% 40 21 1.1% 85 3 0.2% 35 70 3.7% 13 20 1.1% 09 2 0.1% 59 69 3.6% 26 17 0.9% 41 2 0.1% 25 63 3.3% 11 16 0.8% 48 2 0.1% 16 59 3.1% 28 15 0.8% 52 2 0.1% 15 51 2.7% 44 15 0.8% 75 2 0.1% 95 49 2.6% 42 13 0.7% 06 1 0.1% 17 49 2.6% 27 11 0.6% 07 1 0.1% 12 46 2.4% 36 11 0.6% 46 1 0.1% 30 43 2.3% 38 9 0.5% 51 1 0.1% 10 40 2.1% 33 7 0.4% 60 1 0.1% 69 39 2.1% 64 6 0.3% 67 1 0.1% 79 39 2.1% 65 6 0.3% 74 1 0.1% 18 37 1.9% 98 6 0.3% 84 1 0.1% 22 32 1.7% 00 5 0.3% 32 32 1.7% 50 5 0.3% Total 1,902 100.0%
33
B) The Last Digit of Left Digits
Table 22: The Last Price Ending Digit of Left Digits in Sweden
5.2.2.2 Right Ending Digits
The group of right ending digits consists of C) right digits and D) rightmost digit.
C) Right Digits
34
D) Rightmost Digit
Table 24: Rightmost Price Ending Digit in Sweden
5.3 Prices Ending Digits of Product Categories
5.3.1 ThailandThe collection of price endings is divided into two groups which are left ending digits and right ending digits. In each group, it consists of three product categories which are food, personal care products and electric appliances.
5.3.1.1 Left Ending Digits
The group of left ending digits consists of A) two digits from the leftmost digit and B) the last digit of left digits. The results will be arranged in order by food (A and B), personal care products (A and B) and electrical appliances (A and B).
35
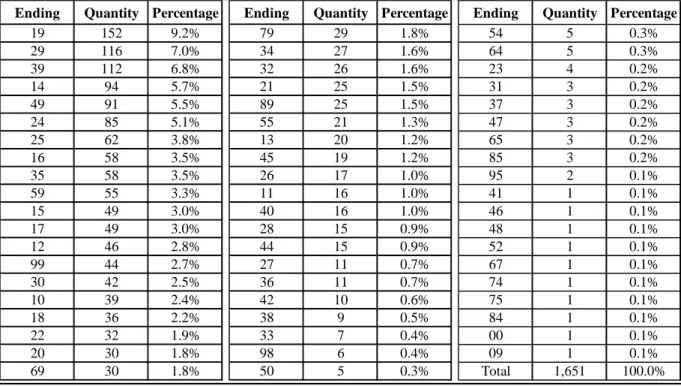
Food Category: A) Two Digits from the Leftmost Digit
Ending Quantity Percentage Ending Quantity Percentage Ending Quantity Percentage
19 41 3.7% 69 15 1.4% 60 5 0.5% 29 35 3.2% 09 14 1.3% 63 5 0.5% 39 33 3.0% 32 14 1.3% 77 5 0.5% 12 32 2.9% 28 13 1.2% 78 5 0.5% 59 28 2.5% 31 13 1.2% 98 5 0.5% 20 27 2.4% 34 13 1.2% 54 4 0.4% 18 26 2.3% 40 13 1.2% 57 4 0.4% 16 25 2.3% 75 13 1.2% 64 4 0.4% 46 25 2.3% 30 12 1.1% 66 4 0.4% 49 25 2.3% 42 12 1.1% 74 4 0.4% 10 24 2.2% 14 11 1.0% 81 4 0.4% 15 23 2.1% 33 10 0.9% 86 4 0.4% 35 21 1.9% 72 10 0.9% 93 4 0.4% 36 21 1.9% 37 9 0.8% 02 3 0.3% 79 21 1.9% 56 9 0.8% 41 3 0.3% 43 19 1.7% 94 9 0.8% 68 3 0.3% 47 19 1.7% 13 8 0.7% 76 3 0.3% 99 19 1.7% 44 8 0.7% 80 3 0.3% 17 18 1.6% 61 8 0.7% 82 3 0.3% 45 18 1.6% 95 8 0.7% 92 3 0.3% 23 17 1.5% 05 7 0.6% 00 2 0.2% 25 17 1.5% 11 7 0.6% 07 2 0.2% 27 17 1.5% 38 7 0.6% 73 2 0.2% 52 17 1.5% 51 7 0.6% 83 2 0.2% 65 17 1.5% 67 7 0.6% 84 2 0.2% 85 17 1.5% 71 7 0.6% 90 2 0.2% 89 17 1.5% 53 6 0.5% 96 2 0.2% 55 16 1.4% 58 6 0.5% 08 1 0.1% 21 15 1.4% 62 6 0.5% 70 1 0.1% 22 15 1.4% 88 6 0.5% 87 1 0.1% 24 15 1.4% 03 5 0.5% 91 1 0.1% 26 15 1.4% 06 5 0.5% 97 1 0.1% 48 15 1.4% 50 5 0.5% Total 1,110 100.0%
36
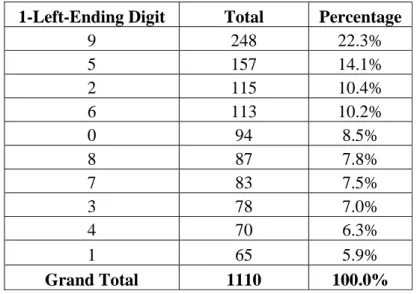
Food Category: B) The Last Digit of Left Digits
1-Left-Ending Digit Total Percentage
9 248 22.3% 5 157 14.1% 2 115 10.4% 6 113 10.2% 0 94 8.5% 8 87 7.8% 7 83 7.5% 3 78 7.0% 4 70 6.3% 1 65 5.9% Grand Total 1110 100.0%
37
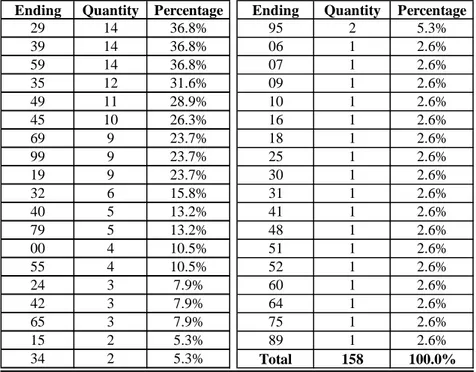
Personal Care Products Category: A) Two Digits from the Leftmost Digit
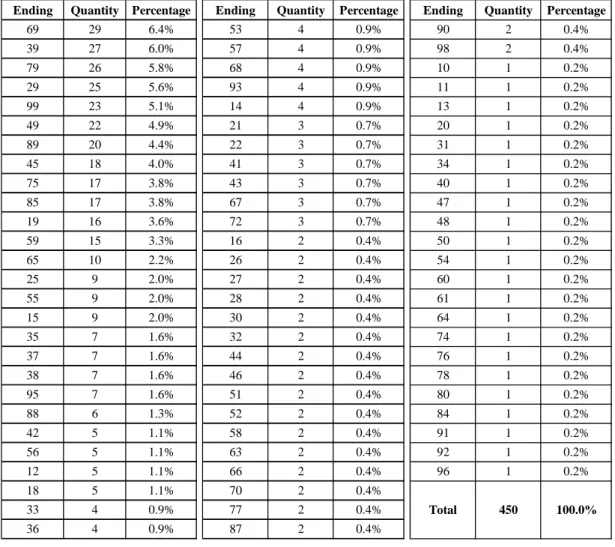
Ending Quantity Percentage Ending Quantity Percentage Ending Quantity Percentage
69 29 6.4% 53 4 0.9% 90 2 0.4% 39 27 6.0% 57 4 0.9% 98 2 0.4% 79 26 5.8% 68 4 0.9% 10 1 0.2% 29 25 5.6% 93 4 0.9% 11 1 0.2% 99 23 5.1% 14 4 0.9% 13 1 0.2% 49 22 4.9% 21 3 0.7% 20 1 0.2% 89 20 4.4% 22 3 0.7% 31 1 0.2% 45 18 4.0% 41 3 0.7% 34 1 0.2% 75 17 3.8% 43 3 0.7% 40 1 0.2% 85 17 3.8% 67 3 0.7% 47 1 0.2% 19 16 3.6% 72 3 0.7% 48 1 0.2% 59 15 3.3% 16 2 0.4% 50 1 0.2% 65 10 2.2% 26 2 0.4% 54 1 0.2% 25 9 2.0% 27 2 0.4% 60 1 0.2% 55 9 2.0% 28 2 0.4% 61 1 0.2% 15 9 2.0% 30 2 0.4% 64 1 0.2% 35 7 1.6% 32 2 0.4% 74 1 0.2% 37 7 1.6% 44 2 0.4% 76 1 0.2% 38 7 1.6% 46 2 0.4% 78 1 0.2% 95 7 1.6% 51 2 0.4% 80 1 0.2% 88 6 1.3% 52 2 0.4% 84 1 0.2% 42 5 1.1% 58 2 0.4% 91 1 0.2% 56 5 1.1% 63 2 0.4% 92 1 0.2% 12 5 1.1% 66 2 0.4% 96 1 0.2% 18 5 1.1% 70 2 0.4% 33 4 0.9% 77 2 0.4% 36 4 0.9% 87 2 0.4% Total 450 100.0% Table 27: Two Price Ending Digits from the Leftmost Digit of
38
Personal Care Products Category: B) The Last Digit of the Left Digits
Table 28: The Last Price Ending Digit of Left Digits of Personal Care Products Category in Thailand
39
Electrical Appliances Category: A) Two Digits from the Leftmost Digit
Table 29: Two Price Ending Digits from the Leftmost Digit of Electrical Appliances Category in Thailand
Electrical Appliances Category: B) The Last Digit of the Left Digits
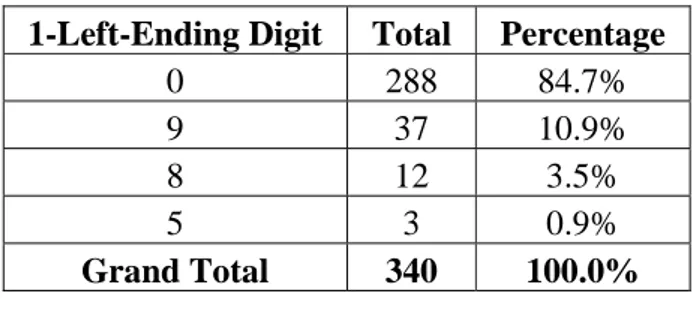
1-Left-Ending Digit Total Percentage
0 288 84.7%
9 37 10.9%
8 12 3.5%
5 3 0.9%
Grand Total 340 100.0%
Table 30: The Last Price Ending Digit of Left Digits of Electrical Appliances Category in Thailand
40
5.3.1.2 Right Ending Digits
The group of right ending digits consists of C) right digits and D) rightmost digit. The results will be arranged in order as food (C and D), personal care products (C and D) and electrical appliances (C and D).
Food Category: C) Right Digits
Table 31: Right Price Ending Digits of Food Category in Thailand
Food Category: D) Rightmost Digit
Table 32: Rightmost Price Ending Digit of Food Category in Thailand
Personal Care Products Category: C) Right Digits