Text Placement in SNS for
Effective Communication
A qualitative study investigating the
most favourable text placement on
media sharing SNS advertisements to best communicate information
through text
MAIN FIELD: Informatics
AUTHOR: Madeleine Ericsson and Evelina Tertelytė SUPERVISOR: Ida Serneberg
SCOPE: 15 HP
Table of Contents
1 Introduction 3
1.1 Background 3
1.2 The Need for Suitable Text Placement 4 1.3 Purpose and Research Questions 5
1.4 Scope and Delimitations 7
1.5 Disposition 7
2 Method and Implementation 8
2.1 Link Between Research Questions and Methods 8
2.2 Approach 9 2.3 Work Process 9 2.4 Design 13 2.5 Data Collection 15 2.6 Data Analysis 15 2.7 Problem Protocol 21
2.8 Validity and Reliability 23
3 Theoretical Framework 25
3.1 Link Between Research Questions and Theory 25 3.2 “F” Pattern Scanning of text and Images in Web Pages 26
3.3 Signal-To-Noise ratio 27
3.4 Attraction of Visual Attention 28
3.5 Information Systems 28
3.6 Human Gaze Control During Real-World Scene Perception 29
4 Empirical Data 30
4.1 Eye Tracker Data 32
4.2 Survey Data 34 5 Analysis 36 5.1 Eye Tracking 36 5.2 Survey 38 5.3 General Outcomes 39 5.4 Research Question 1 40 5.5 Research Question 2 40
6 Discussion and Conclusion 41
6.1 Findings 41
6.2 Implications 41
6.3 Limitations 42
6.4 Conclusions and Recommendations 43
6.5 Further Research 43
Appendix 45
Abstract
The aim of this thesis is to conduct a qualitative study investigating the most favourable text placement on social networking sites (SNS) to best communicate information through text. To discover a suitable placement for text, we utilize conscious and unconscious visual gaze points from participants. To discover the visual gravity of participants, the research methods of eye tracking and survey are used. The eye tracking supplies unpretentious and real-time behavioral insight as gaze points. Whereas the survey supplies subjective conscious visual gravity data. Previous research suggests that users are drawn to elements containing text. Furthermore, another theory describes users seeking task-relevant information, a goal is to uncover where is the best placement to aid users seeking task-relevant information. The conclusion of this thesis uncovered that users are drawn to text elements unconsciously, but conscious visual gravity could be based on image exposure. Furthermore, the most favourable placement for text is centered along a vertical axis on a 1:1 image and slightly higher than the horizontal axis line.
Keywords: SNS, Text Placement, Media Sharing SNS, Layout, Advertising, Information System, Communication
Sammanfattning
Målet för studien är att genomföra en kvalitativ undersökning av den mest
fördelaktiga text placeringen för att bäst överföra information på sociala medier via text. För att upptäcka en passande plats för text så undersöker vi medveten och undermedveten blick placering från våra studiedeltagare. För att undersöka dragkraften av bildelement så används “eye tracking” och en enkät som
forskningsmetoder. Eye tracking bidrar med anspråkslös data i realtid om beteenden i användarnas blick placering. Medans enkäten bidrar med subjektiv och medveten data om bild elementens dragkraft. Föregående forskning visar att användare dras mer till element som innehåller text. Vidare så beskriver en annan studie att
användare letar efter information som är relevant till uppgiften. Ett av studiens mål är att avslöja den optimala placeringen för att underlätta för användare så de kan hitta information som är relevant till uppgiften. Vår studie visade att användare är dragna till textelement omedvetet, men också att medveten blick placering kan ske om deltagaren utsatts för bilden innan. Resultatet visar också att text som är centralt placerad på den vertikala axeln samt lite över den horisontella axeln på en 1:1 bild ger mest fördel.
Nyckelord: SNS, Text placering, Media sharing SNS, Layout, Annonsering, Informationssystem, Kommunikation.
1
Introduction
1.1
Background
Informatics can be defined as “[The study of] structure, behaviour, and interactions of natural and artificial systems that store, process, and communicate information.” as described by Cambridge University [20]. Additionally, informatics studies
representation, processing and communication of information as defined by the University of Edinburgh [17]. It is often referred to as the design of information systems [18]. During this thesis, we will put emphasis on the structure of
communicating information, specifically, information placement through text. The following thesis makes contributions in informatics within the field of SNS-design. This thesis will focus on optimizing information systems of media sharing social networking sites (SNS) [9] by investigating the layout of advertisements - such as Instagram. SNS can be defined in three levels [Figure 1.0]. The top tier being SNS which encompasses everything such as MSN, Email, Instagram, Flickr. The second tier is media sharing SNS, a media sharing site enables users to share different forms of media such as video, imagery and audio. Some media sharing SNS sites include: YouTube, Pinterest and Facebook. The third tier being application level, which would be a single media sharing application such as Instagram. The contents for this thesis is not limited to a specific application domain, but can be relevant to all media sharing SNS.
Figure 1.0 The three levels of SNS
As there is an increased frequency in posts on SNS, 1 in 4 posts being
advertisements[30],users are more susceptible to incoming noise (noise being defined as information that is not relevant to the user) from media sharing SNS. The theory Signal-to-Noise ratio is discussed in greater depth in section 3.3. The
relevancy of this thesis is exemplified by the need to communicate information effectively- with less noise. Consequently, It will focus on image advertisements containing text elements, to examine whether the placement of text in media sharing SNS advertisements impacts the way users receive information. For example, if
users are drawn to text elements rather than features of the image. The investigation is relevant because as companies and businesses struggle to capture users'
consciousness (visual gravity) in the ever booming attention economy [29], new technology and methods are constantly emerging and evolving to capture users' attention. Consequently, the question arises: What could be a suitable position for text in an advertisement on a media sharing SNS to best communicate information through text? And what are the possible unconscious preferences a user may have as to where a text element should be placed?
1.2
The Need for Suitable Text Placement
Investigating the layout of information systems to discover the best suitable
placement for text elements would increase the chances of an advertisement being read, versus being swiped over. Correctly designing the layout of information to be processed by human - technology interaction could lead to the success of an
advertisement, thereby generating possibly more awareness and / or even revenue. This is true across other media sharing SNS.
Media sharing SNS is effectively playing a larger role in people’s decision making when they are choosing to purchase products. With such influence, the spending on social media advertising will only increase (37.71 billion in 2020) [7], it would be compelling for brands to spend their marketing budget on the most suitable way for information delivery to communicate their advertisements thus generating the greatest revenue. Discovering the most suitable way in which brands can communicate information through text enables users to best process the text
information in each advertisement. The result would play a large role in streamlining advertisements.
Identifying the way text information is consumed by users, can shape the way marketers output information in media sharing SNS to better help users process incoming information. Eye tracking has been used to investigate the following in order to design and improve information delivery tactics: neuroscience, medical research and psychology, product development, market research, simulation, Human Computer Interaction (HCI), User Experience (UX) and for educational purposes[22]. Eye tracking supplies an unpretentiousand real-time behavioral insight to ongoing visual processes of users. Thus, we can determine a user's unconscious visual gravity. This information enables us to take the data and create the best suitable SNS text placement for communicating information in a clearer better fashion so users and people can process information.
Today, there exist many refined ways in which to target the specified users and encourage them to click on ads, however, many people consider these techniques slightly invasive and integrity questions whether it balances the delicate line of consumer privacy. Our goal is to discover if there exists a less invasive
through text [17] in the form of the successiveness of text placement in media sharing SNS. It is relevant because it would bring clarity to brands in the form of a more efficient and effective way of presenting and communicating information in their media sharing SNS advertisements. Additionally, the investigation of informatics leads to “new approaches to system design and development” [23]. Furthermore, during the unique time of COVID-19, it suggests companies and brands to adopt a higher level of an online presence. In the reality that we live in, much of the content moving forward will be presented in a digital format. Capitalizing on the most suitable way to present text in the form of information in media sharing SNS allows
companies to generate effective information delivery with their audiences. By investigating the positioning of a text element on a 1:1 (square crop) advertisement, we could examine the successiveness of communicating its information by investigating if it attracts a consumer’s attention. It was discovered that on average a person forms impressions on a page in 180 milliseconds [28].
Learning how users consciously perceive and interpret messages through advertisements would allow certain layout manipulations to increase the
effectiveness of advertisements. In addition, investigating the successiveness of text placement would allow a concrete understanding to how users first interpret and process text. Thereby, the most suitable text positioning would be used to generate the most effective form of communicating information through text on media sharing SNS advertisements for users to process information.This revelation would serve as a new standard regarding text placement on digital media as message information systems through media sharing SNS.
1.3
Purpose and Research Questions
In Wang et al. [12] their research declares human visual attention is drawn to objects containing text. The research results show that text objects were more attractive than non-text objects. This leads to the question of how it can affect information systems in media sharing SNS advertisements containing text, and the most suitable way to deliver that information for it to be processed by users. Drawing on the problem statement, it is evident that people read print in a specific pattern. Furthermore, it is evident that people are visually drawn towards objects containing text.
Consequently, the purpose of this study is: to uncover if there exists a suitable
placement for text elements in advertisements within media sharing SNS, specifically Instagram advertisements that will best communicate text information.
Research Question One
What could be a suitable placement of text within an advertisement on a media sharing SNS to best communicate text information?
Research Question Two
What are the possible unconscious preferences a user may have as to where a text element should be placed?
The first question is relevant as it explores how text placement layout and human - technology interaction correspond with one another. The second question is
interesting as it more deeply investigates the relationship of a user's conscious preferences compared to their unconscious preferences in regards to visual gravity. Moreover, uncovering where users pay the most visual attention to when reading an media sharing SNS advertisement allows us to draw conclusions on the most
suitable text placement layout for media sharing SNS advertisements. Potential Problems
In the duration of conducting the thesis, some potential problems we can expect to address are: not finding enough people to conduct the study on, people being reluctant or refusing to participate, participants are not within our target audience, complications with the eye tracking software, conducting the study in the least biased way, and having sufficient knowledge to comprehend the results to draw accurate conclusions, undescriptive answers and corrupt data. Furthermore, due to language barriers there may be issues with communicating intended descriptions during the survey. Lastly, potential issues due to COVID-19 circumstances. Learn more about how we will handle encountered problems in section 2.7.
Currently, the topic is relevant because it has not yet directly been explored. Based on previous research, the topic is in the field of informatics because it explores the impact of layout in digital messages through media sharing SNS that can be successfully communicated as information. The potential link between human behaviour and the layout and media sharing SNS ad could possibly relate to increased efficiency in text information communication, revenue and general
awareness in the area of digital marketing. The topic explores text placement in ads and how human - technology interaction can affect the efficiency of that particular ad. In addition, the topic is relevant because it is not constrained to the application
domain of Instagram, but it is also applicable to other media sharing domains such as Pinterest, YouTube and Flickr. The investigation of the topic suits companies and brands who want to better communicate text information to their audiences through media sharing SNS. Lastly, in the time of the attention economy [29], it is beneficial for businesses and brands to use the most effective layout template to communicate their information to their audiences across media sharing SNS.
Expected Outcomes
Predictably, the most suitable text placement layout to best deliver text information on media sharing SNS such as Instagram is the expected outcome. This could lead to a greater interpretation of text information by users thus leading to possible
increased conversions and awareness in the long term and it would be considered more efficient social media marketing.
1.4
Scope and Delimitations
Scope
This thesis will work with 49 participants split between the two research methods. The recommended aim was to work with approximately 30 participants as it is the recommended amount for this thesis.
Participants
We are looking to base the study on 49 participants. Our ideal participant is within the age range of 18 - 44 years old because Statista identifies that age range as the three largest age groups that make up media sharing SNS site Instagram [2]. We aim to have an even distribution between male and female participants
Delimitations
The delimitations of this study includes two participant groups totaling 49 participants with 18 - 44 age range and even distribution of female and male participants. Only advertisements that are still images will be investigated. Additionally, the selected research method: eye tracking study will be conducted on a computer. Participants will not be shown the mock-up advertisements in a media sharing SNS application to decrease potential variables.
1.5
Disposition
The following thesis is structured by the guidelines of Jönköping University and it only differs from the original structure by adding a new chapter 0 named “Informatics definitions” which is a prologue of sorts defining informatics for the thesis below. The rest of the thesis below is structured as follows: first, reviewing the method and implementation, data collection and data analysis. Problem protocol is then
discussed and succeeded by the review of validity and reliability. The literature and theories that the thesis is based upon is discussed in theoretical framework. Lastly, empirical data, analysis, discussion and conclusion.
2
Method and Implementation
2.1
Link Between Research Questions and Methods
The chosen methodology is qualitative because we want to investigate underlying factors that contribute to the effectiveness of media sharing SNS advertisements. The scope of the thesis will include conducting two different qualitative research methods: eye tracking (unconscious) and a survey (conscious). The following methods were chosen because they would deliver conscious and unconscious data to answer the following research questions:
Research Question One
What could be a suitable placement of text within an advertisement on a media sharing SNS to best communicate text information?
Research Question Two
What are the possible unconscious preferences a user may have as to where a text element should be placed?
Referencing the first research question, a survey was chosen because it would allow us to investigate further into the topic of optimal text positioning for communication. The survey allows us to compare through validation for the results from the eye tracking study and discover if a participant's conscious decisions during the survey align with their unconscious decisions of what they notice first in the eye tracking. The survey was found to be the most optimal method to answer our research question because it allowed for a multitude of ways a participant would be able to answer questions starting with: general metrics, open ended, ranking and multiple choice. A survey method was chosen because it also served as an easy way to identify keywords and rank them from most popular to least popular categories. The survey method was modelled off of “Text analysis of open-ended survey responses: a complementary method to preference mapping” [26] which describesmapping and analyzing survey results. The article reflects a similar data analysis process from which our own analysis would follow, for specific breakdown of our analysis method, refer to section 2.6 under Survey Analysis Process.
In reference to the second research question, we have chosen to use eye tracking as the second research method. This method was chosen because it allows us to perceive a participant's unconscious visual gravity of their eye. In the term
“unconscious”, it is meant that the user does not infer any bias, it is unpretentious behavioral insight. We are able to take raw data from the study and assume that it is the user's natural visual tendencies and accurately represents their visual gravity. Unlike other methods such as; interview, observation and questionnaires, the participant would be unbiased with their visual actions and or possible answers in eye tracking. Eye tracking is proven as a relevant method by John Henderson in his
discussion about Human Gaze Control [25]. This method serves as a control for the results in the survey and can help confirm or deny any results.
2.2
Approach
The conducted study is an informatics study which examines the behaviour and visual gravity of users viewing advertisements containing text on media sharing SNS. This is to determine the optimal text placement to best communicate information through text. During the study, two different research methods were used: eye tracking and a survey for a qualitative study. The study follows a Two Group Design as described by Eye Tracking Methodology book [24]. We chose to do a qualitative study to investigate the underlying factors of human - technology behaviour in a person's visual interest in digital advertisements. The pairing of eye tracking and a survey was chosen because one, eye tracking allows us to discover a person's unconscious visual gravity. While, the survey was paired with the eye tracking because it can be used as comparative validation with the eye tracking. It compares unconscious and conscious visual gravity of participants. Furthermore, the survey allows us to ask open-ended questions that would be similar in an interview, but instead could be done online. Consequently, the survey grants us deeper knowledge of what our participants are actively recognizing as their visual focus points. By pairing the two research methods together, it allows for reassured validity and
reliability when the results of both reflect the same outcomes. As a result, knowledge gained from the studies will allow insight to the optimal communication of text as information through media sharing SNS application Instagram.
To increase sample size, more participants were contacted to complete purely the survey without having completed the eye tracking experiment. The two test groups were created as follows:
Group A: completed both eye tracking and survey Group B: completed survey only
The groups would later be separately analyzed and then those results would be compared.
2.3
Work Process
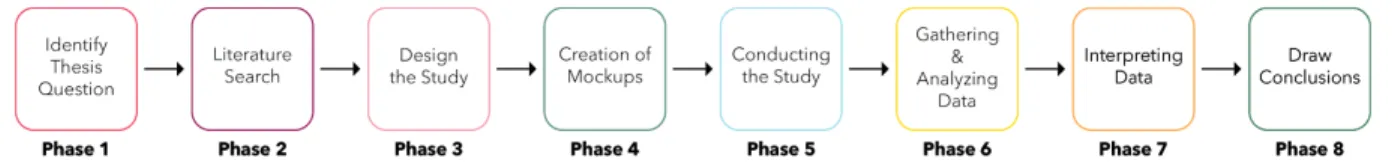
The work process for the thesis is structured in phases. Each phase encompasses a grouping of work to be accomplished simultaneously. The phases are structured as follows. To begin, a literature search is conducted to gain background knowledge and support for the thesis question. Next, formulating and writing the research questions that will be answered during the thesis. Furthermore, the formulation of how those questions will be answered. Next, the approach and design of the study. Thirdly, a timeline is created in which the schedule of the thesis will follow [Figure 1.1]. Next, the introduction section of the thesis is written followed by method and
implementation as well as theory. After the study is conducted and data is recorded, the analysis of the data is completed and finally the discussion and conclusion is completed.
Figure 1.1 Phases of the work process used when writing this thesis Phases Breakdown
During the process of the phases, the thesis was being written simultaneously according to the current phase we were in. The phases are based on a logical timeline of events for optimal productivity for the authors [Figure 1.1]. For further in-depth detail refer to section 2.4.
Phase 1: Identify Thesis Question
Brainstorming and identifying possible ideas. To identify possible ideas we were inspired by our own ideas, societal need, thinking if an existing item could be improved upon and also briefing previous literature. Once we solidified an idea, we narrowed it down to be more specific of what it would entail. If the idea was feasible, we researched whether the idea and thesis question was novel and could be
conducted.
Phase 2: Literature Search
Conducting a literature search and finding articles that would support our argument and serve as theories, this was an important phase as it broadened our prior
knowledge and served as inspiration in the form of ideas for research study. This phase included identifying background knowledge that we would use to support our thesis. This phase is where we chose our main theories that were used in chapter 3. To conduct a literature search, we first identified keywords associated with our topic. These words included: text, advertising, SNS, Instagram, text placement, positioning, media sharing SNS, design, positioning, marketing and attraction. The keywords served as a strong basis to start looking for relevant articles using databases such as Springer, ScienceDirect and ResearchGate. Next, we explored theories being used that would be applicable to our own thesis. This included articles such as The attraction of Visual Attention to Texts in Real-World Scenes [12]and Placement of Call to Action Buttons for Higher Website Conversion and Acquisition: An Eye Tracking Study [27]. Lastly, the search for literature that supports arguments with general knowledge. This literature resembles statistics such as the Number of Active Instagram Users [4]. It should be noted that most of the literature search is
conducted pre-thesis. However, as the thesis is written, a need for more references is often discovered and therefore conducted simultaneous literature searches while writing.
Phase 3: Design the Study
We designed and modelled our study based upon previous literature [24] and
determined our participant requirements, limitations of the study, delimitations of the study and how we would conduct the study and with what methodology. A key component of this stage is deciding how to conduct the qualitative study and determining the logistics of it. We chose eye tracking and survey as our
methodologies because participants could answer open ended questions in the survey additional to ranking questions in a digital format, which proved essential due to COVID-19. Our study was image based and the eye tracking would allow for scanpaths metrics (described further in section 2.5). Furthermore, the eye tracking would create the closest result to an unbiased scanpath revealing the participants first fixation points. Next, we chose the survey because it would complement the eye tracking study as we could get deeper insights from participants‘ “conscious” visual decisions. Furthermore, we were able to compare results through validation by having a control and non control group.
The participants age range was based upon the three largest groups of the average US Instagram users [2]. We chose Instagram as an application domain because it is one of the relevant platforms under media sharing SNS. Additionally, it is one of the fastest growing, 75.3% of US companies are estimated to have an Instagram
account in 2020 [11]. We aim to have an even distribution between male and female participants as according to Statista, the gender distribution of Instagram users are 51% female and 49% male [3]. We believe the target audience of Instagram users are represented by our chosen participants. Participants were recruited by creating an online signup form with time slots throughout the day for a span of three
consecutive days. The participants would fill in the time slot they were available to volunteer. The participant sign up sheet was sent out to students and friends.
However, the participants had to be within the age of 18 - 44 years. We had two test groups, Group A and Group B. We adapted the research experiment including two test groups as initially we were not able to meet our 30 person quota for the eye tracking study. We expanded and created a control (eye tracking) and non control group (survey) group that we would be able to compare for validation to draw conclusions. Group A had 17 participants and Group B had 32 participants. We encouraged more participants to Group B because we did not know what to expect in the responses if we would have to veto answers for specific reasons outlined in section 2.7.
Phase 4: Creation of Mockups
The next part of phase three included designing the material that was used in the study, specifically the eye tracking and survey. The material was designed by using the standard image crop of media sharing SNS application Instagram being a 1:1. Previous research had been done identifying typical aesthetics of Instagram posts containing text. Next we designed the material by placing text on all four corners and
the middle. The sixth image had text in all places to be used as a control
comparison. During this time, we also designed the survey that was to be used. The images that were designed included 6 variants (shown in section 2.4, Figure 1.2). Each variant had text in a different quadrant of the image. This is because when each participant viewed the image during eye tracking, we were able to see if they were drawn to the text or other features of the image.
Phase 5: Conducting the Study
Group A: Eye tracking and Survey. 17 participants Group B: Survey. 32 participants
Once the study had commenced, Group A was the first to participate. Participants would book a time slot to participate in the study. The time slot had 20 min intervals throughout a day for three days. Participants began by signing a waiver form and then were seated at a desktop computer and calibrated with the eye tracking software. Once calibrated, participants completed the task as described in section 2.4. Thereafter participants completed the survey after they finished the eye tracking. Group B participants were sent a link to the survey in which they could participate in at a time that accommodated them. The eye tracking study took place over three days. Group B survey was issued after the eye tracking is completed. Once the survey for Group B was sent out, it was given a time span of 24 hours for
participants to complete in a leisurely manner. It was kept to a short time span due to the completion timeline of the thesis. While the survey consists of two groups: A and B, Group A will immediately complete the survey directly after the eye tracking segment.
Phase 6: Gathering and Analyzing Data
After the eye tracking study was completed, data was stored in video format that identifies scanpath metrics. Next the data is compiled by turning the video scanpath into a single image containing the scanpath metrics (shown in section 2.6 figure 1.4). The data was compiled into a single image as it is easier to analyze the data from a single view point containing all metrics vs a video with the metrics spread across different frames. Next, survey data was gathered by Google Forms. Google Forms automatically saves responses and groups them together. Responses can be easily exported to an Excel sheet for further analysis. Once in a spreadsheet, data
undergoes a formal check to include / disclude participants within the studies scope. Furthermore, individual analysis was performed, details can be found in section 2.6. Lastly, a quadrant analysis is performed which is outlined in section 2.6 under eye tracker.
Phase 7: Interpreting Data
The data is interpreted through analysis. Analysis techniques which are provided by previous studies and guidelines as specified in Phase 3 and section 2.6. Data is interpreted by objectively comparing results in the survey and the eye tracking. Once
all data was collected in various forms: images, spreadsheets and quadrants we visualized the data for ourselves to help make sense of it. This involved segmenting survey data in spreadsheets with valuable parameters and visualizing general metrics in bar graphs, and pie charts.
Phase 8: Drawing Conclusions
The last step is to draw conclusions based on data analysis results. We drew conclusions aided by background literature research, our theories in chapter 3 and by comparing the results in the eye tracking and survey.
2.4
Design
Before conducting the study, participants signed a consent form at the beginning acknowledging the use of their data in our thesis. Participants would also
acknowledge that proceeding to answer survey questions, they would consent to their data being used in our thesis. The experiment was designed by having six different mock-ups of media sharing SNS ads. The ads were square crop (1:1), specifically 1080px by 1080px, refer to Figure 1.2. The images all had a text form within them and they were placed in different quadrants of the square image to see if the positioning impacted users' gaze points [25].
Eye Tracking
The eye tracking experiment was designed by having six different mock-up media sharing SNS ads, refer to Figure 1.2. To reduce variables, the participant would only be shown an advertisement where the image is cropped 1:1. However, the ad would not be presented in the form of the media sharing SNS application feed. Instead the ad is shown to the user on a desktop version filling the whole screen. This decision was made to exclude the application feed as it would serve as an extra visual
distraction. To best quantify the results, it was determined that the study would focus purely on the visual attention on the ad itself and not its environment as well. As a result, each participant would view a slide containing the image of an advertisement for approximately three seconds and then would click to the next image. The data of where their eye movements first occurred on the particular image is then recorded. The eye tracking study was modelled after the theory and practices in the book Eye Tracking Methodology [24] where the study format was Two Group Design. Two group design experiment formats involve all participants being given “treatment”. In our case, all participants participate in the study- Group A: eye tracking and survey Group B: survey only. Once the participants finished the eye tracking segment, they would directly execute the survey.
Survey
The survey was used to discover if the eye tracking participants unconscious results also reflected their conscious results. The survey consisted of three sections. The first section, the survey asked general open-ended questions such as: familiarity with
application Instagram, if they generally notice ads, and if they click on ads. The questions were multiple choice structured in the format of, strongly agree to strongly disagree. The next section of the survey presented the same advertisement
mockups that were used in the eye tracking study. However, in the survey
participants would be asked with an open ended question to rank and name features of the advertisement that specifically stood out to them. This question applied to all six of the mock-ups used. This type of question was chosen because it allows the participant to actively notice which features are apparent to them, thus enabling the conscious choice. The last section, the same six mockups were used once again; however, features of the ad were already listed and participants ranked from one to the total number of features apparent, in the order of first seen to last seen. The reasoning for this section was to solidify the correlation between section two where they did not have any suggested features and to investigate if those results matched up with the way they ranked the suggested features. When designing the survey, we followed the guide Understanding and Evaluating Survey Research [15]. Once Group A participants completed the eye tracking segment, they were asked to immediately complete the survey. Whereas the survey was sent out to Group B participants after Group A study was completed. The survey was distributed to Group B participants via direct message, uploaded on social media such as
Facebook, Instagram and Snapchat. The survey was open to Group B participants for a span of 24 hours.
2.5
Data Collection
Group A: Completed both eye tracking and survey Group B: Completed only the survey
To collect qualitative data, two methods were chosen. First eye-tracking using software and secondly a qualitative survey. The data collection consisted of collecting empirical data from eye tracking and the survey. Participants that completed the eye tracking experiment also conducted the survey. Those
participants (Group A) results were compared separately from those who completed only the survey (Group B). The data collected can be divided by two methods: gaze point data and statistical survey data.
Eye Tracking
Data from the eye tracking study is collected in the form of gaze points and video. The gaze point data implies where a participant's most outstanding metrics in eye tracking were focused and directed on the screen and the length of their gaze. The data is able to reveal where a participant's first point of contact is of their visual gravity [8]. To collect this data accurately, during the study each participant is first properly fitted to the eye tracking software. Next they are calibrated with the software as well as testing accuracy of the eye tracking individually. Once the participants accuracy is deemed acceptable (they are able to realize or acquire all bullseyes during calibration) the participant is allowed to begin the study. To collect data, we followed Eye Tracking Methodology book [24], collecting objective metrics- in the form of scanpath and specific fixations.
Survey
The survey was conducted through Google Forms. The platform was chosen
because it can be designed with collaborators. Furthermore, Google Forms presents organized and analyzed empirical results from the responses. Participants were encouraged to complete the survey on their own and only ask questions if
necessary. If participants asked questions they were answered in an unbiased way so they would not affect or taint survey results. The survey data was collected through Google Forms which automatically visualized metrics such as age, gender and multiple choice responses. Open ended answers were exported to spreadsheets and were analyzed according to the Step-by-Step Guide to Qualitative Data Analysis
[13] which is discussed in the following section 2.6 Data Analysis.
2.6
Data Analysis
The qualitative data analysis method we followed for reviewing the survey was A
Step-by-Step Guide to Qualitative Data Analysis written by Nancy Gibson et al [13].
The eye tracking was analyzed by the following Visual Analysis of Eye Tracking Data
Group A was analyzed separately from Group B. Later, a comparison of Group A and Group B was analyzed in order to draw conclusions.
Eye Tracking
To best display data from the eye tracking, a visualization technique is used in the eye tracking study to display data which is called scanpath [24]. It is a line based visualisation that shows all the gaze points of participants' data and how much time their eyes have been focused on the same location. Visualization [14] method was chosen because it accurately displays results and the gaze patterns fast and clear. We use scan paths instead of heat maps, because our main research question searches to find the location of where participants' visual gravity lands first. This way, advertisements can be designed to accommodate peoples natural visual tendencies. Each eye tracker video was analyzed by marking down sequentially the first and following consecutive gaze points approximately 10 on each ad to see where
participants' first gaze point was and the path of how they scan the rest of the image. Scanpath metrics are to be stored in a table which is organized by as many rows and columns as there are a number of scanpath data sequences. The raw data was then condensed and averaged in a separate duplicate table named parsing diagrams [24]. Data is further analyzed by comparing the data set from the eye tracking study with participants' answers in the survey. This investigates if participants of the eye tracking study results reflected the same results as the qualitative survey. When comparing the two data formats, the eye tracking would reflect the unconscious gaze points whereas the survey reflects the conscious gaze points. Figure 1.4 reflects gaze paths that can be identified during the gaze point analysis. The analysis process is as follows:
Analysis Process
1. Create Illustrator File
Creating an Adobe Illustrator file with six layers and sixteen canvases. In each layer of each canvas, the mockups of each advertisement were added.
2. Open Eye Tracking Video
Opening each recorded eye tracking video data individually within the video editing software Adobe Premiere Pro. For maximal efficiency, having the video material and Adobe Illustrator open side-by-side on the same computer screen.
3. Create Gaze Point Scale
Next, create a gaze point scale in Adobe Illustrator for easier marking of where the participants have looked.
4. Analyze Exported Video
Analysing the exported eye tracking video frame-by-frame to observe the tracked gaze points that are recorded by the eye tracking software. 5. Mark Down Gaze Points in Still Image
Next, the gaze points in the video are individually marked down in Adobe Illustrator on a still image of the advertisement.
6. Repeat Step 5
Repeat step 5 for all 16 participant videos on all 6 advertisements. 7. Apply 4x4 Grid to Still Image
Lastly, once all individual participant videos are analyzed for all 6
advertisements, a 4 by 4 grid [Figure 1.3] is applied over each still image
[Figure 1.4] with each square marked from Q1 to Q16. 8. Record Quadrant
Next, in a spreadsheet the first seen gaze point was marked down by writing which quadrant in the 4x4 grid the gazepoint ends up in. For example, gaze point one is in Q5.
9. Add Quadrant Data to Spreadsheet & Convert to Percentage
Finally, once all first registered gaze points have been recorded in the spreadsheet, the recurring quadrants are added up and converted into percentages. The highest percentage can be seen as the most dominant quadrant looked at by participants. The highest ranking quadrant can later be compared against results from the other advertisements to see if there was a recurring pattern. Refer to [Figure 1.5]
Figure 1.4 Still images containing scanpath metrics
Group A Quadrant Highest Ranking Quadrant % Highest
Example Q5 Q5 1 / 16 <- Participants 6.25% Participant 1 Q6 Q6 4/16 25% Participant 2 Q11 Q7 6/16 37.5% Q7 Participant 3 Q7 Q10 1/16 6.25% Participant 4 Q6 Q11 3/16 18.75% Participant 5 Q7 Undecided 2/16 12.5% Participant 6 Q11 Participant 7... Q7
Figure 1.5 Spreadsheet of quadrant analysis that documents which quadrant the first gaze point registered for each participant
Survey
The survey reflects the conscious observations made by participants. The survey is an open ended survey where responses are individually grouped, analyzed and compared amongst other responses. In adjustment to our thesis, our survey analysis incorporated features from three literature texts described below. First, “Text analysis of open-ended survey responses” [26] where we use the method condensation and categorization. Secondly, “Step-by-Step Guide to Qualitative Data Analysis” [13]. Here we use the methods organizing ideas and concepts, watch for the unexpected (outliers) and Categorizing Ideas and Concepts. Thirdly, “The second step in data analysis: Coding qualitative research data” [31]. In the last analysis method, we integrated the process of writing personal memos for the author about data to clarify
and better interpret it. The revised content analysis process for this thesis is outlined below as follows:
Analysis Process 1. Preprocess Text
Removing spelling errors, punctuation, hyphens and digits. Then follows the removal of stopwords (the, a, an, in etc.). We found that removing negations and qualifiers was unnecessary for our analysis as participants were asked to rank key features.
2. Selecting Keywords
Identifying patterns / trends of recurring keywords in specific rankings. As suggested in Step by Step Guide to Qualitative Analysis [13], the researcher should make notes of recurring words / ideas. Individual word analysis is not sufficient because participants can use a single word but it is either out of context a word could have multiple meanings, for example “Citron vs Lemon”. Therefore, each response was individually analyzed to identify key ideas. 3. Categorizing Ideas and Concepts
Organize identified ideas and key words into categories. Next, once individual categories were created, general umbrella categories were made to fit sub categories into them. [Figures 1.6 and 1.7]
Category Participant Ranking Summary %
Person The person, Hawaii title, Price 8/17 Person 47.10% Text Place 1. Place 2. Price 3. Picture 6/17 Text 35.30% Text Price 1. Price 2. The guy 3. Hawaii 1/17 Surfboard 5.90% Sidebar 1 Blue. 2 Water. 3 Price 1/17 Background 5.90% Person
1 Man holding something 2 price 3 some
icons 1/17 Sidebar 5.90%
Group A Open Ended
Hawaii Image Category Commonality %
Person 47.10% Text 35.30% Surfboard 5.90% Background 5.90% Sidebar 5.90%
Figure 1.7 Breakdown of the commonality of categories
4. Tabulating
Once categorized, the number of key ideas in each category is added up and converted to percentages.
5. Search for Outliers
Search for outliers or negative instances in the data and generate possible explanations for those patterns.
6. Visualizing Results
Visualize the features that ranked highest to lowest in a table format
The eye tracking study and the survey was analyzed in the form of comparing the results from both of them and identifying any similarities that they reflect. The survey is used to help confirm and solidify results within the eye tracking study
Quadrant Analysis
Eye Tracker:1
.
Add Quadrant Grid Over Analyzed ImageFirst, pasting the quadrant grid over each analyzed participant video for the six different advertisements. A total of 96 images were analyzed in adobe illustrator. 2. Document in Spreadsheet
The quadrant in which the first gaze point is located in was recorded in a spreadsheet.
3. Creating a Master View
The first gaze point from each participant is collected and added into one still image of the advertisement. Essentially, there are 16 first gaze points collected on one still image.
4. Tabulate
Lastly, counting where each gaze point is located and adding the same quadrants together. By doing so we identified common themes of locations where participants first looked. Refer to any of the figures in section 4.1
Survey:
1. Apply Quadrant Grid Over Plain Advertisements
Using the same quadrant grid system (step 1 from eye tracker). 2. Locate Feature
Locating the first named feature on the advertisement from the descriptions in the survey data
3. Document in Spreadsheet
Mark down the quadrant in which the feature appears in. 4. Tabulate
Lastly, tabulating the results in the spreadsheet to discover the location (quadrant) where the most features were named to be.
*NOTE The process for analyzing gaze points through the survey above, we were
unable to complete this process due to participant descriptions- not being descriptive enough. Thus, we were unable to pinpoint accurately the feature participants of the survey were describing. The process was still included because it can be used as a framework in the future.
2.7 Problem Protocol
Referring back to section 1.3, potential problems expected to occur will be dealt with in a variety of ways. Below is an outline of how we intend to mitigate problems we may encounter.
1. Lack of Participants
The original plan was to reach out to friends, friends of friends, students and people living in student accomodations. If we were not able to find sufficient numbers, we would post a notice on social media- Facebook, Instagram and Snapchat- in order to reach more audiences. Next, if we still could not fulfill 30 participants for the eye tracking study, we would implement another test group (this being the case, we created Group B). We would create a Group A and Group B study group. Group A would have completed the eye tracking and the survey whereas Group B would only participate in the survey. This is because the survey is easier to distribute and is more convenient for participants to complete on their own time.
1. A) Participant Refusal
Participants have the right to refuse and if they do it is not an issue. After assessing the number of current participants, if the numbers do not meet minimum
1. B) Outside Target Audience
Participants that are outside of the target audience (18-44 years old) are
automatically deliminated. The number of active valid participants is assessed and decisions are made based on the number of current participants if, they fill the requirement of 30.
2. Eye Tracking Software Complications
If there are complications with the eye tracking software, the first person of contact is professor Bruce Ferwerda. If issues are serious enough and cannot be resolved through Bruce, the eye tracking study will have to be removed and instead replaced with just a survey. The survey and possibly research questions would have to be rephrased as the survey has limitations regarding reflecting user bias.
2. A) Corrupt Data
If the eye tracking data becomes corrupt, we would need to be prepared to have time to investigate how to fix the data, or have enough participants so that we can
disregard that participant. 2. B) Eye Tracker Stops
If the eye tracker stops working, depending what stage in the study, measures could be taken to include or disregard data from that point. If we were not able to complete the study, a second research method such as the surrey would need analytical results to apply to the research.
3. Conducting Study in Leased Biased Way
Literature research from previous models applied for guides to follow when conducting the study. Eye Tracking Methodology [24] is followed as a guide for conducting the eye tracking study. For the survey, Understanding and Evaluating Survey Research [15] is used as a guide to remain objective and be direction for any issues arising, we will refer back to it. Lastly, if there are any other issues regarding how to conduct the study, a Qualitative Research Methodology Design [16] guide will be referenced.
4. Comprehending Data
Literature research is done to find methods which describe how to perceive data Eye Tracking Methodology [24] and will be referred to for any issues. Furthermore, open discussions with colleagues and thesis supervisors to ensure correct procedures were followed.
5. Drawing Accurate Conclusions
Maintaining an objective bias to reflect on the data. Using key information from background literature research to help describe results.
6. COVID-19
The occurrence of COVID-19 was an unexpected circumstance in 2020 where it was a foreign issue for many to deal with. In the case for this thesis, the majority of the
work scope was already being accomplished online. In case COVID-19 restrictions worsened, the only thing affected would have been the eye tracking study.
Consequently, an alternative method of online survey would be the new chosen research method.
7. Language Barrier and Undescriptive Answers
As not all participants are from the same country, many do not have the same
English language literacy level. As a result, there is a chance that some answers will not reflect what the user intended and what we as analyzers interpret. Furthermore, some descriptions may not be descriptive enough for proper analysis. In this case, answers have to be vetoed and certain analysis methods may not be executed due to inconclusive data. In addition, the language barrier has to be taken into account within limitations of the study (6.3).
As COVID-19 had a major effect on the world, it had no outstanding consequences on our study. We were finished with the experiment before the outbreak, and we were able to improvise and gather more participants via Group B. The only problems we encountered were as mentioned earlier: lack of participants in our experiment, and the eye tracking video being inaccurate on a single participant. Originally, we had 17 participant videos however, one of them we had to disregard.
2.8
Validity and Reliability
Validity
The thesis is based on previous research where text objects are seen as more attractive than non-text objects [12]. A qualitative method was chosen because it would allow an in-depth understanding of participants' conscious and unconscious observations when looking at text elements. To best follow the qualitative
methodology, we referenced “Qualitative research methodology design for teachers pedagogical action models and students socio- cultural learning experience
interaction evaluation” [16] where it outlines a qualitative model and describes the process for their study. In turn we applied applicable elements to our study and replicated the process. We also referred to phase 3 in section 2.2. We chose to incorporate two research methods since we could compare results for validation. As a result, having two research methods reassures the validity of the study.
For the eye tracking study, before each new participant conducts the study, the program and eye tracker will be re-calibrated for each participant. Furthermore, once calibrated, the participant is able to individually test the accuracy of the software by checking their eye movements on a calibration mat. Once the level of accuracy reached the satisfaction level - participants being able to reach the bullseye of each target on the calibration mat, then the testing began. The eye tracking study followed phase 5 in section 2.2.
Eye tracking was the chosen method for the study as it would most accurately show the participants visual interest without reflecting a conscious bias. The survey was a chosen method used as an additive form to confirm or deny the results in the eye tracking experiment. The questions in the survey were structured in a way that the participant consciously answers open ended questions and then ranks what features they were most drawn to when shown the mock-up images in the eye tracking study. This methodology was used to confirm a participants first open ended answers with the answers they provided in the ranking section.
One aspect regarding the survey and validity would be a language barrier when asking participants to explain features and rank suggested features of an image. As the majority of the participants were from European countries, English is not their primary language - which was the chosen language of the survey. This barrier could result in less accurate description of what the participant describes.
Reliability
Regarding reliability of the study, some initial discrepancies can be noted. First, the eye tracking experiment took place on the desktop version. Ideally, it would have been on mobile to best reflect a media sharing SNS application scenario. However, the eye tracking technology available is not mobile compatible. Secondly, other scenarios to consider are media sharing SNS apps have more visual distractions that would possibly affect real life testing. However, a decision was made to exclude the Instagram format as it would deliver more accurate results for this thesis by eliminating extra visual distractions.
To increase participant sample size, two groups were created: Group A and Group B. Group A participated in both eye tracking and survey study in a controlled environment. Whereas Group B only participated in the survey- in an uncontrolled environment. The reason for having two test groups is due to the lack of participants able to engage in the eye tracking study. In the end, results from Group A and Group B will be analyzed and compared separately against each other to see if they reflect the same results, thus increasing reliability of the study. However, a drawback of the two participant groups both conducting the survey, an implication was that Group A may have had an advantage in the survey by already having previously viewed each advertisement image prior to the survey.
During the eye tracking analysis, there could be calibration issues that occured, thus not giving us the most accurate gaze point location. This is due to the human factor in the experiment. For example, the participant sits in a chair, their physical
movements even if they are minute, can affect the calibration of the eye tracking. Furthermore, each participant was only calibrated at the beginning of the experiment. They were not calibrated individually for each of the 6 advertisements.
To maximize the reliability of the study, the phase framework in section 2.2 named Work Process was followed to ensure a cohesive unbiased study. During the
analysis process, an outlier search is done to identify any outliers and attach an explanation for those outliers- as this is recommended by Text analysis of open-ended survey responses: a complementary method to preference mapping
3
Theoretical Framework
3.1
Link Between Research Questions and Theory
To give a theoretical foundation to the first research question “What could be a suitable placement of text within an advertisement on a media sharing SNS to best communicate text information?” The following area is described in the theoretical framework: 3.2 “F Pattern Scanning of Text and Images in Web Pages” is covered, because the argued principles of visual gravity are based on a digital scale which aids in determining the correct text placement and formatting of ads for users to receive information when addressing media sharing SNS ads. Furthermore, 3.3 Signal to Noise Ratio describes the battle between relevant and irrelevant
information on digital interfaces. Learning how to align 3.2 and 3.3 allows for optimal communication of information.
To give a theoretical foundation to the second research question “What are the possible unconscious preferences a user may have as to where a text element should be placed?” The following areas are described in the theoretical framework: 3.2, and 3.4 Attraction of Visual Attention is covered because they cover
psychological aspects of eye attention and behaviour. 3.2 is covered because Edmund Arnold identified on print material a reader's eye attention will naturally occur in the top left corner of a page as the first spot they look. This is relevant because the theory helps uncover what could be the best text placement format for communicating information.3.4 is covered because people tend to find objects containing text more attractive than non text. It is especially relevant as it discusses how users are more so drawn to text over image features. The theory helps support that in social informatics, text is more relevant when compared to other image features. Utilizing theory 3.2 and 3.4 can solidify the existence of a possible suitable text positioning in media sharing SNS ads to communicate text information.
Theory 3.5 information systems explains the role of informatics and how it relates to the design of an information system (where text is placed) and the impacts on communication of information. Thus, it exemplifies the relevance for effective communication of information.
Theory 3.3 Signal to Noise Ratio discusses how to effectively reduce outgoing digital noise on an interface so a user can best perceive the signal an interface is trying to communicate. The theory serves as evidence that information communication can
always be improved upon. It allows room for the possibility of developing a suitable text placement layout for text information communication.
The theory 3.6 demonstrates the significance of eye tracking data and perceiving a user's unconscious data. It also proves the relevancy within the field by using eye tracking as a research method. The following study is relevant because as stated by John Henderson, he argues “[gaze control] has become of central concern in several
core cognitive science disciplines” [25]. John continues to discuss how the visual
cognitive system actively controls gaze towards key features and informative scene regions.
Below is a description of each theory used in the thesis.
3.2
“F” Pattern Scanning of Text and Images in Web
Pages
According to Kara Pernice, users scan text and images in a pattern illustrating the English alphabetical letter F [35] or [Figure 1.8] where, “‘F’ Pattern Scanning of Text and Images in Web Pages” [37] confirms the findings in Nielsen's ‘F’ pattern (2006)
[36]. They first look in a horizontal movement from left to right, most commonly across the upper part of text or an image- which shapes the top line of the letter F. Following the first step, users then move their eyes slightly down the page or an image and continue to read horizontally across the page covering a shorter area and forming another horizontal line which then shapes the second (lower) bar of the letter F. The user proceeds to go through the left side of the content in a vertical
movement forming the letter F’s stem. This pattern still occurs today on both desktop and mobile devices [36]. This pattern exists for several reasons, such as: poor
design/layout, users scanning for task relevant keywords, thus not fully reading each sentence or object [36]. Although this type of scanpath occurs, often it is considered unfavourable for businesses trying to convey information in: blogs, advertisements and websites as substantial portions of important information can be overlooked. The best practiced way to reduce negative visual scanpaths would be utilizing different font weights, ensuring text is clean and concise, visually grouping related content and making use of different content formats such as text, imagery and video [36].
3.3
Signal-To-Noise ratio
We come across an abundance of information every day, but how much of it is actually relevant? Signal-to-noise ratio (SNR or S/N) is a measure used in science and engineering to compare desired information and unnecessary clutter
(background noise). Signal is defined as information that someone is looking for (information being communicated), whereas noise is the majority of information encountered (irrelevant information)- something that is irrelevant to what one is looking for [10] [Figure 1.9]. Simply, SNR can be informally referred to as
useful:unuseful information. Signal-to-Noise ratio in human - computer interactions, shows the proportion between relevant and irrelevant information in an interface [21]. This “noise” has a wide range and can vary from text to other visual elements such as gifs, icons and advertisements. Everything a user scans through while looking at an interface can count as noise as it is task relevant. Even though the definition might seem clear, it is harder to decipher what is noise and what is signal, since noise varies from person to person, depending on their goal. One person's signal can be another one's noise. High signal-to-noise ratio is good, therefore maximizing signal means making the important information clear: clear writing, relevant imagery and graphs, removing all irrelevant UI elements or content and simply keeping the things minimalistic. Minimizing noise means removing everything that is unnecessary for that page, unrelated images or graphs, ads, animations and gifs, bold text in wrong places and anything else that might distract the users. To maximize
signal-to-noise ratio, the designs of content should be kept neat, properly aligned, without any clutter on the sides or between paragraphs or columns. Header or other important text should be bigger in font size or weight, call-to-action should be clearly visible, different color or stand out in any other way, icons can be added instead of text in menus or as buttons, signals, navigation should be consistent throughout the whole website, etc. At times, keeping sites completely neat excluding all the clutter and irrelevant parts might not look visually pleasing, therefore we can aim for reasonable signal-to-noise ratio. This means keeping things that represent brands, promote products or serve other business goals.
3.4 Attraction of Visual Attention
In the scientific paper Attraction of Visual Attention to Texts in Real World Scenes
[12] participants in their study were shown real world images- outdoor and indoor scenes that contained text on a computer screen. Text objects in the study were considered “text-related labels” or “background” labels such as “road, sea, building”. It was found that visual features of text rather than salient features were the main attractors of attention as described by H. Wang and M. Pomplun in the article [12]. During the study, the participants were allowed to view the images for 3 seconds with a 1 second break of looking at a blank screen after each image. Images that had text on them included banners, license plates and other plain text. Non text images were composed of indoor and outdoor scenes not containing any text.The results showed that the fixation probability on text objects was much higher than on non text objects. As a result, it was determined that objects containing text were more attractive to the human attention than objects not containing any text. However, according to the authors of the study, they claim that the definition of background is not clear as to what labels should be considered background and foreground. The purpose of the study was aimed to verify the existence of a bias towards text objects and to investigate its underlying factors. It should be noted that in the study the authors claimed a person's bias towards text was influenced by their familiarity with the writing system and language of a given text.
3.5 Information Systems
Information systems (IS) are important because the thesis is studying how design on an information system (where text is placed) impacts the communication of
information. Where design systems are intended to create more effective information systems. Furthermore, it is argued by S. Gasson [33] that the “difference between ‘user’ focus and a human-centered focus lies in the way in which technology is designed”. This argumentation aligns itself with the thesis text because the thesis seeks to present “the human-centered approach to the design of technology”. A human-centered approach can be summarized as placing human need, skill, creativity and potentiality at the center of activities of technological systems as defined by “Human-centered vs.user-centered approaches to information system design” [33]. In addition, it is argued by [34] that “Systematically incorporating human-centered design is necessary for successful development of information systems”.
It is argued that information systems are a distinguished discipline with five types of theories[32]: (i) theory for analysing and describing, (ii) theory for understanding, (iii) theory for predicting, (iv) theory for explaining and predicting, and (v) theory for design and action. For this thesis, we focus on (v) theory for design and action. The theory explains “how to do” something. The theory revolves around tools and
methodologies used in the development of information systems. Homogenous research fields are referred to as engineering type, constructive type, prototyping, systems development and design science. Design science consists of information system development process and concepts. System development encompasses the following segments as described by [35]: analysis, design, development and
implementation of information systems and decision support systems.
3.6 Human Gaze Control During Real-World Scene
Perception
Gaze control is described as “the process of directing fixation through a scene in real time in the service of ongoing perceptual, cognitive and behavioral activity” [25]. Gaze patterns information is acquired during fixations. Author John Henderson
explains the relevance of gaze control because users actively seek out “task-relevant visual information”. It is also said that eye movements supply an unpretentious and real-time behavioral insight to ongoing visual and cognitive processing of users. It is argued that over the past 25 years eye movement studies have been less studied to understand visual and cognitive processes in scene perception. However, gaze control has recently rekindled interest within the community.
4
Empirical Data
Data results are divided by eye tracking data and survey data. The following section is structured in the way of first general empirical data, eye tracking and lastly, survey data.
General Empirical Data
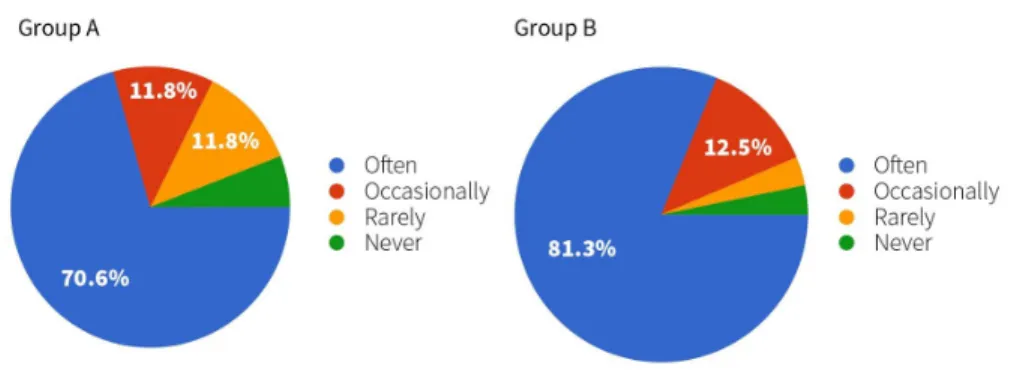
Figure 2.0 Gender distribution of Group A and Group B
Group A had a balanced gender distribution within the group, whereas Group B had 31.2% more females than male participants.
Figure 2.1 Instagram usage for Group A and Group B