Pre-Study of the Important Factors for the Factory
Start-Up Abroad
Master Thesis Work
30 credits, D-level
Svitlana Checherenkova
Production and Logistics Management
Institution for Innovation, Design and Production Development, IDP
Report code:
Commissioned by:
Tutor (company): Anders Bindekrans
Tutor (university): Sabah Audo
ACKNOWLEDGMENTS
This Master Thesis is the culmination of my education at the Production and Logistics
Management program at Mälardalens University. It has been carried out at Väderstad Verken, Väderstad.
This Master Thesis would not have been possible without help and inspiring guidance from many people. I would especially like to thank Anders Bindekrans, Andreas Stark and Stefan Östfelt from Väderstad Verken who through our weekly meetings guided me, shared their experience and gave inspiring ideas which formed this thesis as it is. Without their constant interest and simulating discussions this thesis would not have been possible. I would also like to thank all people at Väderstad Verken for explaining the processes and products as well as answering all my questions with patience.
I would also like to thank my supervisor Sabah Audo who always gave me his advice about the project and always answered my questions.
Additionally, I would like to thank all Swedish tax payers because without scholarship from the Swedish Institute and a tuition free education for foreign students I would not be able to study in Sweden.
Väderstad 2008-01-18
ABSTRACT
In the past years Väderstad Verken has been developing rapidly and expanding the sales of its machines in new markets, in particular in Eastern Europe. Due to the growing sales and some risks related to possible increases in the import duties on some agricultural equipment the company is considering the possibility of building a factory in the Eastern Europe to serve that market.
For this reason the company was interested in a pre-study on the important factors for the factory start-up in Eastern Europe, in particular, Russia and Ukraine. Thus the scope of the thesis included the research and identification of the factors important particularly for
Väderstad Verken as well as identifying some general steps necessary for the factory start-up. In order to identify and analyse location factors critical for Väderstad Verken, literature on location analysis was analysed in order to identify a list of possible factors as well as tools which could be used to evaluate them.
Center of Gravity and Analytic Hierarchy Process (AHP) have been selected to evaluate the performance of several regions on these factors to identify the suitable location of the factory. Expert Choice software was applied in order to simplify the comparison of various factors following the AHP steps.
A specification for the potential factory has been defined given the desired production
capacity and requirements. Two factory layouts have been suggested taking into consideration the possibility of the factory expansion.
In some way this master thesis could be used as a guideline for the selection of suitable manufacturing location as well as factory start-up.
CONTENTS ACKNOWLEDGMENTS ... 2 ABSTRACT ... 3 1 INTRODUCTION ... 6 1.1 Background ... 6 1.2 Purpose ... 6
2 AIM OF THE PROJECT ... 7
3 PROBLEM STATEMENT ... 8
4 PROJECT LIMITATIONS ... 9
5 THEORETICAL BACKGROUND AND SOLUTIONS METHODS ... 10
5.1 Introduction ... 10
5.2 Manufacturing Location Decisions ... 10
Step 1: Evaluating the Production Capacity ... 10
Step 2: Expansion or a New Facility ... 10
Step 3: Establish Facility Specification ... 11
Step 4: Identify Key Location Factors ... 14
Step 5: Site Selection ... 16
5.3 Defining general area of search ... 17
5.4 Selecting communities ... 18
5.5 Identifying sites ... 19
5.6 Final report ... 21
5.7 Evaluation of alternatives ... 21
5.7.1 The centre of gravity technique ... 22
5.7.2 Economic models ... 23
5.7.3 MCDA Methods ... 24
6 EMPIRICAL STUDY ... 36
6.1 Reasons for using interview technique ... 36
6.2. Interview results and comparison ... 36
7 APPLIED SOLUTIONS PROCEDURE ... 41
7.1 Facility specification ... 41 7.1.1 Capacity planning... 42 7.1.2 Layout ... 43 7.1.3 Organization chart ... 43 7.2 Factors ... 44 7.2.1 Market potential ... 45 7.2.2 Labour ... 47 7.2.3 Transportation infrastructure ... 47
7.3 Site selection stage... 48
7.4 Selecting a macro-region ... 49 7.5 Centre of Gravity ... 49 7.6 AHP ... 50 7.6.1 Pairwise comparison ... 50 7.6.2 Sensitivity analysis ... 52 7.7 Cost calculation ... 58 7.7.1 Packing cost ... 58
7.7.2 Transportation of assembled machines ... 59
7.7.3 Transportation of components ... 59
7.7.4 Assembly costs ... 59
7.7.5 Administration costs ... 60
7.7.6 Transportation cost from the new factory to customers ... 60
7.7.7 Cost analysis ... 61
8.1 Summary ... 62
8.2 Recommendations for the future work ... 63
9 REFERENCES ... 64
10 APPENDICIES ... 66
Appendix A: Site Requirements for a Proposed New Facility (Hack, 1999) ... 66
Appendix B: Results from the Interview with Company A ... 68
Appendix C: Results from the Interview with Company B ... 71
Appendix D: Factory Layout, 3 250 m² ... 74
Appendix E: Factory Layout, 7 150 m² ... 75
Appendix F: Map of Regions in Ukraine ... 76
Appendix G: Map of Regions in Russia ... 77
Appendix H: Center of Gravity ... 78
Appendix I: Values for X and Y coordinates ... 79
1 INTRODUCTION
1.1 Background
Väderstad Verken is a family firm, named after the Swedish village where it is based. The business was founded in 1962 by Rune and Siw Stark, who began manufacturing farming tools for local farmers in a small engineering workshop on their own farm. At that time their farm had some 30 hectares of arable land.
From this modest start, Väderstad has grown into a company with a staff of more than 600 people working in a very modern factory. At present, the company’s production facilities total 36,000 m², including covered storage areas. The company is still owned by the Stark family. Väderstad Verken has today about 100 employees which work outside of Sweden at eleven subsidiaries, which are located in England, France, Germany, Poland, Hungary, Estonia, Latvia, Lithuania, Ukraine, Russia and Australia.
The vision of the company is to become a global supplier benefiting farmers, co-workers, society and owners. The Väderstad’s business idea is to provide the modern agriculture with highly effective machines and methods.
Innovation occupies a central position in the corporate culture of Väderstad. The company has a strong track record of trailblazing approach to product development. Customer satisfaction and excellent customer relations are always high priorities at Väderstad. They have their sights set firmly on being one of the true market leaders in cultivation and seed drilling machinery. Väderstad’s role is to produce revolutionary machinery and tillage systems for farmers. Drawing on the experience of their customers as well as their own resources,
Väderstad’s mission is to continue to promote the rationalisation of arable farming methods in Europe, through sound design, innovation and invention.
1.2 Purpose
The purpose of this thesis is to recommend a list of factors which are important for the factory establishment abroad. Additionally, suitable areas for the factory start-up should be analysed based on the identified factors.
2 AIM OF THE PROJECT
Väderstad Verken is constantly developing and expanding its operations. In 2006, demand for Väderstad machines has been extremely high, which has led to a growth of over 30% within all markets and all product families. Some of the fastest growing markets were Ukraine and Russia. In 2007, for the first time in Väderstad history, sales in the Swedish market have been outperformed by sales in a single country outside of Sweden. According to the sales results of 2007, Russia became the biggest market for Väderstad Verken.
The Russian market is rather important for Väderstad Verken. In order to have a more strong position at this market as well as reduce risks associated with possible increase in import duties on such agricultural equipment as cultivators and drills management at Väderstad decided to analyse the possibility of starting-up a factory in Eastern Europe.
The aim of this project is to analyse two questions related to the factory start-up abroad. The first question is: What factors should be taken into consideration when establishing a factory in Eastern Europe? The answer to this question should provide a list of factors which are relevant for a factory to be built by Väderstad as well as analysis of the feasible locations for start-up in terms of meeting those factors.
The second question is: How big the factory should be? The answer to this question should specify what operations should be performed, what resources are required to perform those operations, and how should be arranged the plant’s layout and size.
Additionally, in order to get some practical experience the company was interested in
interviewing some international companies who already have production operations in Russia or Ukraine.
3 PROBLEM STATEMENT
Introduction of import duties on agricultural machinery by Russia can increase the sales price of Väderstad Verken machines and hence make them less competitive in the growing market. In order to secure its market position in Eastern Europe Väderstad Verken is considering an option of building a factory in Russia or Ukraine. However, the company does not have an experience of starting up production outside of Sweden. Study of the important factors for the factory establishment by Väderstad Verken would give the company a better understanding of this process. Further, analysis of suitable location for the factory would give an understanding for management on that how different location factors could effect the final choice of the factory location.
Below is a short summary of the most important activities during the project: Identify important factors for the factory start-up.
Analyse how the identified factors effect the choice of the suitable area for the factory location.
Create a specification of the future factory.
4 PROJECT LIMITATIONS
The limitations of the project are presented below.
We would analyse the optimal location of the future factory only in two countries – Russia and Ukraine.
The future factory is expected to supply markets in only three countries.
The location of potential suppliers will not be taken into consideration when analysing the optimal location.
Optimal location for a factory would be analysed only at the level of macro-region selection and will not include selection of a specific site due to time constraints.
5 THEORETICAL BACKGROUND AND SOLUTIONS METHODS
5.1 Introduction
In the current dynamic environment in which change is the only constant, businesses must analyse the production network. Hence companies must be flexible in order to respond in a timely manner to this dynamic environment. A company may start looking for a new facility location to meet one, several, or multitude of requirements. Among most common
requirements, Hack (1999) lists the need for expanded capacity for the development of new products, new markets, or the additional production capacity to satisfy existing markets. In some cases, a new location also may be required to place modernised production equipment, or to obtain higher efficiency and decrease operating costs that exist in the present outdated facility. Other reasons for changing location include taking advantage of unexploited supplies of raw materials or to get out of high labour cost regions. No matter what are the reasons behind the decision to build a new facility, most location studies involve the same critical factors. Consequently, management must have a well-defined plan for its overall location analysis program.
5.2 Manufacturing Location Decisions
Both Schmenner (1982) and Hack (1999) agree on that manufacturing location decision should be subdivided into the following five major steps which are represented below in Figure 1:
Figure 1: Steps in Manufacturing Location Decisions
Step 1: Evaluating the Production Capacity
Potential production shortfalls could be revealed in various ways and they significantly vary from corporation to corporation. Schmenner (1982) gives an example of that some large US corporations have implemented some formal planning system; one of the system’s purposes is to reveal possible shortfalls or surpluses. In order for the management to realize the first three above-mentioned steps, Hack (1999) recommends implementing a corporate strategic
planning procedure. The strategic plan should include several years, usually five, and describe the chronological growth of the company. The plan should be consulted with and included into any location process as an intricate part. This plan will often reveal many issues that might be ignored in the suggested expansion or relocation process.
Step 2: Expansion or a New Facility
Rather often, the process for identifying the need for a higher production capacity commences when management reveals a discrepancy when comparing production capacity to production goals and sales forecasts. Hence, if it is revealed that forecasts exceed production capacity, the
management has to evaluate different ways to reach the desired capacity in order to stay competitive.
Capacity shortfalls can be met in several ways. The short-term measures to meet the demand can include modification in workforce levels, overtime, additional shifts, inventory policies, modifications in production control, subcontracting, and planned backlogs. Long-term measures – additional floor space, fundamental changes in production technology or process management, and the like.
There are several factors that can effect the decision on whether to expand existing facilities or whether to construct a new factory. Typically, the first option for consideration is whether to expand existing facilities. Only if there are some limitations to or problems with the on-site expansion, management begins to consider start-up of a new factory or relocation of an existing one.
Schmenner (1982) points out that, generally, starting a new factory is favoured if problems obvious at the existing factory include product proliferation, workforce size, and meeting anticipated growth. He also mentions that the company which wants to avoid disorder as the result of too many products in process, or to side-step possible workforce unionization, job bumping, depersonalization in the quality of work life, and so on, or to get a grip of rapid growth through careful management of multi-plant strategy, frequently prefers opening a new factory to expansion. A new factory can take advantage of the latest production technology and the most suitable plant design.
Step 3: Establish Facility Specification
If management decided to build a new factory instead of the on-site expansion, a new suitable location must be found. Before proceeding with the search of a new location it is necessary to create a specification of the future facility. The main determinants of the size and layout of the proposed new facility are the operations that will be carried out at the factory and equipment that will be used during those operations. Thus, based on management’s goals and future plans, specifications for the new facility could be defined.
These specifications are usually stated in great detail. Among the most important specifications, Hack (1999) lists required area of the land plot, the utility requirements, transportation requirements for materials and personnel, waste disposal, water, and utility requirements. The list could be extended with additional factors that are unique to the operation of the proposed new facility.
Facility specification should define what the plant is intended to do. Schmenner (1982) specifies features that should be planned for in start-up, such as:
“products manufactured and output goals for the initial start-up period and beyond; plant size and configuration;
equipment to be used and flow pattern of product within the plant;
number of workers, sex and age, and skill levels required, in the initial months and as the plant is broken in during the first few years;
labour training that is required to meet the workforce goals;
stance toward the adoption of quality of worklife programs, from cross-training to job enlargement to team concepts;
how the plant must interact with other plants and/or warehouses, including supplies or products shipped, modes used, personnel borrowed for troubleshooting, and the like; overhead functions such as new product engineering, major raw materials purchasing,
direct receipt of customer orders, industrial engineering. Which of these will the plant be responsible for, and which functions it can and cannot expect to take over as it grows; how the new plant will be expanded subsequently and what will trigger that expansion
(sales goals met, new products introduced); what it would take to close the plant.”
In order to describe some of the above-mentioned features necessary to create a plant specification a good start would be to identify future plant capacity since it can help in estimating the number of required workers at the factory.
The foundation for estimating long-term capacity needs is forecasts of demand, productivity, competition, and technological changes that extend well into the future. Unfortunately, the father you look the more chance you have of making an inaccurate forecast.
The demand forecast has to be converted to a number that can be compared directly with the capacity measure being used. Suppose that capacity is expressed as the number of available machines at an operation. When just one product (service) is being processed, the number of machines required, M, is cusion desired deducting after year, per machine one from available Hours demand s year' for required hours Processing required machines of Number =
(
)
[
1 C/100]
N p D M − × × =Formula 1: Capacity Calculation (Krajewski et al., 2002)
where
D = number of units (customers) forecast per year p = processing time (in hours per unit or customers)
N = total number of hours per year during which the process operates C = desired capacity cushion
The processing time, p, in the numerator depends on the process and methods selected to do the work. Estimates of p come from established work standards. The dominator is the total number of hours, N, available for the year, multiplied by a proportion that accounts for the desired capacity cushion, C.
Once the number of workers required to perform operations has been identified it is possible to proceed with developing a facility layout. Plant size and layout depends on the products to be produced and operations to be performed at the new factory. There are three general types of layout for a facility: fixed position, process, and product. They are shown in Figure 2. Hybrid methods such as the cellular and modular layouts are becoming rather popular,
however, they will not be discussed in this paper. Type of industry significantly influences the final choice of a particular layout.
(a) Fixed Position Layout (b) Process Layout
(c) Product Layout
Figure 2: Types of Layouts (Stonebraker et al., 1994)
Stonebraker et al. (1994) define fixed position layout as the layout in which the location of a product or customer is unchanging and materials, equipment and workers are moved to and from the product or customer. This type of layout is typical for industries where the products are very massive or heavy, and it is difficult to move the product. Common examples are shipbuilding, aircraft assembly, rockets, oil drilling, and most construction projects.
In a process, machines with similar functions are positioned together. This type of layout is applied when the volume of the products to be manufactured is not big enough to justify product or cellular layout. The products or customers do not flow according to some
predetermined pattern. Some examples of this layout could be found in hospitals, universities, automobile repair shops, tailor shops, department stores, etc.
According to Nahmias (1997) in the product layout, often referred to as production or assembly line, machines are arranged to follow the sequence of operation necessary to manufacture the product. This type of layout is most desirable for high-volume production with standardised products or services. Manufacturing examples are automobile assembly and small appliances assembly.
The more carefully and accurately a company considers how a new plant will be utilised and modified over the years in response to various changes, the better able it will be to design the plant and its manufacturing systems especially for such changes. The plant then will be better
adjusted to the company’s requirements at every point in its useful life. A template which could be used for preparing facility specification is included into Appendix A For example, defining electricity and water requirements at the future factory is rather critical since access to them could effect the final choice of the location due to that access to power supply could be problematic and expensive both in Russia and Ukraine.
It might be beneficial to include in the project group of people with various expertises, for example, from personnel or marketing departments. In this way more aspects would be taken into consideration during the search of optimal location. This would also ensure that a wider range of expertise and interests is incorporated into the analysis since differences in the importance of the criteria relative to one another can change the results.
Step 4: Identify Key Location Factors
The final decision on site selection for a new facility is greatly influenced by the location factors that have been selected and evaluated, as well as by their influence on corporate objectives and operations. There are rather many location factors that have an impact on the final location choice. The extent to which these factors impact the location decision depends on the industry a company is working in. Additionally, the importance of factors varies greatly depending on the stage of the selection process. For example, the importance of factors for selecting certain region differs considerably from those influencing the selection of an individual site.
The location factors could also be addressed not only based on the uniqueness of industry type, but also based on facility type and product life-cycle stage. For example, for labour intensive industries labour related factors such as labour availability, productivity and salary rate are of major importance, whereas for high-tech industries factors that attract highly skilled labour force such as quality of life are of primary importance. The priority of factors for locating a new production facility would differ from that of locating a warehouse. As for the product lifecycle stages, during the product development stage, facilities are rather often located in major science centres where the high cost of facilities is justified by the timely introduction of new products. In contrast, after product reaches the growth stage, it is preferred to locate facilities in proximity to main markets to reduce transportation costs and delivery time.
The priority of location factors also differs at various stages of decision making process. At the beginning of the selection process only few critical factors, such as proximity to
customers, availability of labour or quality of infrastructure are taken into consideration. At the stage of selecting specific site, such factors as land price and availability or quality of utilities may have the major influence.
Location factors could also be divided into quantitative and qualitative categories. Jiaqin (1997) defines quantitative factors as those that can be measured in numerical values, such as the average monthly salary or transportation costs. Qualitative factors, such as attitude
towards foreign investment, quality of life or business climate, cannot readily be expressed in numerical terms and evaluated by quantitative models. Location selection decisions become more complex when qualitative factors are considered, because subjective judgments must then be adopted.
Many empirical studies and extensive research have been conducted on the relative
importance of the various location factors. MacCarthy et al (2003) report findings of a Delphi study on factors affecting international plant location decisions. During the study they
analyzed the importance of 13 major factors for international location decisions which are displayed in
Table 1. Cost was ranked highest, followed by infrastructure, labour characteristics, government and political factors, and economic factors. The study also showed that the ratings for the top four factors were very close to one another and all were rated relatively high. The two factors which were given the lowest priority were proximity to parent company’s facilities and proximity to competition. Further on MacCarthy et al (2003) investigated the importance of major sub-factors and identified the top ten sub-factors that may strongly influence international location decisions: quality of labour force, existence of modes of transportation, quality and reliability of modes of transportation, availability of labour force, quality and reliability of utilities, wage rates, motivation of workers,
telecommunication systems, record of government stability, and industrial relations laws. Additionally, it was mentioned during the study that the importance of factors and sub-factors can vary by geographical region and type of industry, hence, every company should develop own set of priorities.
Costs Infrastructure Labour charecteristics
Government and political factors Economic factors
Legal and regulatory framework Proximity to markets/customers Proximity to suppliers
Quality of life
Charecteristics of a specific location Social and cultural factors
Proximity to competition
Proximity parent company's facilities
5 6 7
1 2 3 4
Table 1: Key Factors Affecting International Location Decisions (MacCarthy et al, 2003)
According to Jiaqin (1997) five primary location factors include: location in relation to markets, material sources, transportation cost and services, availability and cost of utilities, and availability and cost of labour. In his opinion these primary factors often play the major role in determining the general search area, while other secondary factors help to determine a specific site location.
Hack (1999) discusses in great detail various location factors typically important in site selection process and provides information on data sources.
Schmenner (1982) provides an extensive checklist of factors which should be considered by manufacturing location decision makers. The checklist would be most useful for the stage of location search when suitable sites are identified. He also suggests dividing further the listed
factors into “musts” and “wants”. Under “musts” Schmenner (1982) implies those factors which are crucial for the site location, whereas “wants” could also be taken into consideration. In addition to the extensive checklist of important factors for site selection, Schmenner (1982) points out two considerations that are neglected sometimes during the selection process but which could have a big impact on the final decision. The first consideration is the
attractiveness of the new factory location for managers and engineers. During the selection process the primary focus is on costs, labour availability, infrastructure and the like, however, the attractiveness for living in an area is sometimes ignored or taken for granted. So a
company can end up in a situation when it is increasingly difficult to persuade managers or engineers to move there. This problem is most often faced by companies moving into small towns.
The second consideration is movement of people and material between facilities. Rather often the cost of interplant movement is ignored during the selection process. This can lead to higher logistics costs or more time spent travelling between plants. As the result, the amount of frequency of travel made to an inconveniently located facility can reduce and it will be left to operate without proper support from the head office or main plant. However, those
companies that do take into consideration executive/engineer travel time insist on locating the new facility in the proximity to the airport which has frequent flights to the head office or main plant.
Step 5: Site Selection
The previous paragraph shows that the amount of location factors that should be analysed could be overwhelming and different levels of site selection decisions are dominated by structurally different types of location factors. In order to simplify the complexity of location problem it is common to decompose it into several stages.
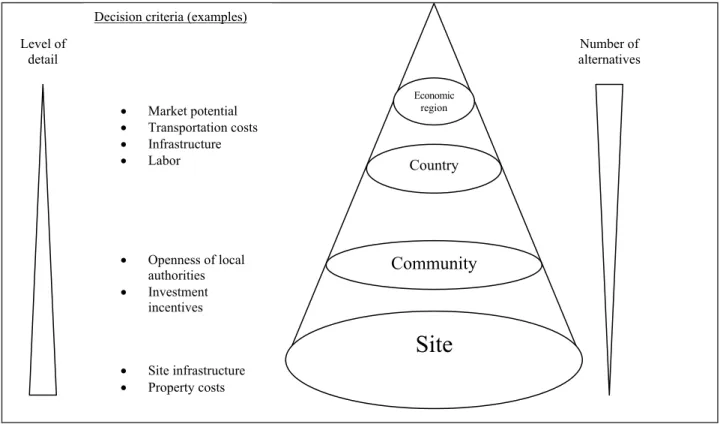
Many studies have been conducted to identify the necessary extent of location problem decomposition. Hack (1999), Vinh (2005), MacCormack(1994), Schmenner (1982), Hubner (2007), MacCarthy et al (1995) and Jiaqin (1997) mention in their works that problem should be broken down into three or four major levels. These levels are graphically summarised in Figure 3, which also shows major location factors relevant for each level.
Figure 3: Site Selection Decision Levels and Factors (based on Hübner, 2007)
At the level of selecting a country such factors as market potential, transportation costs, infrastructure and labour can dominate the decision. Selection of a community and physical site are mainly determined by quantitative factors such as site infrastructure and openness of local authorities, and to a certain extent local cost differences and site-specific investment requirements also effect the decision. As the site search proceeds, the number of alternatives is becoming smaller whereas level of detail about each alternative is increasing.
The amount of major steps for analysis depends on the area that the company is considering for site location. For example, if a company is considering a plant construction for its global operations that at first it will have to identify an economic region such as Eastern Europe, Western Europe, Asia-Pacific, or the like. However, if the company is planning to build a new factory in order to serve the domestic market, then it is possible to skip the first stage and start with the identification of macro-region.
Hack (1999) mentions that many location analyses do not require all major phases described in Figure 3 because the choice of the region, state or even community may be predetermined or based on many obvious factors.
5.3 Defining general area of search
The first stage of site selection is to define a general area of search. Size of this area maybe as large as an entire economic region, such as Middle East or Western Europe, or it may be as small as a few square kilometres or a single metropolitan area. Therefore, the more narrowly defined is the search area before beginning any field investigations, the more beneficial it is for the company because it can save both time and resources.
Community Country Economic region
Site
Level of detailDecision criteria (examples)
• Market potential • Transportation costs • Infrastructure • Labor • Openness of local authorities • Investment incentives • Site infrastructure • Property costs Number of alternatives
There is no rule of thumb for deciding on the optimum size of the general search area to be studied. According to Hack (1999) the following characteristics of the individual company would effect the size that should be investigated:
the company’s markets and where their sources of supply are located; which costs are geographically variable, and to what extent;
and whether or not there are any unusual community or site requirements which could eliminate many areas, and so on.
Hack (1999) recommends using Center of gravity approach (which would be described later in the paper) or least-cost distribution point method to identify the general area of search. As it was previously mentioned, Schmenner (1982) recommends creating a list of factors, “musts” list, which are critical for site selection. He also suggests that this list should be used as the standard against which alternatives for general area of search are evaluated. The list of possible factors at this stage is represented in Table 2.
Major factors for selection of general search area
Location in relation to markets
Location in relation to material sources Transportation cost
Availability and cost of utilities
Table 2: Major Factors for the Selection of Economic Area/Macro-Region (Hack, 1999)
By weighing the known characteristics of particular alternatives against this list, those
alternatives which are appropriate for the location of the proposed facility can be detected and supported. For example, if market potential is vital and 55%of the market growth is forecasted to be concentrated in Eastern Europe with the remaining 45% spread out over the rest of the world, it is more logical for the company to search for a new location in Eastern Europe. The market factor is usually of primary importance in the location process. However, it should not be assumed that the principal factors will be the only determinants in the selection of the general search area. A number of secondary considerations may enter into process. In addition to academic publications, publications directed primarily at practitioners faced with location decisions are available. Hack (1999) provides a comprehensive step-by-step approach to site selection. He proposes a planning process including an evaluation process based on a simple scoring model. Additionally, the appendix contains several checklists and survey questionnaires. Based on comprehensive empirical analysis Schmenner (1982) provides guidance on how to conduct location decisions for industry but also gives advice to states and localities on how to attract industry.
5.4 Selecting communities
After the optimal general search area is determined, it is possible to proceed with the site selection of communities within that area. The procedures and methods for the selection of communities will vary from one company to another. Hack (1999) lists common steps for selecting a community:
put together a list of communities in the search area; find data on location factors for each community;
eliminate communities obviously not suited;
investigate and evaluate remaining candidate communities;
select three or four final candidate communities that meet company’s requirements. The next step would be a more detailed analysis and examination of individual communities in the area of search that were previously identified. The basic objective in any location process is to select the specific community that will either maximize profits and/or minimize the cost of the product delivered to customers.
The choice of the final candidate communities for the location of a new factory can be effected by many different economic factors. It is impossible to create a single list of factors which would fit all situations. The factors which enter into this choice and their importance will vary from one company to another. Nevertheless, Hack (1999) proposes a list of some factors which could be applicable to many situations and businesses. These factors are listed in Table 3.
Community location factors
Local labor supply Local labor costs
Labor management relations Labor training programs
Transportation facilities and services Cost and reliability of electric power State and local taxes
Telecommunication services Adequacy of streets and highways Police protection
Fire protection
Recreation, parks, and civic facilities Natural gas cost and service
Cost and reliability of water service Adequacy of sewer system
Waste disposal
Health and medical services and facilities
Table 3: Major Factors for the Selection of Community (Hack, 1999)
The information about each community on every factor should be gathered with great care because it is critical for the evaluation process.
Hack (1999) recommends reducing the number of alternative communities through a preliminary screening which could be conducted in the company’s office with the help of published statistics. The number of qualifying communities could be significantly reduced if a company has location requirements of an unusual nature, for example, the need to locate near a university which offers certain type of degree; stable electricity supply; proximity to sea or river ports, etc.
5.5 Identifying sites
After several candidate communities have been identified, it is necessary to proceed with finding specific sites within those communities on which to construct the facility. The number of sites that are thoroughly investigated normally depends on time, cost, and inclination.
Schmenner (1982) advises to analyse thoroughly not more than 25 sites. He also mentions that it is common to have less than 10 sites for detailed evaluation. The list of particular sites within the communities could be refined through contacts with local development agencies, industrial realtors, developers, or similar people.
After filtering out unsuitable sites and identifying the most promising ones, it is possible to investigate the remaining sites even deeper. This would normally require putting together even more data about these sites, checking it, and combining it into a form which can be used to compare one site against another. Additionally, at this point in the process, site visits are usually made. Since quite much data is already available for each candidate location, the site visit is mainly a way to collect qualitative and subjective information and impressions about each location and to verify the data already collected.
Hack (1999) points out that there is a large amount of overlap for factors influencing the choice of a community and those used for the evaluation and selection of a site. Some factors are relevant mainly for choosing a physical site, whereas others are used in different ways, depending on whether a site or a community is being evaluated. The list of typical factors for site selection is presented in Table 4.
Factors of site investigation
Size and shape of site Topographic considerations Availability and cost of utilities Water supply
Sewer facilities Drainage and flooding Soil conditions Cost of development Location in community Transportation facilities Fire and police protection Taxes and insuarance
Zoning and other legal aspects Suitability of existing building Land costs and options
Table 4: Major Factors for the Location of Site (Hack, 1999)
Usually one or two sites will be found in a community that meets the company’s
requirements. The number of potential sites should be reduced even further, to a first choice and an alternate. Hack (1999) summarises all steps for the evaluation of alternative sites in the following way:
review the site requirements and identify the primary and secondary characteristics; find information on each requirement;
evaluate the data for sites, determining where additional information is needed; remove from the list sites that do not meet preliminary screening requirements;
make a second visit to the remaining sites to check specific problems and/or to address any questions;
review and evaluate all information, then select two or three sites that best meet the company’s needs;
As the result, the number of potential sites is narrowed down to a first choice and an alternative.
5.6 Final report
The recommendations and the final report to management normally conclude the site selection process. The final report should include information on the selection and
recommendation of the communities and sites that best meet the company’s requirements.
5.7 Evaluation of alternatives
Once all important factors for site selection have been identified, it is necessary to analyse them in some way. The analysis process could be complicated by that some factors are of qualitative nature while others are of quantitative. Additionally, some factors are of higher importance than others and this difference should also be taken into consideration during the analysis process.
Various location decision models have been developed to conduct comparative evaluation of potential location sites through examining related location factors and site requirements. In addition to traditional mathematical models (e.g. mixed integer programming and decision analysis), new solution methodologies have been applied in recent facility location research. Evaluation methods applied in the context of site selection can be generally grouped into optimization, Multiple Criteria Decision Analyses (MCDA), simulation and investment appraisal calculations. The suitability of these methods can depend on the stage of site selection, type of location factors (i.e. quantitative or qualitative), number of facilities under consideration, time horizon, etc.
In a word, the techniques used in the determination of the area of search are as numerous as there are location studies. However, as Jiaqin (1997) mentions, there are also limitations in the current location decision model literature. First, there are very few examples of application-oriented solution procedures that are convenient to handle large real-world problems. Second, the majority of reported location decision models do not take into consideration qualitative factors which could be critical for the location selection, especially at the site selection level. Finally, most reported location decision models are deterministic in nature and thus lack the dynamic solution capability necessary to deal with the fast changes in today’s location decision problems. In particular, the present location decision model literature lacks a framework that can present and structure all related location factors (both quantitative and qualitative) into a solution model and analyze these location factors with specific site requirements.
In this chapter I am going to present the techniques which in my opinion are both practical and comprehensive for the site selection. In particular, I am going to consider more
thoroughly such location analysis methods as center of gravity technique, some economic models, simple additive weighting, simple scoring, fuzzy logic, and Analytic Hierarchy Process (AHP). Some of these methods are more applicable at a particular location analysis stage, for example, center of gravity technique is most suitable for identifying general search area and economic models could be used to compare particular sites. Other methods such as fuzzy logic or AHP could be applied at all levels. The strengths and weaknesses of all models are analysed as well.
5.7.1 The centre of gravity technique
The center of gravity approach, sometimes referred to as centre of market approach, is rather common to use methods that analyse transportation costs and services in order to identify the general search area. The result of such an analysis could be either the geographic centre of distribution or the point at which transportation costs would be minimized. The group in charge of location selection process should investigate the cost of both inbound and outbound transportation, with some companies limiting their analysis to market distribution only. The latter situation usually is rather typical when shipment tariffs and total transportation costs are considerably higher for the final product than for the raw materials and components that are used to manufacture it.
This approach is rather valuable tool. However, companies using this simple technique in the identification of a general location should do it with care since the technique is intended as a rough guide rather than a precise tool.
The process of determining the center of gravity could be broken down into the following steps.
1. On a map draw a graph-type grid of an arbitrary scale. Place existing and/or future destinations of outbound and/or inbound transportation on a coordinate grid.
2. Prepare a table that has columns for (1) city/town name; (2) x-coordinates of a location on a map; (3) y-coordinates of a location on a map; (4) tonnage weights/quantity of shipments; (5) x units multiplied by tonnage weights; and (6) y units multiplied by the tonnage weights. Input relevant data into the corresponding column.
3. Based on the information provided for every location point, calculate the centre of gravity. The centre of gravity’s x-coordinate, denoted x*, is found by multiplying each point’s x-coordinate (xi) by its load (li), summing these products (∑xili), and then
dividing by the sum of loads (∑li). The y-coordinate, denoted y*, is found the same
way, with the y-coordinates used in the numerator. The formulas are
∑
∑
= i i i i i l x l x*∑
∑
= i i i i i l y l y*4. At this point locate the “optimal” distribution point on the map using weighted average x and y coordinates obtained in the 3rd step.
5. Hack suggests drawing a circle around the “optimal” location point to indicate general area of search. The size of such circle can vary, but in most cases a radius of 200 kilometres is appropriate. However, a smaller or larger area of search can be identified, depending on the amount of territory the location team believes it must explore in order to find the community that meets all of the company’s specifications. Strengths
Krajewski (2002) notes that the location point obtained though center of gravity approach is not the optimal one for the Euclidean or rectilinear distance measures, but it could be anyway an excellent starting point.
Criticism
The technique assumes cost is directly proportional to distance and volume shipped. In its simplest form, this method assumes that inbound and outbound transportation costs
are equal, and does not include special shipping costs for less than full load.
The centre of gravity method of location planning is accurate only when the quantities to be shipped to each location are equal.
5.7.2 Economic models
Some location problems could be solved by using traditional economic models such as payback, rate of return and benefit/cost ratio. These models are most applicable at the site selection stage because mainly at that level cost and benefits associated with each site could be identified.
Payback period
The payback method is commonly used to determine the relative attractiveness of investment at each site. The goal of this technique is to calculate how many periods are required to return an initial investment, that is cumulative benefits would equal cumulative costs. Costs and benefits are normally expressed as cash flows or discounted present values of cash flows. Once it has been determined for all site alternatives under consideration, a comparison is made on the basis of corresponding payback periods. The smaller the payback (period), the more preferred is the site.
Geng (2004) provides the following formula for the calculation of (undiscounted) payback of value N*:
∑
= = * 1 N j j A Pwhere P is the initial investment and Aj is the cash flow in period j. Discounted payback,
which is used less often, is calculated as follows:
∑
= − + = * 1 ) 1 ( N j j j i A P Strengths Payback is a useful tool to obtain some indication of how long time it might take to recover the initial investment. It is a helpful supplementary measure of the attractiveness of the investment, but it should never be used as the sole measure of quality.
Criticism
The main drawback of the payback is that all cash flow beyond the end of the payback periods is ignored.
Rate of return method
The internal rate of return (IRR), or the rate of return (RoR), is the interest rate i* at which the present value of all expenditures are equal to the present value of all earnings. One
mathematical definition of the IRR, given by Geng (2004), is the rate i* that satisfies the equation 0 ) 1 ( 0 * ≡ +
∑
= − N j j j i AThis formula assumes discrete cash flows Aj and end-of-period discounting in periods j = 1, 2,
…, N.
The discount rate used in present value calculation is the opportunity cost – a measure of the return that could be earned on capital if it were invested in other projects. Thus a given site candidate should be economically attractive if and only if its IRR exceeds the cost of
opportunities forgone as measured by the firm’s minimum attractive rate of return (MARR). Geng (2004) notes that mutually exclusive projects may not be rank-ordered on the basis of their respective IRRs. Rather, an incremental procedure must be implemented. That is, alternatives must be compared pairwise, with decisions made about the attractiveness of each increment of investment.
Benefit/cost ratio
In the benefit-cost ratio method present value of benefits and present value of costs are calculated and compared. An investment is justified only if the benefits B resulting from it exceed the resulting cost C. Obviously, all benefits and costs must be expressed in equivalent terms, measured at the same point(s) in time. Geng (2004) mentions that usually, both benefits and costs are expressed stated as “present value” or are “annualized” by using compound interest factors as appropriate. Thus,
cost" " all of AW) (or PW benefits" " all of AW) (or PW :C = B
The site that has the highest ratio should be selected. However, Geng (2004) warns that like the rate of return method, the proper use of the benefit-cost ratio method requires incremental analysis. Mutually exclusive alternatives should not be rank-ordered on the basis of benefit-cost ratios. Pairwise comparisons are necessary to test whether increments of benefit-costs are justified by increments of benefits.
Even though these methods are simple and practical to use, however they have some
drawbacks when it comes to comparing various location alternatives. The major drawback of these economic models is that they take into consideration only factors which could be measured in terms of money. However, some important qualitative factors, such as proximity to highway or attitude of the local authorities, are ignored even though they could be rather critical for the location decision. The solution for this drawback could be to apply economic models together with some other models (further described in this paper) which take into consideration qualitative factors.
5.7.3 MCDA Methods
As it was previously discussed the number and diversity of sometimes conflicting location factors that have to be considered when selecting production site could be overwhelming. This situation makes obvious the need to apply a systematic decision support tool. Studies in the subject of Multiple Criteria Decision Analysis (MCDA) aim at providing tools that guide decision makers in identifying their most preferred solution to such a decision problem. Hubner (2007) notes that the evaluation of potential sites is part of Multiple Attribute Decision Analysis (MADA), which is one of the two types of multiple criteria decision
situations. In this paper we are going to cover several MADA methods: simple additive weighting, fuzzy logic, and analytic hierarchy process.
Simple additive weighting and simple scoring
Simple additive weighting and simple scoring are probably the most widespread MADA methods in practice. Application of simple additive weighting/simple scoring requires five steps which are shown in Figure 4:
Figure 4: Simple Additive Weighting/Simple Scoring Steps
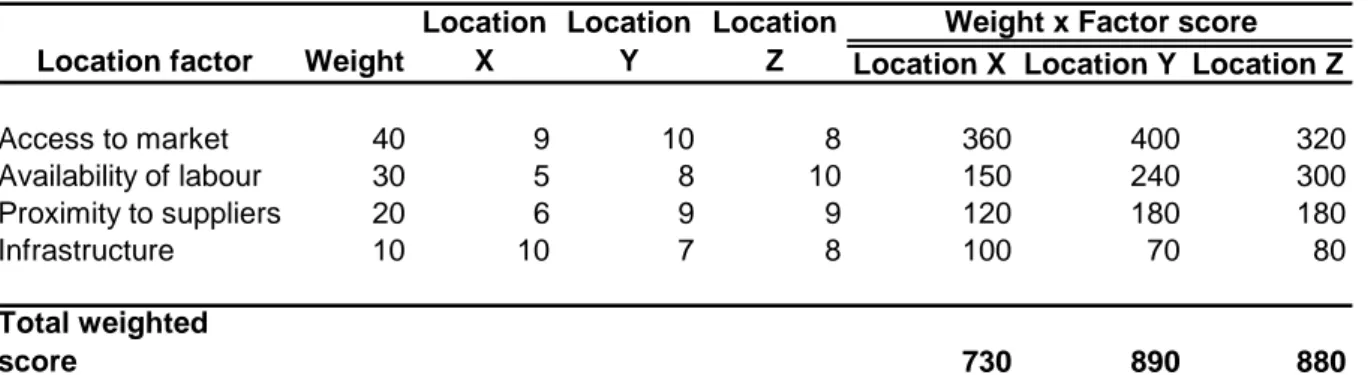
The two methods only differ in the third step. Simple scoring uses a standardized interval scale (e.g., 0 -100) for evaluation of all objectives. At first decision makers rate each of the major factors from 0 to 100 relative to its importance, and then they directly rate the performance of each individual location with respect to each factor on this scale. Simple additive weighting, on the other hand, uses direct rating on a standardized scale only in case of purely qualitative attributes. For numerical attributes scores are calculated by normalizing observed attribute values to match the standardized scale.
Location X Location Y Location Z
Access to market 40 9 10 8 360 400 320 Availability of labour 30 5 8 10 150 240 300 Proximity to suppliers 20 6 9 9 120 180 180 Infrastructure 10 10 7 8 100 70 80 Total weighted score 730 890 880
Weight x Factor score Location
X Location factor Weight
Location Y
Location Z
Table 5: Simple Additive Weighting
Location Y in Table 5 has the highest total weighted score and therefore should be selected. However, in this example two best sites, locations Y and Z, have rather small difference in scores (10 points) so it might be necessary to have further investigation. For example, additional location factors could be included for further evaluation of these two sites.
Alternatives could be compares using two different types of scales: local and global. Hubner (2007) describes that a local scale is outlined with the best and worst existing alternatives forming the reference point for the bounds of the scale while a global scale is outlined relative to absolute values for the best and worst performance. He points out that local scales are easier to express whereas global scales allow the decision maker to define objective weights independent of observed attribute values.
It is obvious that the scoring received by this method is largely subjective because when the factors are evaluated, they express a decision maker’s feelings that are measured in terms of assigned weights. It is quite possible that different decision makers might choose varying scores for the same physical conditions, leading to entirely different site selections. To avoid
such variations in judgment Sule (2001) recommends using certain minimum requirements to eliminate non-qualifying location and then apply economic models for the comparison of remaining sites. He claims that it is possible to apply economic models because most factors such as land, labour, utility, and taxes could be quantified in monetary terms.
Hubner (2007) mentions another extension to the basic model. He suggests constructing an explicit value function to convert observed attributes into preferences values, instead of directly scoring alternatives on a normalized scale or assuming a linear correlation between attribute values and decision makers’ preferences.
Strengths
The key advantages of simple weighting/scoring are simplicity of application and
understandability. The rating procedure requires numerical rating values as an input from the evaluators and then a simple sum or arithmetic mean is all that is needed for assigning the final ranking.
No previous training is required to conduct the decision making process. A decision-maker can simply use personal judgment and the knowledge of the problem to come to a conclusion.
The evaluation itself does not require special software packages but can be performed with standard spreadsheet software.
Criticism
The scoring rating model is rather basic and subjective and can solve only those problems that are direct and simple.
The method can not accurately measure the relations between factors, if there are too many subjective factors involved.
It is not possible to perform consistency check on the decision maker’s inputs. The ability to check consistency is especially critical if there is more than one decision maker
involved in the scoring process.
Sometimes, there might be some outliners in ranking, and such judgment might be critical. In this method, there is no means to include or measure these outliners because only the mean value is of importance.
Besides the general criticism of additive aggregation models Hubner (2007) mentions that the most criticized aspects about these simple methods are the fact that the direct scoring of alternatives and direct estimation of weights often lead to results that lack an argumentative justification and the resulting preference values lack an economic interpretation.
Fuzzy logic
Location analysis could also be conducted with the help of fuzzy set theory. As it was previously described many factors should be analysed when selecting a location for a new facility. Sule (2001) divides these factors into three classes: critical, objective, and subjective. The factors that each location must meet for further evaluation belong to the critical criteria. The objective factors can be expressed in monetary terms such as the investment cost, labour cost, and land cost. The subjective factors such as, for example, climatic conditions and availability of skilled labour, are qualitative.
It is not difficult to evaluate objective factors since they can be easily expressed in terms of numbers. Subjective factors, on the other hand, are expressed in qualitative terms and hence
they are more difficult to analyse. It is possible to convert these qualitative evaluations into quantitative ones using the fuzzy set theory. After the conversion it is possible to evaluate the contributions of the subjective factors in an effective way.
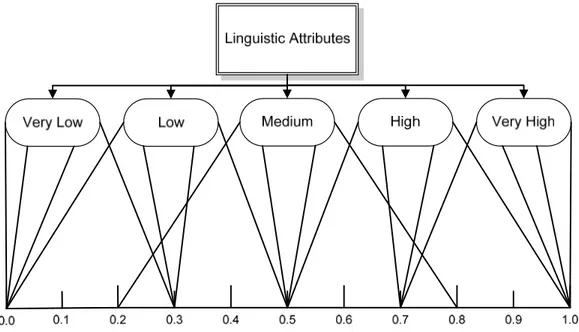
Sule (2001) notes that the subjective criteria are generally expressed in terms of “very low”, “low”, “good”, “very good”, “medium”, “high”, and the like. With the fuzzy set theory, these are converted to quantifiable evaluations that generally take a triangle or a trapezoidal shape with different weights, which are provided in Figure 1Figure 5 and Table 6.
Figure 5: Weights of the Linguistic Attributes for Criteria (Sule, 2001)
Linguistic attribute Numerical weight
Very low (0, 0, 0, 0.3)
Low (0, 0.3, 0.3, 0.5)
Medium (0.2, 0.5, 0.5, 0.8)
High (0.5, 0.7, 0.7, 1)
Very high (0.7, 1, 1, 1)
Table 6: Fuzzy Set Weights (Sule, 2001)
For example, from Table 6, “high rating” has 0-0.5 weight in decision making. So if four payoff values for the high rating are 600, 650, 700, and 850 then in trapezoidal terms it is interpreted as, high of 600 with the weight of 0.5, first midpoint of 650 with the weight of 0.7, the second midpoint with the payoff 700 with the weight of 0.7, and the maximum payoff of 850 with the weight of 1. It is easy to interpret the trapezoidal fuzzy set numbers. For
example, “approximately equal to $600” may be represented as (595, 600, 600, 605),
“approximately between $600 and $650” may be represented as (595, 600, 650, 655), and the non-fuzzy numbers such as $700 can be represented as (700, 700, 700, 700). Thus, in
linguistic description, each attribute – such as “high rating” – has a four-point trapezoidal distribution. The weight distribution is 0.5, 0.7, 0.7, and 1. A composite trapezoidal distribution should be developed for all subjective factors.
In applying the fuzzy logic technique, the first step is to divide the criteria (denoted by Ci)
high (H), medium (M), low (L), or very low (VL) to each site criteria. If there is more than one decision maker involved then each decision maker (denoted by D1, D2, D3, and D4) is asked to assign a linguistic rating to each factor, both subjective and objective factors, and to display their subjective and objective factors, and to display their subjective evaluation of importance of each factor. The linguistic rating from each decision maker is aggregated for each criterion.
Next, the decision makers should evaluate each criterion, relative to each possible location. Note that it is possible to give a rating in between two major weights such as BP and VP meaning between poor and very poor. The categories and associated four-point numeric values are shown in Table 7.
Linguistic attribute Numerical weight
Very low (0, 0, 0, 0.2)
Between low and very low (0, 0.2, 0.2, 0.4)
Low (0, 0.2, 0.2, 0.4)
Between medium and low (0, 0.2, 0.5, 0.7)
Medium (0.3, 0.5, 0.5, 0.7)
Between high and medium (0.3, 0.5, 0.8, 1)
High (0.6, 0.8, 0.8, 1)
Between very high and high (0.6, 0.8, 0.8, 1)
Very high (0.8, 1, 1, 1)
Table 7: Weights for the Extended Fuzzy Set Rating (Sule, 2001)
Following the same procedures as before, the lower, mid-two, and upper bound-weight values for each location and for each associated criterion are determined.
The next step should be evaluation of objective criteria such as, for example, cost. It is not necessary to involve decision makers into evaluation of different costs because they could be obtained through market research. Just as we did with the subjective criteria, we should obtain four cost estimates in terms of their numeric value for each site. It is advisable to convert the total cost into a dimensionless form so that the objective criteria becomes consistent with the subjective criteria. The evaluation is needed in terms of cost distribution for each site and comparing the sites with each other. It should be kept in mind that the alternative with the lowest cost should get the highest rating, since the lower the cost the more attractive is the alternative. To accomplish this objective Sule (2001) recommends to converse the data for each site i in the following way.
[
]
{
1 1}
1 2 1 1 ... − − − − + × = i m ti t t t t Rwhere t1, t2, t3 are the cost of factors, 1, 2, 3, each with four estimates, and ti is the sum of the
costs for the factors at appropriate levels.
Since when Rti, relative total cost, is calculated we converse each sum in the same way, the
relative weights between the sums will not change. However, since the cost should be transformed into relative ranking, the site with the highest cost would get a worse rank than the site with the lower cost. Hence, a random number that is greater than the largest number in the cost distribution is picked and then it is divided by each cost. As the result we will obtain a ranking in which the alternative with the highest value is the best option.
Sule (2001) writes that “to find fuzzy suitability index FI for site i the average of the product
of weight for each criterion times the relative weight of that criterion for site i should be found. This is given by:
(
) (
) (
)
(
)
[
i i i in n]
i S w S w S w S w
k
F = 1× 1 × 1 + 2 × 2 + 3 × 3 +...+ ×
where k is the number of factors that are being evaluated”. Sule (2001) summarizes steps in fuzzy analysis as follows:
1. Identify criteria and candidates for site selection. 2. Select preference ratings for criteria weight.
3. Select preference ratings for alternative sites for both subjective and objective criteria. 4. Chart the weighing of subjective criteria and group them to obtain the aggregate
weight, for each criterion.
5. Compute the fuzzy ratings of alternative sites for subjective criteria. 6. Compute the fuzzy ratings of alternative sites for objective criteria.
7. Aggregate the weightings of criteria and fuzzy ratings of alternatives relative to all criteria and obtain the fuzzy suitability indices.
8. Compute the ranking value of each alternative and choose the alternative which obtained the highest rank.
Sule (2001) argues that “fuzzy set theory is capable of handling situations that involve decision criteria that are of an intangible nature. The concepts of fuzzy numbers and logistic variables are used to evaluate objective and sub-objective factors in such a manner that the viewpoints of an entire decision-making body can be expressed without any constraints. The fuzzy set of decision algorithm used for site selection can also be computerised to make the implementation a little easier”.
Strengths
The amount of factors that could be analysed is not limited since the amount of factors does not greatly influence the difficulty of the analysis.
There are many words that could be used to define the exact rating feeling of an
alternative so it gives the decision maker a large range of scales from which to choose the description of subjective criteria.
The concept of membership sets allows a large amount of information to be represented in a single construct for logical or algebraic manipulation.
Criticism
It is not possible to identify inconsistency in the judgment.
If there is more than one decision maker involved, the individual inconsistencies would contribute toward the total inconsistency, which is the geometric function of individual consistencies.
In order to use fuzzy set theory for solving a problem, however simple, it is necessary to have a complete understanding of the theory itself. This overshadows the capability of the theory to solve complex problems, because an evaluator or decision maker must be trained to use this method.
Even though it is possible to develop an algorithm for the fuzzy set problem and then computerize it, this could be sometimes rather expensive.
The assessment process has to lead to a rank ordering of the alternative sites and a
recommendation of where to locate the plant. Once the alternatives have been assessed, again management has to select the preferred site and approve the implementation project.
Analytic Hierarchy Process
The Analytic Hierarchy Process, developed by Saaty, is one of the most widespread MADA tools. Case examples reporting the use of AHP in (plant) location decisions can, for example, be found in Min and Melachrinoudis (1999), Yang and Lee (1997), Kathawala and
Gholamnezhad (1987), Yoon and Hwang (1985b) or Wu and Wu (1984).
Jiaqin (1997), Hubner (2007), and Badri (1998) mention that the application of AHP should be conducted at several stages.
Figure 6 represents the major AHP steps that have been described by the aforementioned researchers.
Figure 6: Major AHP Steps
Step 1: Hierarchical break-down of the decision problem
The first step of the AHP is to analyze a decision problem by hierarchically breaking it down into several components and identifying the alternatives that are to be evaluated. Hence, the hierarchy would consist of the overall goal, objectives and one or more levels of
sub-objectives. The alternatives that will be evaluated are listed at the lowest level of the hierarchy. In order to understand better the overall problem, it is recommended to draw a graphical representation of the hierarchy similar to the one presented in
Figure 7 below. The final figure would vary depending on the amount of objectives, sub-objectives and alternatives to be considered. The first level of the hierarchy depicts the overall goal; the second level represents the objectives that would contribute to the achievement of the overall goal, and at the last level each alternative would contribute to each objective in a unique way.
Figure 7: Decision Hierarchy
According to Saaty (1980) the maximum amount of elements in a cluster should not be more than 7 because results from psychological tests show that 7+/-2 are the maximum number of elements a person can effectively compare simultaneously.
Step 2: Comparative analysis of objectives and alternatives
Comparative analysis should be conducted in the second step. Forman et al (2001) recommends evaluating the performance of the alternatives with respect to the objectives before evaluating the priorities of the objectives. In his opinion, by applying this “bottom up” approach a decision maker can get a better understanding of the alternatives in case his/her judgments about the importance of the objectives are dependent on the alternatives. Each alternative should be compared against other alternatives with respect to one particular decision objective at a time. Since one assumption of the AHP is that the evaluations are reciprocal and since all elements will always rank equally when compared to themselves, it is
required to perform 2 ( 1)
1 −
n n
comparisons to make the full set of pairwise judgments for n criteria or alternatives. Hence, a typical comparison might look in the following way:
⎥ ⎥ ⎥ ⎦ ⎤ ⎢ ⎢ ⎢ ⎣ ⎡ 1 3 1 9 5 1 3 1 9 1 5 1
Forman et al (2001) mentions that research has shown that pairwise comparison can generate correct, ratio scale priorities from what are basically rough, ordinal judgments, given that redundant judgments are included in the calculations. In his opinion, redundancy helps to minimise the average effect of errors in a manner analogous to the way that taking the average of a sample of measurements will produce an estimate of the mean that is likely to be closer to the true mean than only one judgment (i.e. no redundancy). Table 8 represents a 9-point ratio scale that Saaty has developed for the pairwise comparison.