PROCEEDINGS FROM SCIENTIFIC CONFERENCE ON GREEN ENERGY AND IT in connection with Energitinget at Alvsjo Fair, Stockholm, March 12-13, 2008
Editor: Erik Dahlquist, Malardalen University, Sweden
Scientific session on Energy saving and Green energy Chairman: Erik Dahlquist, Mälardalen University
1. Investigations on CO2 absorption using amine solvents in hollow fiber membrane contactors by experiments .Yuexia Lv1, Xinhai Yu1*, Shan-tung Tu1, J. Yan2, E.
Dahlquist2,School of Mechanical and Power Engineering, East China University of Science and
Technology, Shanghai, 200237, China; 2. Dept. IST, Mälardalen University, Västerås, Sweden
2. Intensification of transesterification for synthesis of biodiesel using microchannel reactors. Zhenzhong Wen1, Xinhai Yu1*, Shan-tung Tu1, J. Yan2, E. Dahlquist2 1. School of
Mechanical and Power Engineering, East China University of Science and Technology, Shanghai, 200237, China; 2. Dept. IST, Mälardalen University, Västerås
3. Continuous bioethanol production by fermentation. Bernt Lie, Juan I. Videla.Telemark University College, Porsgrunn, Norway
4. Optimization and Economic Analysis of Marnoch Thermal Energy Conversion System, C.C. Chukwu1, G.F Naterer2, M.A. Rosen3, E. Dahlquist4 I.A Marnoch5 ,1,2,3,4 University of Ontario Institute of Technology, Oshawa. Ontario, Canada, 4 Malardalen University, Vasteras Sweden, 5 Marnoch Thermal Power Inc. Toronto, Ontario, Canada,
5. Analysis of the coal based polygeneration system of hybrid type Guoqiang Zhang1,2, Lin GAO1, Hongguang JIN1,* 1 Institute of Engineering Thermophysics, Chinese Academy of Sciences
6. Power transformer parameters identification using extended kalman filter Kourosh Mousavi Takami, TDI researcher and phd student in Malardalen University ,Jafar Mahmoudi , Erik Dahlquist, Malardalen University
7. An advanced energy saving method for Aluminium - iron - copper bonding using explosive welding. Mohammad Tabatabaee. TDI institute, Teheran, Iran and Mälardalen University
Scientific session on Energy savings in houses Chairman: Jurek Pyrko, Lund University
8. Design of hot water user profiles for Swedish households based on time
diaries.Magdalena Lundh, Ewa Wäckelgård, Kajsa Ellegård. Department of Engineering Sciences The Ångström Laboratory Box 534
751 21 Uppsala, Sweden
9. Modeling Household Electricity Load from Time-Use Data. Joakim Widén, Kajsa Ellegård och Ewa Wäckelgård. Department of Engineering Sciences,Solid State Physics,Uppsala
University
10. Investigation of electricity consumption in single houses with electrical heating alone and together with complementary heating systems. Cajsa Bartusch, Fredrik Wallin, Erik Dahlquist, Mälardalen University.
11. Differences in electricity and hot water consumption in apartments of different sizes. Iana Vassileva, Cajsa Bartusch, Erik Dahlquist. Mälardalen University.
12. Novel Architect Designs Energy-Saving Iranian Homes. S.M. Esmail Mousavi-Takami, TDI Technical Development Institute, Teheran, Iran
13. Inform me please! - Energy use information to households and Demand Response. Jurek Pyrko, Energy Sciencees, Lunds University
14. "Consumers, energy and IT. IT and other tools to support efficient energy consumption"
I.C. MariAnne Karlsson
Chalmers University of Technology, Product and Production Development
15. Influence of Residential Ventilation on Radon Mitigation with Energy Saving emphasis Keramatollah Akbari, Mälardalen University and TDI in Teheran, Iran
1
166.. Extracting alumina from bauxite ore in jajarm factory process simulation using aspen software
Mohammad Farrokh and Jafar Mahmoudi, Mälardalen University and TDI in Teheran, Iran 17. Description of techniques for hot spot monitoring and detection in power transformers
Hassan gholinejad, Kourosh Mousavi Takami and Jafar Mahmoudi, Mälardalen University and Tanesh Company, Iran
18. Payam
yuexialv@gmail.com; zzwen@mail.ecust.edu.cn; Bernt.Lie@hit.no; Cletus Cletus.Chukwu@uoit.ca; sttu@ecust.edu.cn; kourosh.mousavi.takami@mdh.se; mohammad.tabatabaee@yahoo.com; Magdalena.Lundh@angstrom.uu.se;
joakim.widen@angstrom.uu.se; cajsa.bartusch@mdh.se; iana.vassileva@mdh.se; architecttakami@yahoo.com; jurek.pyrko@vok.lth.se; mak@chalmers.se;
1. EXPERIMENTAL INVESTIGATION ON CO2 ABSORPTION USING
ABSORBENT IN HOLLOW FIBER MEMBRANE CONTACTOR
Yuexia Lv1, Xinhai Yu1*, Shan-Tung Tu1, Jinyue Yan2,3, Erik Dahlquist2
1. School of Mechanical and Power Engineering, East China University of Science and Technology, Shanghai, 200237, China
2. School of Sustainable Development of Society and Technology, Mälardalen University SE-721 23 Västerås, Sweden
3. School of Chemial Science and Engineering, Royal Institute of Technology SE-100 44 Stockholm, Sweden
2. Dept. IST, Mälardalen University, Västerås, SE-721 23 Sweden Email address: yxhh@ecust.edu.cn
ABSTRACT
Carbon dioxide absorption from nitrogen and carbon dioxide mixture has been investigated by experiments using deionized water and low concentration amine solvents including
methyldiethanolamine (MDEA) and monoethanolamine (MEA) in polypropylene (PP) hollow fiber membrane. A relatively low solvent concentration of 0.05 mol/l MEA and MDEA was used in the experiment. The dependency of CO2 removal efficiency and mass transfer rate on
operating parameters were studied which include the mixed gas flow rate, the volume
concentration of CO2 at the feed gas inlet, liquid flow rate as well as concentration of absorbents
using lower absorbent concentration. It has been found that the CO2 removal efficiency increases
with the increase of the liquid flow rate and solvent concentration, while the CO2 mass transfer
rate increases with the increase of liquid flow rate, CO2 volume fraction in the feed gas, solvent
concentration and gas flow rate. It has been concluded that the absorbent concentration should be compromised between absorption efficiency and the membrane wetting to ensure a stable and efficient removal of CO2 with a long life of the hollow fiber membrane. It was observed by the
experiments that a long operation period may lead to partial membrane wetting even when using relatively low solvent concentrations, resulting in a significant decrease of membrane absorption performance, which might be a main drawback for industrial applications with the studied membranes and solvents.
1. INTRODUCTION
The CO2 emissions are mainly contributed by power generation and transport sectors. CO2
capture and storage (CCS) has been recognized as one of the approaches for mitigating greenhouse gases. Current CO2 capture systems includes post-combustion capture, oxy-fuel
combustion capture and pre-combustion capture, which make it possible to capture CO2 from
large, centralized sources like power plants and large industries (IPCC, 2005). CO2 capture from
flue gases produced by fossil fuels combustion is referred to as post-combustion capture, which is corresponding to the most widely applicable option in terms of industrial sectors and is compatible to a retrofit strategy.
At present, a wide variety of technological options have been used to capture CO2 from flue
gas of power plants, such as chemical and physical absorption, solid adsorption, cryogenic distillation, and membrane techniques (Mandal et al., 2006; Moon et al., 2006; Andrea Corti et al., 2004). This paper is focused on the membrane techniques for the CO2 capture. Membrane
gas absorption technology is a hybrid technology that combines membrane separation
technology and chemical absorption technology with advantages of both membrane contactor and solvent absorption processes. The principle of a membrane contactor is schematically shown in Fig. 1. Instead of depending on the membrane selectivity, the liquid flowing in a hollow fiber contactor provides the selectivity and the unselective membrane only acting as the physical barrier between the liquid and gas phases. CO2 is absorbed in the membrane contactor when the
gas stream contacts with the liquid phase flowing on the opposite side of the membrane. Gabelman and Hwang (1999) studied the advantages and disadvantages of a membrane contractor in details. Compared to conventional absorption devices such as packed towers or bubble columns, the membrane contactor has advantages (Falk-Pedersen et al., 2000), such as • the gas and fluid phase can be manipulated independently avoiding the problems such as
flooding, foaming, channeling and entrainment which are commonly encountered in conventional absorption devices;
• compact structure, high specific surface area and less voluminous is less energy-consuming; • the modularity of membrane modules makes the design simple and easy to be scaled up
linearly with predictable performances .
Even though the mass-transfer coefficient of the membrane contactor is inferior to the conventional devices for the flow of gas and liquid are normally laminar where the turbulent flow is power-consumption, the membrane gas absorption due to its large interfacial area, is still considered as one promising alternative to conventional and potential large scale application technology for CO2 recovery and removal (Li et al., 2005).
Fig. 1. Schematic drawing of CO2 absorption in a hollow fiber membrane contactor.
Zhang and Cussler (1985) were the pioneers who proposed the idea of CO2 absorption by
sodium hydroxide in a hollow fiber membrane contactor. In recent years, hollow fiber membrane technology has been extensively studied. Various liquid absorbents including pure water and aqueous solutions of NaOH, KOH, monoethanolamine (MEA), diethanolamine (DEA), 2-Amino-2-mechyl-1-propanol (AMP), N-methyldiethanolamine (MDEA), CORAL and the potassium salt of glycine and taurine were used as absorption liquids in polyethylene (PE) or polypropylene (PP) or polytetrafluoroethylene (Teflon) microporous hydrophobic hollow fiber membrane contactors, in which the MDEA and MEA aqueous solutions in PP hollow fiber membrane contactor are the most widely used for CO2 absorption (Kumar et al., 2002; Kim et
al., 2000; Mandal et al., 2001). Compared with other fibers, PP fibers are less expensive and commercially available in a wider size range. Wang et al. (2004) performed a theoretical
simulation to study CO2 absorption using three typical alkanolamine solutions of AMP, DEA and
MDEA in a hollow fiber membrane contactor. The effects of operating parameters, membrane configuration, module structures and different solvents on absorption flux and removal efficiency were investigated. Lu et al., (2007) studied the effects of activators
2-Amino-2-mechyl-1-propanol (AMP) and piperazine (PZ) on mass-transfer enhancement using MDEA alkanolamine solutions in a hollow fiber contactor and concluded that the mass transfer fluxes of the activated MDEA solutions are significantly higher than that of MDEA solution and effects of operation conditions on mass-transfer enhancement are limited. Theoretical simulations and corresponding experiments were carried out to describe the CO2 absorption by distilled water and aqueous
diethanolamine (DEA) solutions for better understanding of CO2 absorption in a hollow fiber
membrane contactor (Zhang et al., 2006). A theoretical model was developed based on CO2
absorption simulation by water and DEA under the wetted and the non-wetted operation modes to study the influence of membrane wetting on CO2 capture in microporous hollow fiber
membrane contactors (Zhang et al., 2007). Matsumiya et al. (2005) developed a novel facilitated transport membrane system where the feed gas and aqueous diethanolamine solutions were supplied to the lumen side of the hollow fiber ultrafiltration membrane module with an upward
flow. In addition, they evaluated the energy consumption and compared with conventional separation processes. Liu et al. (2005) examined the mass transfer performances using coiled hollow fiber membrane modules. Their results showed that coiled hollow fiber modules can remarkably enhance the mass transfer compared with conventional straight module. Most researches were limited to atmospheric pressure applications using aqueous absorption solvents, so CO2 absorption in propylene carbonate at elevated pressure using hollow fiber membrane
contactor was investigated by Dindore et al. (2004). The results showed that the decrease in the binary gas phase diffusivity and hence the membrane mass transfer coefficient due to gas pressures increase does not have a significant impact on the overall mass transfer coefficient.
As mentioned above, a variety of experiments and simulations have been carried out to study the membrane absorption performance using different kind of solvents in the hollow fiber membrane contactor. The solvent concentration used by most researches was varied from 1mol/l to 3mol/l. However, it was reported that the surface tension of most absorbent solutions
significantly decreases with increasing solution concentration (Vázquez et al., 1997; Rinker et al., 1994), which resulted in PP membrane wetting according to the Laplace-Young equation (Franken et al., 1987), thus reducing the membrane performance. According to Laplace-Young equation, lower solvent concentration can reduce membrane wetting and prolong the membrane service life.
In this paper, the effects of operating parameters on membrane absorption performance using solutions of relative low concentration were investigated in the pilot-scale hollow fiber
membrane module. The wetting phenomenon of PP membrane, which is often neglected in reported studies, was also observed in prolonged operation. In addition, the optimal operating parameters were obtained for the specified membrane module.
2. EXPERIMENTAL
The experiments were performed to obtain the operating parameters effect on the absorption using deionized water and MEA and MDEA aqueous solutions of low concentration as the absorbent in a PP hollow fiber membrane contactor.
Table 1. Specifications of the hollow fiber membrane module Parameter Value
Module outer diameter (mm) 50
Module inner diameter (mm) 42
Module length (mm) 360
Fiber inner diameter (μm) 380
Fiber outer diameter (μm) 500
Fiber length (mm) 300
Number of fibers 3200 Fiber porosity 0.65 Pore size (μm) 0.16 Contact area (m2) 1.5
A sketch of CO2 absorption in hollow membrane contactor is shown in Fig. 2. And the photo
of experimental setup is shown in Fig. 3. The HDMF-100-1 type microporous polypropylene hollow fiber membrane module (Tianjin Blue Cross Membrane Technology Co., Ltd.) was used as the contactor in this study. The characteristics of the membrane module are listed in Table 1. A gas mixture containing CO2, N2 with various volume ratios was selected as the feed gas.
Deionized water, aqueous solutions of Monoethanolamine (MEA), methyldiethanolamine (MDEA) were chosen as absorption liquids. The 99.5% grade MEA and MDEA (Shanghai Bangcheng Chemical Co., Ltd.) were dissolved in deionized water to make aqueous solutions of 0.05mol/l-0.25mol/l. The gas phase and liquid phase flowed countercurrent through the module (the gas passed through the shell side, and the absorbent flowed countercurrent through the lumen side of the hollow fibers).
In the experiment, the feed gas was introduced into the system from compressed gas cylinders and the flow rate was adjusted by Mass Flow Controller (Sevenstar Electronics Co., Ltd. MFC D07) which can precisely control the gas flow rate. Then the gas was introduced into the static mixer where the mixtures can be mixed uniformly. Pressure gauges at the inlet and outlet of the membrane module measure the gas pressures, and outlet gas flow rate was measured by a mass flow meter (Sevenstar Electronics Co., Ltd.). The inlet and outlet gas compositions were
analyzed on-line by a 9790 Ⅲ gas chromatograph (FuLi Analytical Instrument Co., Ltd.) using a thermal conductivity detector (TCD). A stainless steel peristaltic pump (Tian Li Liquid Industrial Equipment Factory) was used to pump the liquid into the lumen side of the hollow fibers from solvent container, and the flow rate of liquid was controlled by a rotational flow meter. The
concentrations of the inlet and outlet absorption liquids were measured by a chemical titrimetric method. Gas out N CO Sampling MFC MFC Static mixer Pressure gauge Liquid out Flow meter Gas in contactor Membrane Liquid in Pressure gauge Pump absorbent Liquid MFM Sample analysis Gas chromatograph Venting
Fig.2. Sketch of experimental system.
Before each run of an experiment, the system was operated for 15 min by deionized water to eliminate the influence of the former experiment. All data were collected at steady state, after at least 20 min of operating time. Steady state will be indicated by a constant CO2 concentration in
the outlet gas stream. Under the same operating conditions, five samples of the gas and absorbent samples were taken and the average value was calculated. All experiments were carried out at atmospheric pressure (0.1MPa) and at room temperatures.
3. RESULTS AND DISCUSSION
Removal efficiency (η) and mass transfer rate of CO2 ( ) were used to describe the
separation properties of hollow fiber membrane module using low concentration absorbents, which can be calculated by Eq.(1) and Eq.(2) (Kumar et al., 2002; Yeon et al., 2005):
2 CO J in in out out in in Q C Q C Q C η= × − × × (1) ( ) 2 273.15 0.0224 in in out out CO g Q C Q C J T S × − × × = × × (2)
Where η denotes the CO2 removal efficiency, %; is the CO2 mass transfer rate, mol/ (m2·h);
and represent the inlet and outlet gas flow rate respectively, m3/h; and are the CO2 volumetric fraction in the gas inlet and outlet respectively, %;
2 CO J in Q Qout Cin Cout g
T is the gas temperature, K; S represents the gas-liquid mass transfer area and herein equals to the effective membrane area,
m2.
3.1. Effect of liquid flow rate on CO2 removal efficiency and CO2 mass transfer rate
In Fig. 4 and Fig. 5, the CO2 removal efficiency and mass transfer rate are plotted against
liquid flow rate using 0.05 mol/l MEA, 0.05 mol/l MDEA and deionized water as the absorbent respectively. The CO2 volume fraction in feed gas is 40 % and the gas flow rate is 150 ml/min.
As shown in Fig. 4 and Fig. 5, the liquid flow rate has an important influence on both CO2
removal efficiency and CO2 mass transfer rate. As the liquid flow rate increases, CO2 removal
water, the CO2 removal efficiency could reach 60.3% as the liquid flow rate is 68 ml/min. With
the increase of liquid flow rate, the liquid disturbance is enhanced, which results in a higher speed of CO2 diffusing into the liquid. The consumed absorbents at the membrane boundary
layer could diffuse into the liquid phase at a higher speed due to the increase of liquid flow rate. Therefore, the gas-liquid interface could be maintained at a higher solvent concentration, which increases the CO2 removal efficiency. In addition, as the increase of liquid flow rate, the
thicknesses of gaseous and liquid-phase boundary layers decrease, leading to enhancement of the mass transfer rate. However, CO2 removal efficiency and mass transfer rate increase slowly at
higher liquid flow rate due to the limited boundary layer thickness, which are also shown in the Fig. 4 and Fig. 5.
10 20 30 40 50 60 70 80 20 30 40 50 60 70 80 90 100 CO 2 r e m o va l e fficie n cy ( % )
Liquid flow rate (ml/min) 0.05mol/LMEA
0.05mol/L MDEA Water
Fig. 4. Influence of liquid flow rate on CO2 removal efficiency.
10 20 30 40 50 60 70 80 1 2 3 4 5 6 7 8 9 10
Liquid flow rate (ml/min)
JCO 2 E2 ( mo l/ m 2 .h ) 0.05mol/L MEA 0.05mol/L MDEA Water
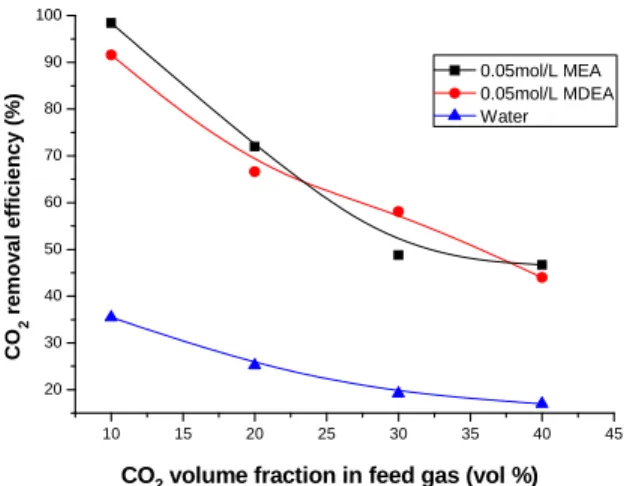
3.2. Effect of CO2 volume fraction in feed gas on CO2 removal efficiency and mass transfer
rate
The influence of inlet CO2 volume fraction at the inlet of feed gas on the removal efficiency
and mass transfer rate is shown in Fig.6 and Fig.7, respectively. Deionized water, 0.05 mol/l MEA and 0.05 mol/L MDEA were used as the absorbent. The gas flow rate is 150 ml/min and the liquid flow rate is 17 ml/min. The CO2 volume fraction in the feed gas varied from 10 % to
40%. Fig. 6 demonstrates that the CO2 removal efficiency decreases with the increase of CO2
volume fraction in the feed gas. As the CO2 is absorbed in the liquid through physical absorption
or chemical absorption, more liquid is consumed with higher CO2 concentration at the liquid
membrane. The liquid will be insufficient relative to higher CO2 concentration at a constant
liquid flow rate, which results in a decrease of CO2 removal efficiency.
Fig.7 shows that the increase of CO2 volume fraction could effectively enhance the mass
transfer rate. With the increase of CO2 volume fraction, the CO2 concentration gradient at the
liquid-gas boundary layer increases. That is, the CO2 driving force of mass transfer in the gas is
enhanced, which leads to the increase of CO2 diffusion mass transfer rate. Therefore, more CO2
is absorbed in the liquid by permeating the membrane module.
10 15 20 25 30 35 40 45 20 30 40 50 60 70 80 90 100 0.05mol/L MEA 0.05mol/L MDEA Water
CO2 volume fraction in feed gas (vol %)
CO 2 re mov al e fficiency (% )
10 15 20 25 30 35 40 45 1.0 1.5 2.0 2.5 3.0 3.5 4.0 4.5 5.0
CO2 volume fraction in feed gas (vol %)
JCO 2 E2 ( mo l/m 2 .h ) 0.05mol/L MEA 0.05mol/L MDEA Water
Fig. 7. Influence of CO2 volume fraction at the feed gas inlet on CO2 mass transfer rate.
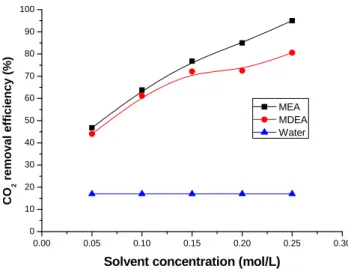
3.3. Effect of solvent concentration on CO2 removal efficiency and mass transfer rate
The influences of the absorbent concentration on the CO2 removal efficiency and mass
transfer rate are plotted in Fig. 8 and Fig. 9. Deionized water, MEA and MDEA with the liquid concentration varying from 0.05 mol/l to 0.25 mol/l were used as the absorbent. The gas flow rate is 150 ml/min with 40 vol.% CO2 in the feed gas and the liquid flow rate is 17 ml/min. As
shown in Figs. 8 and 9, the CO2 removal efficiency and mass transfer rate obviously increase
with the increase of the concentration of MEA and MDEA. With the increase of absorbent concentration, the effective component absorbing CO2 in the liquid boundary layer increases,
resulting in higher CO2 transfer rate into the liquid. As CO2 enters the liquid and reacts with the
corresponding solvent, the CO2 concentration decreases in liquid-gas boundary layer. It enhances
the CO2 solubility rate and increases the CO2 removal efficiency. The CO2 removal efficiency
can be as high as 95 % with the MEA concentration of 0.25 mol/l.
As shown in Fig. 8, the CO2 removal efficiency of MEA and MDEA is much higher than that
of deionized water under the same operating conditions. This might be caused by more CO2
consumed in the presence of MEA and MDEA by the chemical reaction. In addition, Fig. 8 also indicates that the CO2 removal efficiency of MEA is higher than that of MDEA especially at
high absorbent concentration due to the higher rate of MEA reacting with CO2.
As discussed above, a higher removal efficiency and mass transfer rate can be effectively achieved by increasing the solvent concentration. However, with the increase of concentration of the solvent, the PP membrane is more likely to be wetted and its performance is deteriorated. It can be explained by that the surface tension of aqueous MEA and MDEA solution decreases with the increase of the amine concentration according to the Laplace-Young equation. The membrane is successfully operated for about 60 h without being wetted by using MEA and MDEA at the concentration of 0.05 mol/l. Therefore, the absorbent concentration should be
compromised between removal efficiency and the wetting to ensure a stable and efficient
absorption of CO2 over a long life of the hollow fiber membrane. Many researches on improving
non-wettability have shown promising results. Studies have shown that the performance of polyethylene (PE) membranes could be greatly improved by a hydrophobic treatment to its surface using fluorocarbonic materials (Nishikawa et al., 1995). The wetting problem can also be achieved by coating the membrane with a very thin permeable layer (Kreulen et al., 1993). However, a hollow fiber membrane with non-wettability is still required to be further investigated and developed.
0.00 0.05 0.10 0.15 0.20 0.25 0.30 0 10 20 30 40 50 60 70 80 90 100 CO 2 r e mo va l ef fic ien cy (%)
Solvent concentration (mol/L) MEA MDEA Water
Fig. 8. Influence of solvent concentration on CO2 removal efficiency.
0.00 0.05 0.10 0.15 0.20 0.25 0.30 1 2 3 4 5 6 7 8 9 10 MEA MDEA Water
Solvent concentration (mol/L)
JCO 2 E2 ( mo l/ m 2 .h )
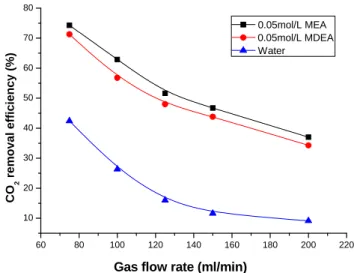
3.4. Effect of gas flow rate on CO2 removal efficiency and CO2 mass transfer rate
Effect of gas flow rate on the CO2 removal efficiency and mass transfer rate are shown in Figs.
10 and 11. Deionized water, 0.05 mol/l MEA and 0.05 mol/l MDEA were used as the absorbent. The gas flow rate was varied from 75 ml/min to 200 ml/min with 40 vol. % CO2 in the feed gas
and the liquid flow rate is 17 ml/min. It is clearly shown in Fig.11 that there is a difference in the effects of gas flow rate on CO2 mass transfer rate of MEA, MDEA aqueous solutions and
deionized water due to some uncontrolled factors. With the decrease of gas retention time, the CO2 concentration at the gas-liquid interface increases, resulting in an increase of the mass
transfer rate for MEA and MDEA aqueous solutions. Although increase of gas flow rate can reduce the thickness of gas boundary layer and enhance the gas mass transfer, which is favorable for the CO2 removal. However, it simultaneously decreases the residence time of gas in the
membrane contactor, which is unfavorable for the CO2 removal. The combined effects result in
the tendency as shown in Fig. 10 and Fig. 11. It indicates that the residence time plays an important role in the removal of CO2.
60 80 100 120 140 160 180 200 220 10 20 30 40 50 60 70 80 CO 2 remo va l effi ci en cy (%)
Gas flow rate (ml/min)
0.05mol/L MEA 0.05mol/L MDEA Water
60 80 100 120 140 160 180 200 220 1.0 1.5 2.0 2.5 3.0 3.5 4.0 4.5 5.0 5.5 JCO 2 E2 ( mol/m 2 .h )
Gas flow rate (ml/min)
0.05mol/L MEA 0.05mol/L MDEA Water
Fig. 11. Influence of gas flow rate on CO2 mass transfer rate.
4. CONCLUSIONS
Experiments have been carried out to investigate the effect of operating parameters on the efficiency of carbon dioxide removal using deionized water and low concentration MDEA and MEA in polypropylene hollow fiber membrane. It has been found that the CO2 removal
efficiency increases with the increase of the liquid flow rate and solvent concentration, while the CO2 mass transfer rate increases with the increase of liquid flow rate, CO2 volume fraction in the
feed gas, solvent concentration and gas flow rate. It is concluded that the absorbent concentration should be compromised between absorption efficiency and the membrane wetting to ensure a stable and efficient removal of CO2 with a long life of the hollow fiber membrane. It has also
been observed by the experiments that a longer operation period render partial membrane wetting even using relative lower solvent concentration, resulting in significant decrease of membrane absorption performance. It is indicated that the decrease of residence time plays more important role in the removal of CO2 than the intensification of the gas mass transfer.
ACKNOWLEDGEMENTS
The work described in this paper has been carried out with the financial support of the Swedish Research Links Programme and the China Natural Science Foundation (contract No. 20606011) for which due acknowledgement is given. We also would like to thank Mr. H. L. Li and Ms. Y. H. Huang for the help in the experimental setup.
REFERENCES
IPCC 2005. IPCC Special Report on Carbon Dioxide Capture and Storage. Chapter 3. http://www.ipcc.ch/ipccreports/special-reports.htm
B.P. Mandal, S.S. Bandyopadhyay. 2006. Absorption of carbon dioxide into aqueous blends of 2-amino-2-methyl-1-propanol and monoethanolamine. Chemical Engineering Science 61:
5440-5447
S.H. Moon, J.W. Shim. 2006. A novel process for CO2/CH4 gas separation on activated carbon
fibers-electric swing adsorption. Journal of Colloid and Interface Science 298: 523-528.
A. Corti, D. Fiaschi, L. Lombardi. 2004. Carbon dioxide removal in power generation using membrane technology. Energy 29: 2025-2043.
A. Gabelman, S.T. Hwang. 1999. Hollow fiber membrane contactors. Journal of Membrane Science 159: 61-106.
O. Falk-Pedersen, M.S. Grønvold, H. Dannström, D.B. Stuksrud. Gas treatment using membrane gas/liquid contactors, Proceedings of the Fifth International Conference on Greenhouse Gas Control Technologies, August 13-16, 2000. Cairns Convention Centre, Collingwood, Australia. J.L. Li, B.H. Chen. 2005. Review of CO2 absorption using chemical solvents in hollow fiber
membrane contactors. Separation and Purification Technology 41: 109-122.
Q. Zhang, E.L. Cussler. 1985. Microporous hollow fibers for gas absorption: Mass transfer in the liquid. Journal of Membrane Science 23: 321-332.
Q. Zhang, E.L. Cussler. 1985. Mocroporous hollow fibers for gas absorption: Mass transfer across the membrane. Journal of Membrane Science 23: 333-345.
P.S. Kumar, J.A. Hogendoorn, P.H.M. Feron, G.F.Versteeg. 2002. New absorption liquids for the removal of CO2 from dilute gas streams using membrane contactors. Chemical Engineering Science 57: 1639-1651.
S.-H. Yeon, K.-S. Lee, B. Sea, Y.-I. Park, K.-H. Lee. 2005. Application of pilot-scale membrane contactor hybrid system for removal of carbon dioxide from flue gas. Journal of Membrane Science 257: 156-160.
Y.S. Kim, S.M. Yang. 2000. Absorption of carbon dioxide through hollow fiber membranes using various aqueous absorbents. Separation and Purification Technology 21: 101-109.
B.P. Mandal, M. Guha, A.K. Biswas, S.S. Bandyopadhyay. 2001. Removal of carbon dioxide by absorption in mixed amines: modeling of absorption in aqueous MDEA/MEA and AMP/MEA solutions. Chemical Engineering Science 56: 6217-6224.
R. Wang, D. F. Li, D. T. Liang. 2004. Modeling of CO2 capture by three typical amine solutions
in hollow fiber membrane contactors. Chemical Engineering and Processing 43: 849-856
J.G. Lu, Y.F. Zheng, M.D. Cheng, L.J. Wang. 2007. Effects of activators on mass-transfer enhancement in a hollow fiber contactor using activated alkanolamine solutions. Journal of Membrane Science 289: 138-149.
H.Y. Zhang, R. Wang, D.T. Liang, J.H. Tay. 2006. Modeling and experimental study of CO2
absorption in a hollow fiber membrane contactor. Journal of Membrane Science 279: 301-310.
H.Y. Zhang, R. Wang, D.T. Liang, J.H. Tay. 2007. Theoretical and experimental studies of membrane wetting in the membrane gas-liquid contacting process for CO2 absorption. Journal of Membrane Science. Doi: 10.1016/j. memsci. 2007.09.050
N. Matsumiya, M. Teramoto, S. Kitada, H. Matsuyama. 2005. Evaluation of energy consumption for separation of CO2 in the gas by hollow fiber facilitated transport membrane module with
permeation of amine solution. Separation and Purification Technology 46: 26-32.
L.Y. Liu, L.J. Li, Z.W. Ding, R. Ma, Z. Yang. 2005. Mass transfer enhancement in coiled hollow fiber membrane contactor. Journal of Membrane Science 279: 301-310.
V.Y. Dindore, D.W.F. Brilman, P.H.M. Feron, G.F. Versteeg. 2005. CO2 absorption at elevated
pressures using a hollow fiber membrane contactor. Journal of Membrane Science 235: 99-109.
G. Vázquez, E. Alvarez, J.M. Navaza, R. Rendo, E. Romero. 1997. Surface tension of binary mixtures of water + monoethanolamine and water + 2-amino-2-methyl-1-propanol and tertiary mixtures of these amines with water from 25Ԩ to 50Ԩ. Journal of Chemical Engineering 42: 57-59.
E.B. Rinker, D.W. Oelschlager, A.T. Colussi, K.R. Henry, O.C. Sandal. 1994. Viscosity, density and surface tension of binary mixtures of water and mixtures of these amines with water over the temperature range 20-100Ԩ. Journal of Chemical Engineering 39: 392-395.
A.C.M. Franken, J.A.N. Nolten, M.H.V. Mulder, D. Barrgeman, C.A. Smolders. 1987. Wetting criterion for the applicability of membrane distillation. Journal of Membrane Science 33:
315-328.
N. Nishikawa, M. Ishibashi, H. Ohta, N. Akutsu, H. Mastsumoto, T. Kamata, H.Kitamura. 1995. CO2 removal by hollow fiber gas liquid contactor. Energy Conversion and Management 36:
415-418.
H. Kreulen, C.A. Smolders, G.F. Versteeg, W.P.M. van Swaaij. 1993. Microporous hollow fiber membrane modules as gas-liquid contactors Part 2. Mass transfer with chemical reaction.
2. INTENSIFICATION OF TRANSESTERIFICATION FOR SYNTHESIS OF BIODIESEL
USING A MICROCHANNEL REACTOR
Zhenzhong Wen1, Xinhai Yu1*, Shan-Tung Tu1, Jinyue Yan2,3, Erik Dahlquist2
1. School of Mechanical and Power Engineering, East China University of Science and Technology,
Shanghai, 200237, China
2. School of Sustainable Development of Society and Technology, Mälardalen University SE-721 23 Västerås, Sweden
3. School of Chemial Science and Engineering, Royal Institute of Technology Stockholm, SE-100 44 Stockholm, Sweden
Email: yxhh@ecust.edu.cn
ABSTRACT
In this paper, transesterification of soybean oil with methanol in the presence of concentrated sodium hydroxide as a catalyst has been experimentally investigated in a zigzag micro-channel reactor. The operating parameters have been optimized which include molar ratio of oil to methanol, catalyst quantity, volumetric rate, and reaction temperature. Compared with the contact time for complete conversion from several minutes to several hours in conventional reactors, the corresponding contact time is significantly reduced to 28 seconds at the conditions of oil-to-methanol molar ratio of 1: 9 and temperature of 56oC with catalyst of 1.2 % (weight-based). Intensification of the mixing of the immiscible reactants in transesterification reaction by the zigzag micro-channel is the most influence factor, which is characterized by optical method. It is shown that chaotic intensification mixing in micro-scale is an effective way to improve the efficiency of the biodiesel synthesis process.
Keywords: Biodiesel; Micro-channel reactor; Mixing; Transesterification
INTRODUCTION
Biodiesel is a renewable fuel that can be produced from vegetable oils, animal fats, grease, or waste frying oil. Due to the increased price of the petroleum and the environmental concern
including both local pollution from the vehicle exhusts and global climate changes, biodiesel is becoming more attractive biofuel of high interests. (Marchetti et al, 2007). In addition, biodiesel is an alternative of non-toxic and biodegradable fuel, and essentially free of sulfur and aromatics (Karmee et al., 2005). Biodiesel has been produced by transesterification of triglyceride to methyl esters using homogeneous basic catalysts (Vicente et al, 2004), such as sodium or potassium hydroxides, carbonates or alkoxides, as represented by the following equation (Marchetti et al, 2007):
CH2-OOC-R1 R1-COO-R’ CH2–OH
| |
Catalyst
+ 3R’OH + CH -OOC-R2 R2-COO-R’ CH–OH |
|
Most of biodiesel production are batch processes, which need more reagents and are generally of lower efficiency. Recently, new production technologies have been studied
including e.g., ultrasonic irradiation (Stavarache et al. 2007), supercritical transesterification (van Kasteren et al., 2007) and fixed-bed reactors using heterogeneous catalysts (Xie et al.,
2006)..Micro-channel reactors have high volume/surface ratio, short diffusion distance, fast and efficient heat dissipation and mass transfer (Kobayashi et al., 2006). Those features have been used in organic synthesis (Mason et al., 2007). In this paper, a zigzag micro-channel reactor has been developed and applied in the transesterification process. Process performance has been evaluated on intensification of mass transportation by the chaotic mixing.. Based on
experimental results, a highly efficient and compact reactor is proposed for biodiesel production in a mini- fuel processing plant.
EXPERIMENTAL
Objectives of the experiment
The objectives of the experiments are investigating various parameters influencing biodiesel production and mixing performance between immiscible reagents. Parameters in micro-channel reactions such as catalyst rates, temperatures, methanol/oil ratios, residence time were discussed. The catalyst rates varied as 0.55, 0.67, 0.88, 1, 1.2, 1.5, 2% (by wt. of oil). The temperatures were varied as 40, 45, 50, 56, 62, 70, 75°C. The molar ratios (methanol/oil) were varied as 4:1,
5:1, 6:1, 9:1, 10.5:1, 17:1. The residence times were varied as 14, 18, 28, 32, 39seconds. Mixing performance influenced by different residence times, batch to micro-channel under the same condition were discussed. Before testing mixing performance, methyl violet was premixed in methanol so as to be observed in optical microscope conveniently.
Experimental set-up
The sketch of the experimental setup is presented in the Fig. 1. Two syringe pumps (Harvard Apparatus, USA) were used to inject the fluids of different flow rates. The soybean oil and methanol aggregated through a T shape three-way junction (the outlet diameter of 200μm). The outlet of the junction is linked with the inlet of the zigzag micro-channel reactor. The reactor is immersed in a water bath, to ensure the accuracy of reaction temperature. The outlet of the micro-channel reactor is connected with a collection flask placed in an ice-water vessel in order to terminate the transesterification reaction quickly. Sodium hydroxide was dissolved in
methanol as the catalyst by electro-stirring before experiments. The biodiesel samples were analyzed by using a gas chromatograph (FULI9790) with a capillary column for identification and quantification. Methyl Undecanoate (Fluka) was used as the internal standard solvent.
Fig.1. Schematic drawing of the continuous transesterification of soybean oil in a micro-channel reactor.
Micro-channel reactor fabrication
The micro-channel reactor was made of stainless steel of 316L (Fig.2). Three types of patterned sheets were prepared to construct the reactor: cover sheet, medium sheet and bottom sheet. The cover sheet has two holes, which act as the flow paths, The medium sheet, shown in
Premixing of NaOH and Methanol
Syringe Pump Methanol-catalyst phase Methanol Oil Microchannel Reactor Centrifugation And Refining Glycerol Biodiesel Residue recycled Residue recycled
Fig.3, has one zigzag micro-channel. The dimension of micro-channel is 200μm (W) X 300μm (D) X 1.07m (L). The thickness of the bottom sheet is 0.5 mm without holes.. Surfaces of all sheets in three types were polished to a roughness of 2μm followed by cleaning in acetone prior to diffusion bonding. The dimensions of the micro-channel reactor are about 72 mm × 72 mm × 4 mm, respectively. The effective volume of the micro-channel reactor is 0.125 cm3, including the micro-channels and the inlet and outlet zones.
Fig.2. Photo of the micro-channel reactor. Fig.3. Schematic drawing of the micro-channel sheet.
Characterization
Characterization of the experimental set up is conducted by applying the method of optical measurement. Determining droplet size distribution requires a few minutes, coalescence of methanol droplets emerge immediately as the sample removed from collection vessel. Therefore, a stabilizing agent or surfactant needed to be added to the dispersion to slow the coalescence phenomenon (Wu et al, 2007).
Decaglycerol monooleate ester as a surfactant was dissolved in methanol before mixing to avoid coalescence phenomenon, which is adverse for measurement. The experiment on mixing was carried out in the micro-channel reactor and the three-necked batch reactor without the catalyst of sodium hydroxide. The size of the droplets of the emulsion was identified using an optical microscope (Sharpscope SF-1 Industrial Microscope, Nanjing, China) with supporting software (VIS ver 2.90 professional-Digital Imaging and Measured System) that allows 950X enlargement and has a color camera, which sends a signal to a personal computer. The software was used to measure the diameters of methanol droplets directly on a monitor by a three-point
measurement technique. As the diameter distribution is dependent on the population (Lemenand et al., 2003), a large number of samples (600) for the measurement were measured to ensure the accuracy of the results.
Since the measurements of droplet diameter are based on sampling a large number of
experiments (Lemenand et al. 2003), It is importantly to determine the number of droplets of the samples so that the diameter distribution is independent of the population. The empirical method used here entails concerning errors between two distributions, the error is evaluated by a
normalized standard deviation, defined by
c N 2 ) ' i f i i(f n SD = ∑ − (1)
Where and are the droplet frequencies of the same class diameter and Nc is the class number. For this case, the normalized standard deviation between two successive distributions is as a function of number of droplets, this minimal number of 600 is needed for droplet diameter measurement so as to assure the reproducibility.
i
f fi'
RESULTS AND DISCUSSION
Comparison between the micro-channel reactor and impeller batch reactor
Fig. 4 shows the difference in the soybean oil conversion between the impeller batch-reactor under the conditions: temperature of 56 °C, methanol/oil molar ratio of 9:1, catalyst amount of 1.2% (weight fractions of the oil supplied).The experimental results show the time scale for stirring in the impeller batch reactor compared to the contact time for the micro-channel reactor. It can be seen from the Fig. 4 that the conversion of soybean oil in micro-channel reactor is higher even if the time for the micro-channel reactor is only one tenth the corresponding value for the batch reactor. In the absence of the catalyst, the mixing experiments were carried out in the same conditions.. Two photos of the emulsions formed in the mixing experiments are presented in Fig. 5. It is indicated that the diameter of the droplets in the emulsion by the micro-channel reactor is smaller than that by the batch reactor with an agitator. Several big droplets can be seen in the emulsion by the batch rector whereas the droplets by the micro-channel reactor are of approximately the same size. The distribution and mean droplet size were calculated by 600 droplet samples. The results are shown in Fig. 6. The mean droplet size for micro-channel is 4.21μm, smaller than that of 4.92μm for the batch reactor. As immiscible fluids mix using a batch stirrer, convection is induced, resulting in a turbulence and chaotic mixing. In a mixture of two immiscible liquids, there is a critical agitator speed, NC, at which a separated immiscible layer disappears (Shinji, 1975). Nc can be calculated by the empirical equation:
1/ 9 0.26 2 / 3 c c d c c c N KD μ ρ ρ ρ ρ − ⎛ ⎞ ⎛ − ⎞ = ⎜ ⎟ ⎜ ⎟ ⎝ ⎠ ⎝ ⎠ (2) 0 100 200 300 400 500 600 70 80 90 100 Conver sion,% Residence time, s Micro-channel Batch
Fig.4. Comparison between the zigzag micro-channel reactor and batch impeller.
In which K is a proportionality coefficient, ρc and ρd are the densities of the continuous and dispersed phase, respectively, ρc is the viscosity of the continuous phase, and D is the vessel diameter. As for the mixing of methanol and soybean oil, the following parameter values are used to estimated this speed (Wu et al, 2007), K was taken as 750 for the agitation in center of
the vessel, ρc is 920 kg/m3, ρd is 791 kg/m3, μc is 0.05 Pa s, and D is 17cm. The minimum critical agitator speed is 493 rpm, which means the agitator speed of 600 rpm in the experiment is acceptable. The shear forces that cause the convection are obviously dampened away from the stirrer and most of the bottom flask and axis of the impeller. Therefore, longer time is needed for mixing to avoid the disadvantages of convective dead zones (Alvarez et al., 2002). In addition, the dampened shear force also results in the broad distribution of droplet size as shown in Fig. 6, which in accordance with a unsteady-state of the emulsion by an agitator. Taking advantage of the recirculation phenomenon, the mixing efficiency of zigzag micro-channels could be
significantly improved compared to straight micro-channels (Virginie et al., 2002). These recirculations induce a transversal component of velocity, which improves the mixing process. Therefore, the smaller and size and narrow distribution of droplet can be effectively achieved in the zigzag micro-channel as shown in Fig. 5 and Fig. 6.
(a) (b)
Fig.5. Photograph of droplets in the emulsion generated by (a) batch impeller, (b) zigzag microchannel reactor. 0 3 6 9 12 15 18 0 4 8 12 16 20 24 Nu mb er di s tri bu ti on ,% Droplet size,um Batch experiment Microchannel experiment
Fig.6. Comparison of differential droplet distributions for batch impeller and the zigzag micro-channel reactor
Banks and coworkers (Banks et al., 2003) derived rate expressions for a liquid-liquid
interfacial reaction system for copper extraction from an aqueous solution into an organic phase. If mixing in both the dispersed and continuous phase is good, then the bulk concentrations of each phase will be near to that of the interfaces and the change in concentration with time is
[ ] 2 [ ] d B k4 r N B dt V π − = (3)
Where V is the volume of the dispersed phase, r is the droplet radius and N is the total number of
particles. The effective rate constant for the process should correspond to the surface rate constant by
eff r Sdropletaverage V kN N V r k K ()= 4π2 = (4)
As the mean droplet size for the impeller agitation is 1.17 times larger than that for the micro-channel reactor, the effective rate constant for the micro-micro-channel reactor could be as much as 1.4 times higher than that of the conventional agitation system. Therefore, the zigzag micro-channel might improve the efficiency of the transesterification effectively by reductions in the mean droplet size.
Performance of the micro-channel
The effect of catalyst amount on the performance of the micro-channel is shown in Fig. 7. The catalyst rate was varied in the range of 0.55 -2%. These percentages were weight fractions of the oil supplied for this reaction. It can be seen that the conversion rate was increased first with the increase of catalyst rate from 0.55% to 1.2%. But, with further increase in the catalyst rate, the conversion rate was decreased, which might be due to the formation of soap (Meka et al., 2007).
In the presence of homogeneous catalyst, the reaction mixture constitutes of a two-phase system. One is methanol-catalyst, and another is oil. In general, the rate of the transesterification reaction can be accelerated with the increase of the reaction temperature. As shown in Fig. 8, the conversion increased with reaction temperature to nearly 97.3% at 56 °C and then decreased with the further increase of temperature above 56 °C. A large number of bubbles were observed at the outlet of the micro-channel reactor as the temperature was increased to 65 °C. This might be caused by the vaporization of methanol at temperatures around 56oC and higher. The bubbles reduce the interface of oil and methanol. On the other hand, the flow rate of the mixture was accelerated in the existence of the bubbles. The combination of both phenomena presents unfavorable impacts on the conversion of soybean oil. Based on this, the appropriate reaction temperature shall be considered to be around 56 °C.
0.6 0.9 1.2 1.5 1.8 2.1 50 60 70 80 90 100 Conve rsion, % Catalyst amount,(wt,%)
Fig.7. Influence of catalyst amount on the conversion.
Reaction conditions: methanol/oil molar ratio 6:1, residence time 18 seconds and temperature 63 °C. 35 40 45 50 55 60 65 70 75 80 50 60 70 80 90 100 Co n v ers ion (% ) Temperature(℃)
Fig.8. Influence of reaction temperature on the conversion.
Reaction conditions: methanol/oil molar ratio 6:1, catalyst amount 1.2%, at the residence time 28 seconds.
Stoichiometrically, the methanolysis of soybean oil requires three moles of methanol for each mole of oil. However, in practice, the methanol/oil molar ratio should be higher than that of stoichiometric ratio in order to drive the reaction towards completion and produce more methyl esters as product. As shown in Fig. 9, when the methanol loading amount was increased from 4 to 6, the conversion was increased considerably. The maximum conversion was very close to
12:1. However, with further increase in the molar ratio there was only little improvement in the conversion. Therefore, we could conclude that to elevate the conversion an excess methanol feed was effective to a certain extent.
The effect of the residence time on the conversion of soybean oil is illustrated in Fig. 10. The conversion was increased with the increase of the reaction time from 14 to 28 seconds, and thereafter remained nearly constant as a representative of a nearly equilibrium conversion. The effect of the residence time on the mean droplet size is shown in Fig.11 (a). It can be seen that the mean droplet size increases with the increase of the residence time from 14 s to 31 seconds and decreases thereafter. As shown in Fig.11 (b), an increase of the residence time has little influence on the distribution of the droplet size. On the one hand, the increase of residence time is favorable for the mixing of the immiscible flows and the conversion of soybean oil due to the increase of contact time. On the other hand,the secondary flow in the zigzagmicrochannel is weakened by the decrease of the flow rate, which is unfavorable for the mixing and formation of small droplet (Virginie et al., 2002). Thus, the suitable reaction time for the synthesis of biodiesel shall be considered to be around 28 seconds.
2 4 6 8 10 12 14 16 18 20 50 60 70 80 90 100 C onve rsi on(%)
Molar ratio of methanol/oil
Fig.9. Influence of methanol/oil molar ratio on the conversion.
10 15 20 25 30 35 40 45 50 60 70 80 90 100 C onver sio n ,% Residence time,s
Fig.10. Influence of residence time on the conversion.
Reaction conditions: Methanol/oil molar ratio 9:1, catalyst amount 1.2% and temperature 56 °C.
10 15 20 25 30 35 40 0 1 2 3 4 5 Mean Droplet size, u m Residence time, s 0 4 8 12 16 20 24 0 5 10 15 20 25 30 Nu mb er d is tr ibu ti on ,% Droplet size, um 14s 18s 28s 31s 39s (a) (b)
Fig.11. Differential droplet distribution and mean droplet diameter of various residence times. (a) Mean droplet size of different residence times. (b) Distribution of droplet size for different
residence time.
CONCLUSIONS
Experimental studies for the improvement of biodiesel by using micro-channel reactor were conducted. A zigzag micro-channel reactor was developed by electric spark and diffusion bonding for the transesterification of soybean oil with methanol in the presence of concentrated sodium hydroxide as a catalyst. Compared with the contact time for complete conversion from
several minutes to several hours in conventional reactors, the corresponding contact time by the micro-channel reactor is reduced sharply to 28 seconds at the following conditions: oil/methanol molar ratio of 1: 9, temperature of 56 °C, catalyst amount 1.2% (wt, %). This might be resulted from the intensification of the mixing of the immiscible reactants in transesterification reaction by the zigzag micro-channel, which is characterized by a microscope method. It is shown that intensification of the chaotic mixing on the micro-scale is a desirable way to promote the efficiency of biodiesel synthesis process.
Even though the total throughput of biodiesel by the zigzag micro-channel reactor is small, the important effect of intensification by the micro-channel is crucial to the high efficiency for the production of biodiesel. Further work will include, for example, designing new type micro-mixers to enlarge the total volume of biodiesel production, and studying new solid catalysts so as to avert strenuous after-treatment process.
ACKNOWLEDGEMENTS
This study has been financially supported by the Swedish Research Links Programme and the China Natural Science Foundation (contract No. 20606011). Auhtors would like to
acknowledge both organizations. REFERENCES
J. M. Marchetti, V.U. Miguel, A. F. Errazu. 2007. Possible methods for biodiesel production.
Renewable & Sustainable Energy Review, 11: 1300-1311.
S. K. Karmee , A. Chadha,. 2005. Preparation of biodiesel from crude oil of Pongamia pinnata.
Bioresource Technology 96: 1425-1429.
G. Vicente, M. MartÍnez, J. Aracil. 2004. Integrated biodiesel production: a comparison of different homogeneous catalysts systems. Bioresource technology 92:297-305
C. Stavarache, M. Vinatru, Y. Maeda, H. Bandow. 2007. Ultrasonically driven continuous process for vegetable oil transesterification. Ultrasonics Sonochemistry. 14:413-417.
J. M. N. van Kasteren, A. P. Nisworo. 2007. A process model to estimate the cost of industrial scale biodiesel production from waste cooking oil by supercritical transesterification. Resources Conservation & Recycling.50:442-458.
W. Xie, H. Peng, L. Chen,.2006. Calcined Mg-Al hydrotalcites as solid base catalysts for methanolysis of soybean oil .Journal of molecular catalysis A: Chemical. 246:24-32.
J. Kobayashi, Y.Mori, S. Kobayashi. 2006. Multiphase Organic Synthesis in Microchannel Reactors. Chemistry-An Asian Journal 1-2:22-35
T. Lemenand, D. Della Valle, Y. Zellouf, H. 2003. Peerhossaini. Droplets formation in turbulent mixing of two immiscible fluids in a new type of static mixer .International journal of
multiphase flow 29:813-840.
B. P. Mason, K.E. Price, J. L. Steinbacher, A. R. Bogdan, T. McQuade, 2007. Greener
approaches to organic synthesis using microreactor technology. Chemical reviews. 107:
2300-2318.
N.Shinji 1975. Mixing: principles and applications 1st edn. Wiley, New York.
P.Wu, Y.Yang, J. A. Colucci, E. A. Grulke, 2007. Effect of Ultrasonication on Droplet Size in iodiesel Mixtures
B
Journal of the American Oil Chemists' Society.84:877-884
C. E. Banks, O. V. Klymenko, R. G. Compton, 2003. Liquid-liquid processes and kinetics in acoustically emulsified media.
Physical Chemistry Chemical Physics. 5:1652-1656.
M. M. Alvarez, J. M. Zalc, T. Shinbrot, P. E. Arratia, F. J. Muzzio. 2002. Mechanisms of mixing and creation of structure in laminar stirred tanks. AIChE Journal. 48:2135-2148.
V. Mengeaud, J.J.Hubert, H. Girault, 2002. Mixing processes in a zigzag microchannel: finite element simulations and optical study. Analytical Chemistry 74:4279-4286.
P. K.Meka, V. Tripathi, R. P. Singh, 2007. Synthesis of biodiesel fuel from safflower oil using various reaction parameters. Journal of Oleo Science.56 (1):9-12.
3. Continuous bioethanol production by fermentation Bernt Lie_, Juan I. Videla
Telemark University College, Porsgrunn, Norway February 15, 2008
Abstract
Alcoholic fermentation is an important biochemical process which has been known for some 5000 years, e.g. in beer production. The process is relevant for producing bioethanol fuel, thus avoiding the introduction of fossil carbon dioxide into the atmosphere. The aim of this paper is to give a simple introduction to the fermentation process and to dynamic models of such systems in order to familiarize control engineers with the topic. Based on equations for a fermentation reactor in the literature, a rational model description is given, with parameter values and operating conditions. The model description includes extensions of the literature model. In this paper, several alternative reaction rates are discussed, and a more general model of oxygen uptake is introduced, e.g. by including the e¤ect of the substrate.
The various models are compared by simulation, and a simple analysis of controllability is sug- gested to illustrate possible use of the model. The presented model is complete in the sense that all necessary information is given to implement the model in a simulation tool. Several
Swedish National Energy Convention, March 12-13, 2008
4. Thermal Optimization and Economic Analysis of a Marnoch Heat Engine C.C. Chukwu1, G.F. Naterer1, M.A. Rosen1, E. Dahlquist2, I.A. Marnoch3
1 Faculty of Engineering and Applied Science, University of Ontario Institute of Technology,
2000 Simcoe Street North, Oshawa, Ontario, L1H 7K4, Canada
2 Faculty of Engineering and Applied Science, Malardalen University, Vasteras, Sweden 3 Marnoch Thermal Power Inc., 420 Portage Rd., Port Severn, Ontario, L0K 1S0, Canada.
Abstract
The Marnoch Thermal Energy Conversion (MTEC) device is a novel heat engine that recovers heat to produce electricity, using lower temperature differences than normally utilized in conventional heat recovery systems. A laboratory-scale proof-of-concept device has been built and tested at the University of Ontario Institute of Technology, Canada. It produces electricity by using heat exchangers and a piston assembly at temperatures and gauge pressures as low as 65oC and 1.03 MPa (150 psi), respectively. A performance assessment and thermodynamic
optimization of the MTEC system are reported in this article. A thermodynamic model and control system developed for improved operation of the system are described. Results are
provided of a numerical optimization of key design variables with appropriate constraints, and an economic analysis for different configurations is presented which demonstrates the practical viability of the system.
Keywords: Heat Engine, Optimization, Economic Analysis, Conservation, Efficiency
Nomenclature
A - Area (ft2)
c - Specific heat capacity (Btu/lb oF) D - Inner diameter (ft)
F - Friction factor
f - Fouling factor
h - Thermal conductivity (Btu/hr ft oF)
I - Irreversibility (Btu)
K - Number of variables
L - Length (ft)
.
m - Mass flow rate (gpm)
P - Pressure (psi)
Q - Heat (Btu)
.
Q - Heat transfer rate (Btu/hr) T - Temperature (oF)
U - Internal energy (Btu)
U’ - Overall heat transfer coefficient (Btu/hr ft2oF)
v - Mean velocity of fluid (ft/s)
Greek ρ - Density (lb/ft3) Subscripts 0 - Environment 1 - Tube 2 - Shell gas - Air v - Volumetric b - Boundary 1 Introduction
Although fossil fuels will continue to remain prominent in the world energy mix for many years, renewable energy sources are almost certain to become increasingly important to reduce greenhouse emissions. Correspondingly, alternative technologies that facilitate the use of renewable energy sources are expected to be increasingly developed.
The paper examines a promising alternative energy technology, the Marnoch Thermal Energy Conversion (MTEC) system, which can operate using renewable energy as well as other sources of thermal energy. The MTEC device is intended to produce electricity from a small temperature difference, as little as 15˚C. Operation over such small temperature differences allows for a highly flexible energy generation system, which can operate using a variety of heat sources and cooling reservoirs. Potential sources include waste heat from industrial facilities and co-generation applications, including those with steam cycle-based power generation. Solar thermal systems can also be used to provide heat in commercial applications of this device. Jeong et al. [1] have outlined the methods with which systems like the one considered here can be applied in waste heat recovery.
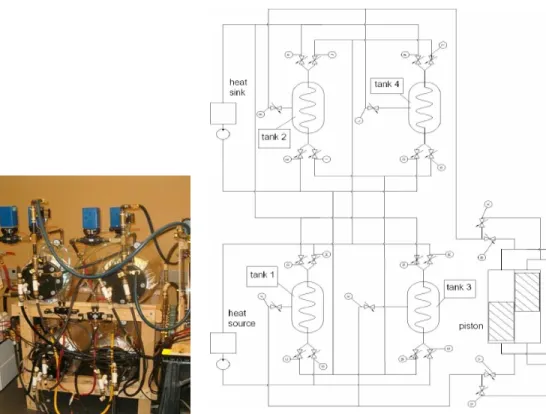
The MTEC device is a heat engine that consists of four cylindrical tanks, each fitted with helical copper tube coil heat exchangers. Each tank is connected to both a hot source and cold sink, via tubes and valves that allow a controlled mass flow at any step of the process. Initially, all tanks are kept at a constant pressure and mass. One-half of the Marnoch cycle is driven by heat supplied to the tanks, which drives pistons external to the tanks. The other half of the cycle connects to a colder tank, facilitating thermal expansion in the hot tank and thermal contraction in the cold tank, via a piston assembly.
The MTEC system utilizes an innovative sequence of steps that together achieve a desired electrical output. The operation of the MTEC device involves three steps: 1) conversion of internal energy to a pressure difference between two pressure vessels; 2) conversion of flow work into mechanical energy by means of a specialized piston assembly; and 3) conversion of mechanical energy to electrical energy by means of a generator.
The amount of electricity generated from a MTEC system strongly depends on the size and design of the heat exchangers, the pressure difference and the overall temperature difference. The working fluids for this device are water and dry air. The cylinders are arranged such that at any given time there is at least a pair each of a hot source and cold sink. A photograph of the MTEC system and the arrangements of the heat exchangers are shown in Figs.1 and 2, respectively.
Figure 1: Photograph of the MTEC device Figure 2: Schematic of MTEC system
2 Thermodynamic Model of the MTEC System
Modeling of the MTEC device and control system has been reported by Armstrong et al. [2]. The first step of the device operation consists of developing a pressure difference between two pressure vessels, through a temperature difference. When device operation commences, these vessels have the same initial condition. Heat exchangers placed within the vessels transfer heat from an external source to their interiors.
A general configuration of the heat exchanger and pressure vessel is illustrated in Fig. 3 Depending on whether individual tanks are used for heating or cooling, a thermal energy source or sink is connected accordingly.
Figure 3: Schematic of the heat exchanger and pressure vessel
By increasing or decreasing the temperature within the pressure vessel, the pressure increases or decreases for each case, respectively. Once a pressure difference has been generated between a pair of vessels, a specialized piston assembly is actuated to convert the pressure difference to mechanical energy. The piston assembly consists of two chambers separated by a piston. The piston moves back and forth, thereby converting the energy in the transferred mass to boundary work. As the first chamber’s volume increases, the second chamber’s volume
decreases. A valve system is configured so that the chamber with less volume is connected to the vessel with a higher pressure, while the lower pressure vessel is connected to the chamber with the larger volume, as shown in Fig. 4.
The pressure difference between the two chambers results in a net force on the piston, moving it to the right in Fig. 4. Once the piston has reached the end of the cylinder (the right side in Fig. 4), a valve system is activated, which causes chamber 2 to be connected to the high-pressure vessel and chamber 1 to the low-high-pressure vessel. This yields a net mass flow from the high-pressure vessel to the low-pressure vessel, as the gas in the chamber with decreasing volume is transferred to the low-pressure vessel. The second half of the piston’s movement, which returns the piston to its starting position, is shown in Fig. 5. The cycle continues as long as there is a pressure difference sufficient to move the piston.
Figure 4: Figure 4: Schematic of the piston assembly
Figure 5: Schematic of a piston reaching the right end of the cylinder
Through the operations of the piston, the internal energy of the working fluid piston is directly converted to mechanical energy which, via a flywheel connected to a generator, is converted to electrical energy.
Two thermodynamic models of the system are developed to predict the system
performance. These models are intended to simulate the conversion of internal energy to flow work and mechanical energy of piston movement.
Performing an energy balance for the heat exchanger,
T c m U U Q= 2 − 1= ⋅ vΔ (1)
Here U is the internal energy, m is the mass of air transferred, is the volumetric specific heat
capacity and
v
c T
Δ is the temperature difference. Alternatively, the heat transfer rate can in a given time interval can be expressed as
( )
t dt mc T Q v t t Δ =∫
2 1 . (2)By substituting the known boundary values at the initial condition, the following temperature expression can be derived:
( )
(
0
)
1
)
(
2 1 . gas t t v gasQ
t
dt
T
mc
t
T
=
∫
+
(3)The heat transfer rate can be expressed as follows: Q.
T
A
U
Q
.= '
Δ
where the overall heat transfer coefficient U’ is determined by means of a generalized thermal
resistance network, i.e.
cyl cond gas water water c h f f h h U , 1 1 1 1 ' + + + + = (5)
Combining the above equations, an expression for T2 with respect to time is obtained:
) 0 ( )) ( ( ' ) ( 1 2 1 T dt t T T mc A U t T t t gas water v gas =
∫
− + (6)This function is integrated numerically. The model is applicable to both the heat exchanger that supplies heat to the tank, as well as the heat exchanger that rejects heat from the tank. The value of is negative for the side that is rejecting heat. In this manner, the instantaneous gas
temperature and pressure within the pressure vessel may be determined. This model assumes a closed system, with no mass entering or leaving the pressure vessel.
. Q
The model is further extended to predict the power output and number of strokes, based on the initial conditions within the pressure vessels. This model is based on the principle of conservation of mass and Bernoulli’s equation. For a fixed time interval, it is assumed that each side of the system is at constant temperature and no frictional losses occur during pressure transfer. By utilizing the Bernoulli equation (3), it can be shown that
( 1) (1 ) (1 ) 3 ( 1) 0 2 2 2 1 2 1 (1 ) 2 0 ( 1) 2 ( ). . . . . 2 1 k k k k c k k k k g Rk T CA k P P t t V k M k p + − − − − ⎛ ⎞ − ⎜ ⎟ ⎡ ⎤ = + − ⎜ ⎟ ⎢ ⎥ + ⎣ ⎦ ⎜ ⎟ ⎝ ⎠ (7) 2 1 2 2 1 1 1 1
2
k k k pipep
p
dm
C A
p
dt
ρ
p
p
+ ⎛ ⎞ ⎛ ⎞ ⎜ ⎟ ⎜ ⎟ ⎝ ⎠ ⎝ ⎠⎛
⎞
⎛
⎞
⎛
⎞
⎜
⎟
= ⋅
⋅ ⋅ ⋅
⎜
⎟
−
⎜
⎟
⎜⎝ ⎠ ⎝ ⎠
⎜
⎟
⎝
⎠
⎟
(8)Using this equation, it is possible to determine the mass flow rate from each tank into the cylinder.
Based on the mass flow rates, numerical integration leads to the predicted change of mass with time in each tank as follows:
dt dt dm m t m t t
∫
− = 2 1 1 1 1( ) (0) (9) Rearranging (9) gives dt dt dm m t m t t∫
+ = 2 1 2 2 2( ) (0) (10)These equations are based on the pistons and pressure vessels being configured as shown in Fig. 6. Based on the mass in each of the piston chambers, the pressures at points 3 and 4 are
calculated as a function of time. With this information, the boundary work produced by the system during a given power stroke is determined as follows:
∫
∫
− = 2 1 4 2 1 3dV p dV p Wb (11)These calculations are repeated for several strokes, until the difference between p1 and p2