co
6')
6'3
1-!<
I!)
m
'=ll H h C D. Q. 5 h 0.6 per accident .r
*
w w
0.5 1 '0.4 ' r ; ; r r r 0.3 i 3 0.2 ' f . i . i 1 i r 0.1 1 I O l . .. . . . mg} L,._,Seasonal speed limits
Gb'ran NiIsson and Alexander Obrenovic
The national road network 1995
1 \ i 1; W N wi . 1 i 11 i X ? w % . 1 \ \ N L G P
Swedish National Road and
'TransportResearch Institute
0.8 .7,y
lT
" I Accident rate I Injury rate EINo of injured 0.7 1 J 1 . \ ; . || ; || . \ 1 s i i 1 1 \ . \ w \ \ \ 1 i i i l \ NOV DEC \ \ l ; . 1 \ b l 1 1 i J -UJVTI rapport 435A - 1998
Seasonal speed limits
GO ran Nilsson and Alexander Obrenovic
Swedish National Road and
PubHsher
Swedish National Road and
I Transport Research Institute
Printed in English 1999
Pubnca on
VTI rapport 435A
Published Project code
1998 30222
Project
Seasonal speed limits
Author
Goran Nilsson and Alexander Obrenovic
Sponsor
The Swedish National Road Administration
Title
Seasonal speed limits
Abstract (background, aims, methods, result)
During winter 1991/1992, traf c information and data regarding road conditions were collected for some per-manent traf c count stations of the Swedish National Road Administration. These data were used to analyse
changes in car speeds during the winter perioddue to winter road conditions and the hours of darkness in
relation to snow free conditions and daylight,
During winter 1996/1997 measurements of travel speed were made on five pairs of road sections, with diffe-rent speed limits on each pair (110-90, 110 70, 90 70), over at least two daylight periods broken down into snow free conditions and winter road conditions. Pairs of sections were selected so that they had the same traffic and standard, but separated by a different traffic environment, e.g. major intersection or small town, and had different speed limits, Friction measurements were made at the same time.
However, the effect of the speed limit on the speed distribution of car traffic is very stable between the sec-tions; for a difference in speed limits of 20 km/h, the difference in speed is on average 6 8 km/h, with a stan-dard deviation for the travel speed difference of vehicles that is about 8 km/h.
No. of pages
31 +Appendix
ISSN Language
Foreword
The contact person of the National Road Administration for this project was Anette Rehnberg. The Production Department ofthe Administration in Linkoping and Flen erected the measurement buildings along the investigated sections. Friction measurements were made by Sven-Ake Linden. Speed measurements were made by Peter Wretling, Per Henriksson, Jerry Wallh and Alexander Obrenovic. Alexander Obrenovic carried out the very
VTI RAPPORT 435A
time consuming evaluation of the measurements, and the results were collated and set out by GOran Nilsson. The final layout of the report was designed by Ann-Louise Flisback.
Linkoping, September 1998.
Contents
Summary ... ..I
1 Introduction ... .. 11
1.1 The traffic safety situation week by week ... .. 11
1.2 Different strategies ... 13
2 Criteria for seasonal speed limits ... .. 14
2.1 Summer traffic and winter traffic ... 14
2.2 Slippery road conditions ... .. 14
2.3 Slippery road conditions and darkness ... .. 14
2.4 The 24 hour period ... 15
2.5 Hours of darkness ... .. 16
3 The object of the investigation ... .. 20
4 Investigation method ... .. 21
4.1 Choice of road sections ... .. 21
5 Procedure ... .. 23
5.1 Friction measurements ... .. 23
5.2 Video measurements Speed ... 24
5.3 Travel speed of same vehicle on both sections ... 25
6 Conclusions ... .. 30
7 Literature ... 31 Appendix
Comparison of cumulative speed distributions on the different pairs and in different road conditions
Seasonal speed limits
by Goran Nilsson and Alexander Obrenovic
Swedish National Road and Transport Research Institute (VTI)
SE-58195 Linkoping Sweden
Summary
The risk ofhaving a road accident is twice as high in the winter, and the severity ofaccidents is twice as high in the summer.
In relation to the distance driven, it is twice as usual for drivers to be involved in an accident in the winter, than in the summer. At the same time, an average accident in the summer is twice as serious, partly because occu-pancy in cars is higher than in the winter.
The road safety situation in Sweden has a seasonal variation over the year. High accident risks or injury risks
can be related to the winter period, traffic at night or in the dark, and holiday traffic. In the discussion about
greater road safety, it is therefore obvious to consider seasonal differentiation of speed limits.
The background of this project is the question whether lower speed limits during the winter period have any effect on speed in icy/snowy road conditions or whether speed is adapted to road conditions regardless of speed limits.
In order to be in close agreement with the point raised in the investigation commissioned by the Swedish
Na-tional Road Administration, However, what fully
deter-mines whether it can be meaningful to have further dis-cussions is whether a lower speed limit affects the speed of the driver or whether he adapts speed to road and weather conditions to such an extent that a lower limit has no significance , the following project was carried
out
During winter 1991/92, traffic information and data
regarding road conditions were collected for some
per-manent traffic count stations of the Swedish National Road Administration. These data were used to analyse changes in car speeds during the winter period due to winter road conditions and the hours of darkness in relation to snow free conditions and daylight.
This made it possible to investigate more fully the
VTI RAPPORT 435A
effect of darkness on speed. On average, speed in win-ter at the investigated stations is about 4 km/h lower during a dark hour than during a daylight hour. Exami-nation of speed reduction in winter road conditions, compared with snow free conditions, shows that speed reduction is of the order of 10 km/h regardless of speed limit or speed on snow free surface.
Speed and different speed limits
During winter 1996/97 measurements of travel speed were made on five pairs of road sections, with
diffe-rent speed limits on each pair (110 90, 110 70, 90-70),
over at least two daylight periods broken down into snow free conditions and winter road conditions. Pairs of sections were selected so that they had the same
traffic and standard, but separated by a different traffic environment, e. g. major intersection or small town, and
had different speed limits. Friction measurements were made at the same time.
The initial hypothesis of the investigation, that ve-hicles are driven at the same low speed in very bad road conditions regardless of the speed limit can be rejected as regards speed distribution, but it is obviously true for a group of cars. But it is equally true that a small group of cars actually reduced their speed in spite of a higher speed limit, and that the majority drive at a higher speed and some at a considerably higher speed at the higher speed limit than was the case at the lower speed limit in winter road conditions.
However, the effect of the speed limit on the speed distribution of car traffic is very stable between the sec-tions; for a difference in speed limits of 20 km/h, the difference in speed is on average 6 8 km/h, with a stan-dard deviation for the travel speed difference of vehi-cles that is about 8 km/h.
1 Introduction
The present speed limit system was introduced in 1971, and in 1997 it was largely the same. The system is a
space differentiated (30, 50, 70, 90, and 110 km/h) and
vehicle differentiated speed limit system. If we ignore the increases in speed limits as a result of changes in the road network, the only numerical change is that since 1 January 1995 heavy vehicles and vehicles with trailers have had 80 km/h as the maximum permissible speed, instead of the previous 70 km/h.
During the period 1971 1997, however, the 110 km/h limit was replaced by 90 km/h during certain
pe-riods: summer 1979 (all 110 km/h roads), summer 1989 (all 110 km/h roads), summer 1990 (all 110 km/h roads
except motorways where 110 km/h was retained) and summer 1991 (all ordinary two lane roads subject to 110 km/h). Motorways and expressways in the metropolitan regions were subject to a 90 km/h limit, instead of 110
km/h, between summer 1989 and May 1992.
Reduction of the speed limit during the summer pe-riods 1979 (for reasons of energy conservation) and 1989 (for reasons of traffic safety) can obviously be regarded as seasonal speed limits. In both cases, how-ever, no decision had been made as to what would be imposed after the summer. On the other hand, the re ductions in 1990 and 1991 were seasonal from the outset.
No direct evaluation of the traffic safety effects, if any, were made for summer 1990 and summer 1991. But,
generally speaking, it was found that the lower speed had a favourable traffic safety effect.
In the 19603 seasonal speed limits were common during summer and other holiday periods (e. g. 80 km/h during the Christmas and New Year periods) while there were no speed limits in Sweden on rural roads at other
times of the year.
Obviously, speed limits can be temporally differen tiated other than purely seasonally. Such speed limits are in force e.g. near schools during term time and school hours, or in extreme cases on access roads to movable bridges when these have beenopened.
Broadly speaking, temporal speed limits are rare; the most common is the 30 km/h limit instead of 50 km/h near schools during school hours. Automatic speed limit signs have not been used generally; development is still based on traditional signs.
Temporally differentiated speed limits are often cou-pled with winter road conditions. Speed limits in Finland have been lowered in winter since 1987. As a result of experience, both the lengths of the periods and the extent of the road network have progressively increased.
Speed in Finland has also decreased compared with
VTI RAPPORT 435A
previous winter periods. All roads subject to 120 km/h are reduced to 100 km/h, and 85% of roads with 100 km/h to 80 km/h. The period nowadays is from Novem-ber to February, but locally it may be extended to include October and/or March also. The criteria for the change are accident risk and hours of darkness.
The investigations made in Finland in 1987 1989 showed that the speed of cars had on average decreased by 5.2 km/h, and that accidents had been reduced by
14%. The decrease was greatest during periods when roads were free of snow and ice. Finland has thus de-monstrated that different years, regions/roads can be taken into consideration in choosing the length of the winter period.
There are thus two different times of the year when speeds were reduced for reasons of traffic safety, in summer in Sweden and in winter in Finland. Taken together, they result in general reductions in speed limit in order to cut the number of serious accidents in sum-mer and the number of accidents in winter.
1.1 The traffic safety situation week by week
The temporal variation ofthe traffic safety situation can be exemplified by the variation during the year of the weekly accident rate, the number of accidents reported to the police per one million vehicle km (Figure 1), and the number of injured per accident reported to the police (Figure 2). Normally, the accident rate is highest during the winter period while the number of injured per acci-dent is highest during the summer. The injury rate, the number of injured per one million vehicle km, which is the product of the accident rate and the number of in-jured per accident, is highest during the winter and sum-mer periods (Figure 3). The latter relationship is however a relatively weak one and is affected by the road con-dition situation in the winter period during the first and last months of the year.
Even though the figures relate to weekly values, the number of accidents will be of the order 300 and the number of injured of the order 200, which means that the true value of the accident rate and injury rate varies
by i10 15%, assuming that the number of accidents/ injured has a Poisson distribution (i 2,/Mean value) .
As will be seen, the weekly variation in accident rate
is between 0.3 and 0.8 accidents per million vehicle km, while the number ofinjured per accident varies between 0.4 and 0.9per accident, and the weekly injury rate variesfrom 0.2 to 0.4 injured per million vehicle km between different weeks.
12 0-8 0.7 0.5-Ac ci de ntra te 0.3 -0.2" 0.1" Figure 1 0.6 - ' 0.4 .1
12 3 4 5 6 7 8 910111213141516171819202122232425262728293031323334353637383940414243444546474849505152 Week
Accident rate per week during 1995 on the national road network.
0.9 0.8 l -I 1 :1 0.7 0.6 0.5 ' F:2 l 0.3 Num be r of in jur ed pe r acci de nt 9 m 1 O -L l Figure 2 I
1
W ,_ _ - , J 1 i ' i 1 i 1 1 1 ' 1 -1 .i 1 \ i 511 .. X -' H 1 : I II I I -= 1 \ 1 \ . 1 \1 5 = '1 y I1 i I l -: / . ( 1__
_a
: -m -m -m -I -_ -m -m |_ -m -_ -_ -l l -I -_ -I -' -_ -b , . H . _ -_ _ -_ _ _ -k -: -_ -_ -F -_ -_ -_ -v' i i ii i -' -_ -r 1 2 3 4 5 6 7 8 9 10 11 12 13 14 15 16 17 18 19 20 21 22 23 24 25 26 27 28 29 30 31 32 33 34 35 36 37 38 39 4O 41 42 43 44 45 46 47 48 49 50 51 0'!toNumber of injured per accident, per week, in 1995 on the national road network.
0.45 0.4 0.35 ' or" In jur y ra te 0.15 -0'1. em-gi on! m-_: / . i . Week Figure 3 01 12 3 4 5 6 7 a 910111213141516171819202122232425262728293031323334353637383940414243444546474849505152 Week
Injury rate per week in 1995 on the national road network.
1.2 Different strategies
It is thus seen that there is a large number of accidents in relation to traffic during the winter period, while there is a large number of injured per accident in the summer. In both cases, reduction in speed is a measure that re-duces the accident rate in winter and the large number of injured per accident in summer. Obviously, the num-ber of injured per accident in winter and the accident rate in summer are also affected. All in all, this means that there is less variation in injury rate over the year due to the reduction in the highest values.
The large number of injured per accident in summer has a strong coupling to the number of passengers per car which is appreciably higher in summer than in win-ter; this means that the probability of an injury in a re-ported traffic accident increases.
One question that can be asked is how stable are these accident indices over the year. There is some stability, but the variation between weeks may be large, especially in spring and autumn. However, if a season is to be defined, a week may be a convenient basis of division. It is thus quite possible that the speed limit system is reduced during both a winter and a summer period, e. g.
Week 49 to Week 10, and Week 25 to Week 32
(ob-viously, depending on the year in question).
The critical issue is the matter of signposting. Chan-ging the value of the speed limit four times a year will in the long run require a new type of Sign on which the number (e.g. only that of the tens) can be easily chan-ged/replaced. Naturally, the easiest way is to reduce the speed limit generally instead of changing the signs four times a year. This may however be interpreted by a large
number of drivers to mean that the reductions have
already been made, and that a further reduction is to be
a seasonal one. In principle, however, this applies re gardless of the general level.
The result would be a lower and more uniform injury rate over the year, which means that the prod-uct of accident rate and number of injured per accident
is constant, or
0 (accident rate) x (number of injured per accident) = injury rate = constant over the year, and where
0 (accidents/vehicle km) x (number of
injured/acci-dent) = number of injured/vehicle km.
One objection may be that we will have the same accident rate and the same number of injured per acci-dent over the year. This would then necessitate even stricter measures in winter and even stricter measures in summer, but the goal of an equalised injury rate is the same. A high injury rate also means that those who are injured sustain more severe injuries than when the in-jury rate is lower.
Obviously there are additional measures which have traffic safety effects similar to those of lower speed limits, for instance stricter requirements for the wearing of safety belts in summer, obligatory use ofapproved winter tyres during the winter period; these measures must also be tested to see if they lower the injury rate during the year and help in achieving the goal of no
fatalities or serious injuries in traffic (the zero vision ).
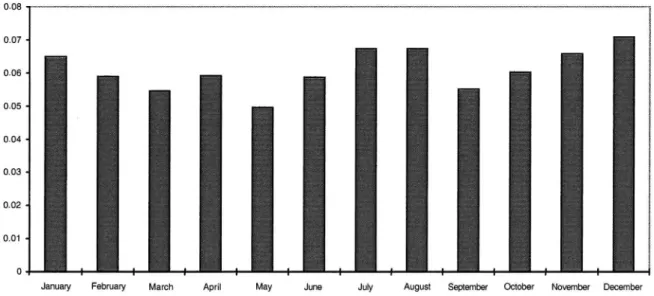
Figure 4 sets out the injury rate based only on the number of fatalities and severely injured by month in
1995. The pattern is the same as for all injured.
0.08 0.07 -0.06 4 0.05 0.04 0.03 0.02 0.01 -Figure 4
VTI RAPPORT 435A
January February March April May June July August September October November December
Injury rate forfatalities and severely injured in 1995 on the national road network.
2 Criteria for seasonal speed limits
2.1 Summer traffic and winter traffic
During the summer period vehicular traffic is heaviest in Sweden in spite of the fact that commercial traffic is much lower. At the same time, there is a much greater number of cars on the roads due to the holiday traffic. On some parts of the road network traffic is twice as high as during the Winter period, and this also holds for the number of passengers per car.
Even though the accident rate is much lower than in winter, the number of injured per accident is much higher in summer. This means that the injury rate is high in summer, on the whole as high as in winter, primarily on roads of high standard. This implies that, from the stand-point of traffic safety, a general reduction of the higher
speed limits, 110 and 90 km/h, is just as warranted in
summer as in winter.
2.2 Slippery road conditions
A rough analysis of VTI Bulletin No 794, Road con-ditions Traffic volume - Speed shows that, in absolute terms, the reduction in speed on slippery roads is no smaller on roads with a 70 km/h limit than on those with a 90 km/h limit. The 110 km/h speed limit was not ex-amined.
The results show that at the 90 km/h speed limit there is a tendency for speed to be adjusted to the limit; the mean speed, with no snow or ice on the road, is at the
same level as the speed limit. In relative terms, speed is
affected more by winter road conditions when the speed
limit is 70 km/h than when it is 90 km/h, or, in other
words, it is affected the more, the lower the mean speed is when the road is free of snow and ice.
These results run counter to the hypothesis that speed in winter road conditions is not in uenced by the speed limit.
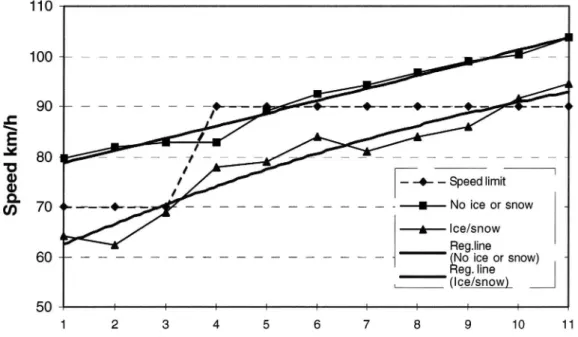
In Figure 5 the sites are ranked by speed limit and mean speed on roads free of snow and ice.
The maximum speed reduction in winter road con-ditions was used regardless of the classification of the icy/snowy road conditions.
If the mean speed on roads free of snow and ice is
a measure ofthe standard of the road, this implies that,
for the same speed limit, the effect of winter road con-ditions on speed decreases when the standard is
high-er. In VTI Bulletin No 826, 1997, it is also stated on the
basis of tests in Region North that the mean speed on icy/snowy roads was 2 6 km/h higher if the speed limit of 110 km/h was retained for the winter instead of 90 km/h. The reduction to 90 km/h was combined with cessation of salting on the southern section of E4 in Region North. The mean speed on the 110 km/h roads was 101 106 km/h when the roads were wet but free of snow or ice. On the whole, these results bear out the above results that the lower the speed/speed limit, the greater is the absolute reduction in speed in bad road conditions.
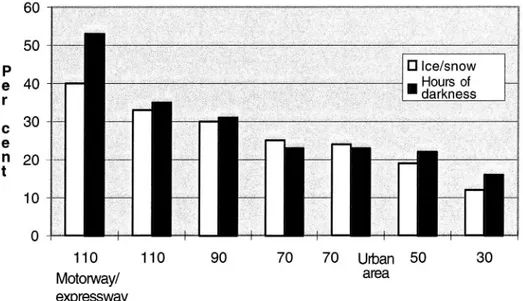
2.3 Slippery road conditions and darkness Previous investigations also show that the proportion of accidents in winter road conditions increases as the speed limit is raised. On motorways with 110 km/h the proportion of accidents is greatest. The same applies during hours of darkness (Figure 6).
1 1 O 100 - ~ 90 -.C \
E
x 80 _ a _ _ _ _ _ _ _ _ _ _ _ _ . U 3 - + - Speed limit (3' 70 4 _ _ _ _ . _. _ _ - I- NO ice or snow _ + Ice/snow Reg ne 60 -- ~ ~ * ~ ~ _ No ice or snow)- -99. line . (Ice/snow) 50 I I I I I I I I I 1 2 3 4 5 6 7 8 9 1O 11Figure 5 Dijj erence in the speed of cars on roads free of snow and ice and on icy/snowy
roads at 11 TU sites in 1991/92.
60 p I El Ice/snow Hours of S 40 .. _ darkness c 30 T
e
I,
10 4*- (v0
:
r
110 110 90 70 70 Urban 5O 30 Motorway/ area expresswayFigure 6 Accident percentages on slippery roads and in the dark on di erent types of roads.
What is evident is that the problem associated with darkness/road conditions is greatest on roads which have the highest speed limits but at the same time the lowest accident risks. Motorways and expressways with a 110 km/h speed limit have low accident rates while the number of injured per accident is high, and a very high proportion of accidents occurs in the dark/winter road conditions.
In principle, the proportions of traffic at 30 km/h on roads with winter conditions and during the hours of darkness are representative of conditions at all speeds. As will be seen, the risks of accidents on roads with a high speed limit are considerably higher during the hours of darkness/on slippery roads than in daylight/summer road conditions, which emphatically demonstrates that adjustment to darkness or slippery road conditions is reduced at higher speed limits. This is primarily the case during the winter when the combination of winter road
conditions and darkness is very prevalent.
This was previously discussed in e.g. Tests on tem-porally differentiated speed limits , VTI Bulletin No 607,
1990.
It was found that almost 80% of the reported injury accidents during the winter period occur during the hours of darkness or on slippery roads.
About 20% occur in daylight and on roads free of snow and ice, 25% in daylight and on slippery roads, 25% in the dark and on roads free of snow and ice, and 30% in the dark and on slippery roads.
2.4 The 24 hour period
All measurements of speed during the 24 hour period register higher speeds when traffic volumes are low than when there is a lot of traffic. This means that, on aver-age, speed on a given road is higher during the night than in daytime, in spite of the dark.
However, for comparable hours/traffic conditions, the situation is the opposite. Traffic during the hours of darkness involves lower speeds than daytime traffic. In spite of the lower speeds, the accident rate is appreciably
higher during the morning hours, in consequence of the
fact that other accident determinant factors such as
tiredness, alcohol, are also associated with the time of
day.
Accident rate at different hours of the day on the national road network in Sweden
12 3 4 5 6 7 8 9101112131415161718192021222324 in 1995 .93 3 'Ea: :2
8
< . n0:0 _
I
Time of dayFigure 7 Hourly variation in accident rate. National road network, 1995.
The highest accident rates during the 24 hour period occur during the night. During practically the whole year, it is dark during this period (2300 05 .00 hours). Because darkness, slippery road conditions, dirty windscreens etc occur to a considerably greater extent than in the summer, the accident and injury rates are higher during the winter. Regionally, however, these factors vary over the country and from year to year. On the other hand, conditions of darkness are the same every year
There is no doubt that high accident rates occur to an increasing extent as there are more hours of dark ness during the 24 hour period. Apart from darkness as such, temperature drops and there is a greater risk of snow or ice on the carriageway. In principle, this is synonymous with the winter period.
A lower speed limit during the winter period can thus, to a high degree, be tied to the hours of darkness during the 24 hour period in order that the traffic safety problem as a whole during this period may be tackled, while a lower speed limit during the summer can be associated with the extent of holiday/recreational traffic.
2.5 Hours of darkness
Even though everybody has the impression that winter involves higher risks of traffic accidents, this is obviously not the case generally, but there are variations between years and at the same place; there is however no variation in the hours of darkness.
From the winter speed measurements analysed in VTI
Bulletin No 794, the mean speed was calculated for each
hour between 05.00 and 09.00 hours and between 15.00 and 19.00 hours during the winter at the survey points.
Every hourly period was designated a daylight or dark-ness hour. The mean speed for all daylight and darkdark-ness hours was then calculated for every single hour for the period October March (Tables 1 and 2).
The background to this analysis is that during e.g. the hour 16.00 17.00, road users at the same survey point during the winter should be largely the same. At the beginning and end of the winter period, there was daylight during this hour, while in the middle of the period
it was dark. At the same time, it is obvious that road
conditions are on average worse in the middle of the winter period, which contributes to the speed being lower in the dark for the same traffic.
The intention was to elucidate the effect of darkness on speed. Owing to the diurnal variation in the
com-position of road users and traffic, the distribution of
speed during the hours of the day is U shaped. Broadly speaking, the shape is the same regardless of darkness
or daylight, although it is at a lower level in the dark;
however, this is mainly the case as regards the hours
analysed since, during the winter period, the hours be
tween 09.00 and 13.00 have daylight, and those between 19.00 and 05.00 darkness.
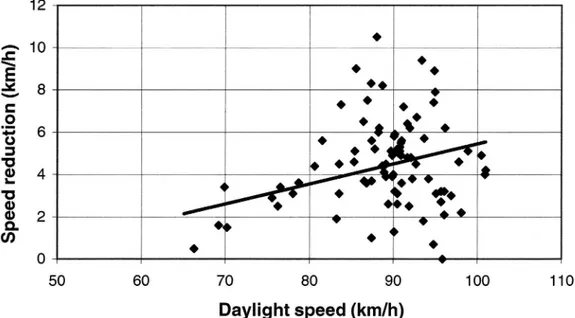
During the studied hours, the difference in speed in
winter between daylight and darkness hours is about 4
km/h (Figure 8).
In the regression analysis made in VTI Bulletin No 794, the daylight factor accounted for speed being about 3 km/h higher than during the hours of darkness. This also took into consideration road conditions and traffic volume. Hours of darkness thus have a lower speed than the corresponding daylight hours.
12 O E 10 \
E
E, 8 C.2
45 6 3 .O E 4 0 ", O 0 2 Q. «D a) O 0 50 6O 70 80 90 1 00 1 10Daylight speed (km/h)
Figure 8 Speed reduction in the dark in relation to speed in daylight for correspond-ing hours durcorrespond-ing the 1991/92 winter period.
Table 1
VTI RAPPORT 435A
Mean speed ofcars during morning hours in winter at di erent survey points.
13/161 8/133 12/141 12/157 15/139 10/156 8/102 14/71 15/107 106/70 81/65 92/61 105/65 86/63 89/77 62/61 56/42 64/67 44/120 21/45 41/120 39/114 61/113 50/97 48/103 60/108 50/101 42/125 35/91 34/54 39/90 130/23 142/10 146/20 95/29 75/25 76/38 17
Table 2 18 128/25 102/30 63/42 63/68
50/120 M 1'
26/55 50/114 39/114 47/132 42/108 46/108 65/110 45/73 56/114 38/84 30/86 23/113Mean speed of cars during afternoon hours in winter at different survey points.
V
'1 103/67 I
48/41 98/66 90/65 98/81 90/61 82/70 109/65 53/32 100/70 67/66 50/61 35/9916/151
10/73 16/147 23/130 16/164 9/141 14/140 13/162 12/141 20/153 15/102 8/112 9/124 RAPPORT 435AIf a lower speed limit is imposed, this must not be
taken to mean, for instance, that winter road
manage-ment need not be improved or that other measures need not be taken. At the same time, major roads may have a speed limit system with more temporal differentiation than roads of lesser importance.
In purely practical terms, the question is whether the speed limit should be lowered by 10 or 20 km/h, i.e. whether a speed reduction of 2 4 or 4 8 km/h is to be achieved, which represents the normal reaction of driv-ers. A reasonable suggestion is that 110 km/h should be lowered to 90 km/h and 90 km/h to 80 km/h during a winter and summer period respectively, provided that the speed limit system is not generally altered before this time.
VTI RAPPORT 435A
The problem associated with hours of darkness has been touched upon above, and in regard to seasonal speed limits, lower speedlimits can obviously apply during the hours of darkness or during a night period, with the same effect as above. The proposal made in VTI Bulletin No 607, 1990 was that the speed limit in
force when it is dark, i.e. between 21.00 and 05.00
hours, should be 10 km/h lower than that shown on the speed limit signs irrespective of light conditions, which should not in actual fact require any alteration of signs
but a continuous information campaign, but at the same
time no consideration should be given to road conditions. The investigation in the following can be seen against this background.
3 The object of the investigation
Generally speaking, the lower the speed limit, the lower
is speed. Also, speeds on roads with winter conditions
are on the whole lower than on roads free of snow and ice. These two findings may give rise to the argument that the speed limit makes no difference in winter road conditions if the level of speed on winter roads is lower than that achieved by lowering the speed limit. The higher the level of speed on roads free of snow and ice, the greater is the absolute reduction in speed that is
obtained in winter road conditions, which also follows
from the above provided that the road environment is the same . The darkness factor may explain this to a certain extent since there is a positive correlation be-tween darkness and slippery road conditions.
However, the accident and injury situation, and also speed measurements, show that in spite of this adjust-ment to slippery road conditions (and darkness), the adjustment is not sufficient.
The figures below illustrate this, together with the situation that is desirable.
HYPOTHESIS A Roads free of
snow and ice Slippery road Roads free of
_ conditions snow and ice
High speed level Low speed level
HYPOTHES'S B Roads free of Slippery road Roads free of _ snow and ice conditions snow and ice High speed level
Low speed level M
In actual fact, there is no argument in favour ofHy-pothesis B if a lower speed limit results in the same speed level as that which occurs in slippery road conditions. Hypothesis B implies that a lower speed limit results in further reduction of speed in slippery road conditions.
20
At the same time, there are naturally other situations
which do not result in such a large speed reduction, e. g. wet road conditions combined with darkness, and where a further reduction in speed level would be achieved by lowering the speed limit.
The best way of taking winter road conditions into account is to reduce the speed limit during precisely this period and for the road network to which it applies. But if the normal speed level in these road conditions is lower than the reduced speed limit according to Hypothesis A, this would mean that lowering of the speed limit was unnecessary. Presumably, this is not the case until the speed limit is reduced by 30 50 km/h.
Vehicular traffic in winter road conditions is only a small proportion of vehicular traffic during the winter period as a whole, but this obviously varies between the north and south of Sweden. The smaller the proportion of vehicular traffic that occurs in a region in slippery conditions, the greater is the accident risk in slippery conditions. The reason for this is, or it may be inter-preted to mean, that the adaptation problem (element of surprise) posed by slippery road conditions is the greater,
the more infrequently these occur, while at the same time
friction is usually lower (temperatures near zero or about the ice melting capacity of road salt). In regard to traf-fic accidents, this means that the proportion of accidents on slippery roads does not vary appreciably between different parts of Sweden during a winter period.
Lowering of the speed limit in View of seasonal
ac-cident and injury rates and dark conditions would
prob-ably be the temporal differentiation that is best suited to the present speed limit system.
4 Investigation method
The following project was carried out in order to address directly the thrust ofthe investigation commissioned by the National Road Administration, However, what fully determines whether it can be meaningful to have further discussions is whether a lower speed limit affects the speed of the driver or whether he adapts his speed to road and weather conditions to such an extent that a lower limit has no signi cance .
During the winter of 1996/97, running speeds were measured on five pairs of road sections on which each ofthe pair had different speed limits (110 90 km/h, 110 70 km/h, 90 70 km/h). The measurements were made during at least two daylight periods and on roads free of snow or ice and on roads with winter conditions. The pairs of road section were selected so that they had the same traffic and standard but differed in regard to traffic environment, e. g. major intersection or small town, and had different speed limits. At the same time, friction measurements were made on the roads with winter conditions.
The actual observations were made with video cam-eras from site huts erected in advance at the beginning and end of each section. The sections were at least 2 km long. The video cameras were also used to document road conditions.
The hypothesis to be proved is that the speed at the higher speed limit, in slippery road conditions, is the same as at the lower speed limit.
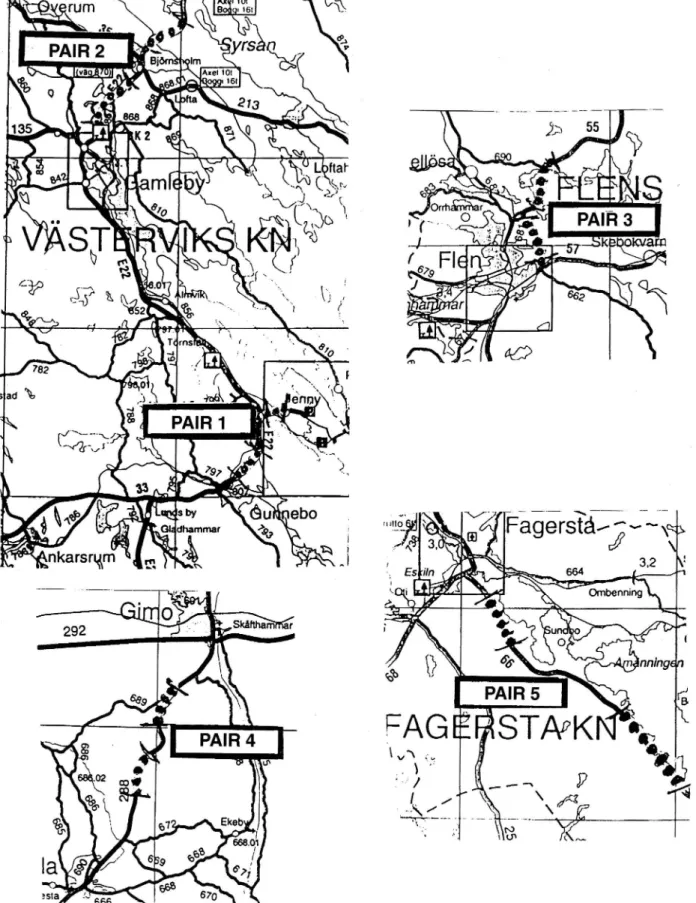
4.1 Choice of road sections
The original choice of sections also contained a further section of European Route E4 in Norrbotten, but for
practical reasons this was excluded.
The five pairs ofsections finally selected are as
fol-Pair 1: E22, Gunnebo Vastervik approach road, 110 km/h, and the first part of the approach road to
Vastervik, 70 km/h.
Pair 2: E22 south of Bjornshohn, 90 km/h, and E22
north of Bjornsholm, 110 km/h.
Pair 3: Trunk road 55 immediately to the north of Flen, 70 km/h, and trunk road 55 further north at Yxtaholm, 90 km/h.
Pair 4: Local road 288 south of Gimo, 90 km/h, and further south to the north ofAlunda, 70 km/h. Pair 5: Trunk road 65 south of Fagersta, 90 km/h,
and further south, 110 km/h.
There is little difference in stande between the pairs, even though there may be other reasons for different speed limits.
These pairs will be referred to as Pair 1 (110 70 km/h) Pair 2 (90 110 km/h) Pair 3 (70 90 km/h) Pair 4 (90 70 km/h) Pair 5 (90 110 km/h)
On average, this means about 100 200 vehicle pas-sages/hour and direction during the measurement pe-riods. During the winter period there is no major diffe-rence in traf c between the roads. On the pairs of sec-tions, the road width and, broadly speaking, the alignment are the same, while building development (exits) occur more often on that part of the pair which has the lower speed limit. In the analysis a distinction is made regarding direction since this may at times affect the speed level. Details of the pairs of sections are set out in Table 3
lows: and Figure 9.
Table 3 Lengths, tra zc and road widths ofthe sections.
Pair 1 Pair 2 Pair 3 Pair 4 Pair 5 (1 10 70) (90 1 10) (70 90) (90 70) (1 10-90) Length 70 km/h 1,720 m 2,040 m 2,140 m Length 90 km/h 2,340 m 3,160 m 1,560 m 3,980 In Lenght 110 km/h 1,440 m 3,660 m 6,640 m Cars/AMD 6,220 c/d 4,200 4,850 c/d 3,490 c/d 3,020-3,220 C/d 3,400 c/d Lorries/AMD 660 l/d 340 380 l/d 380 l/d 250 270 l/d 250 l/d Road Width 13 m 13 m 8 m 8 m 11 12 m
22 ' o- m ' ' s 10: ' g éégaggn «gf au.m . v \ 07 . 0
_ lam~s
. 816m lmrat-mam
I S b' , u \u ..
yr
h A18! 0! i 16 \ 2V
haaersta,a» m
~
J
\
3 2 5 - 664 ' OmeMg UKFigure 9 The selected sections in the ve pairs during the 1996/97 winter period.
5 Procedure
During the early winter of 1996/97, four site huts were erected at each pair of sections, one at the beginning and
one at the end of each section. Before all huts were
erected, the measurement procedure was tested in the
V'astervik region, and measurements were at the same time made there in the middle of November (sleet).
Winter arrived in the south of Sweden around the
13th of December and continued over Christmas. Owing to dark conditions and the Christmas holidays, measure-ments were not made until the new year during continued
winter conditions. In central Sweden, however, winter
eased off, and no sustained periods of snowfall occurred during the rest of the winter.
It was not until the end ofthe winter that we managed
to coordinate the measurements with the occurrence of winter road conditions on some occasions.
Friction measurements were also made at the same time.
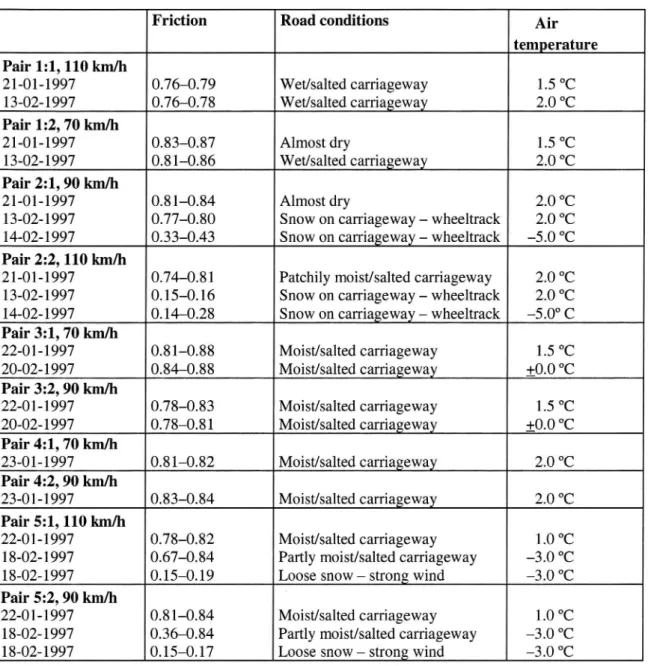
5.1 Friction measurements
Friction measurements were made with the friction test
vehicle BV 14. The measured length was 1 400 m of
the section, and seven successive measurements were
obtained, one for every 200 m length. Measurements
were made in both directions and in each wheeltrack. This means that Table 5 shows the variation in the mean of four valueswhich are each based on seven measure-ments. The values of friction set out were measured at
the speed of the speed limit. Measurements were also
made at 70 km/h on all sections. The values obtained are normally between 0 and 1. Most measurements were
made on a partly wet carriageway, with the result that friction is lower than on a dry carriageway which nor-mally has friction in excess of 0.85. Friction values between 0.1 and 0.2 indicate that it is very slippery in the form of polished ice/snow. This occurred in Pair 2
at Bjornsholm (13 14/2) and in Pair 5 at Fagersta (18/2).
Table 4 Times ofmeasurement in each pair during winter [996/97.
Times of measurement during winter 1996/97 Road free of snow and ice Winter road conditions
Pair 1 (110 70 km/h) 21-01-1997 .19-11-1996, 13-02-1997
Pair 2 (90 1 10 km/h) 21 01-1997 13-02-1997, 14-02-1997
Pair 3 (70 90 km/h) 22-01-1997 20 02 1997
Pair 4 (90 70 km/h) 23-01-1997
Pair 5 (110 90 km/h) 22-01-1997 18-02-1997
Table 5 Measured friction values, visuallyobserved road conditions and air temperature. Friction Road conditions Air
temperature Pair 1:1, 110 km/h 21-01-1997 0.76 0.79 Wet/salted carriageway 1.5 °C 13-02-1997 0.76 0.78 Wet/salted carriageway 2.0 °C Pair 1:2, 70 km/h 21-01-1997 0.83 0.87 Almost dry 1.5 °C 13-02-1997 0.81 0.86 Wet/salted carriageway 2.0 °C Pair 2:1, 90 km/h 21-01-1997 0.81 0.84 Almost dry 2.0 °C
13-02-1997 0.77 0.80 Snow on carriageway wheeltrack 2.0 °C 14-02-1997 0.33 0.43 Snow on carriageway wheeltrack -5.0 °C
Pair 2:2, 110 km/h
21-01-1997 0.74 0.81 Patchily moist/ salted carriageway 2.0 °C 13 02-1997 0.15 0. 16 Snow on carriageway wheeltrack 2.0 C 14-02-1997 0.14 0.28 Snow on carriageway wheeltrack -5.0° C Pair 3:1, 70 km/h
22-01-1997 0.81 0.88 Moist/salted carriageway 1.5 °C
20-02-1997 0.84 0.88 Moist/salted carriageway :00 °C
Pair 3:2, 90 km/h
22-01-1997 0.78 0.83 Moist/salted carriageway 1.5 °C
20-02-1997 0.78-0.81 Moist/salted carriageway i0.0 °C
Pair 4:1, 70 km/h 23-01-1997 0.81 0.82 Moist/salted carriageway 2.0 °C Pair 4:2, 90 km/h 23-01-1997 0.83 0.84 Moist/salted carriageway 2.0 °C Pair 5:1, 110 km/h 22-01-1997 0.78 0.82 Moist/salted carriageway 1.0 °C
18-02-1997 0.67 0.84 Partly moist/salted carriageway 3.0 °C
18-02-1997 0.15 0.19 Loose snow strong wind 3.0 °C Pair 5:2, 90 km/h
22-01-1997 0.81 0.84 Moist/salted carriageway 1.0 °C
18-02-1997 0.36 0.84 Partly moist/salted carriageway 3.0 °C
18-02-1997 0.15-0.17 Loose snow strong wind 3.0 °C
In most cases, the temperature of the carriageway was below 0°C. The measurements represent the win-ter period at the beginning of 1997 in central Sweden. The absence of longer continuous periods of snowfall was general in spite of the fact that the temperature was
often around zero and lower. On some occasions, the
friction measurements managed to cover periods when friction was very low.
5.2 Video measurements - Speed
At the times of measurement, video cameras were placed in the four site huts. These filmed passing vehicles through the window and registered the time of passage. The site huts were in place during the whole winter. As
will be seen above, measurements were made only on
weekdays and for 3 6 hours during daylight. The video
measurements cover more measurement events than the friction measurements.
24
During the evaluation which is comprehensive, the
four films obtained are shown simultaneously on four TV sets, and the times of passage for each identified vehicle are given. Since the distance between the site huts is known, the travel speed of the vehicles passing through the section can be calculated and compared with the running speed on the other section, provided that the vehicle is identified on this section also. In principle, it is only the vehicles which travel over both sections at the same time and have beenidentified which have been analysed regarding running speeds on the two sections in the pair.
By aggregating the travel speeds of all vehicles on each and every one of the sections in the pair and com-paring the travel speed levels in periods with different road conditions, the effect of road conditions on speed can be elucidated. It would have been even more inter esting if the vehicles and drivers had been identified
between different measurement events, but this was not done.
At least one measurement period was defined as road
conditions without snow and ice. On some of the sec-tions there were no real winter road condisec-tions, and in
some cases rain or a wet carriageway was the period defined as a period with no snow or ice. Note that the measurements were made in daylight, broadly between
09.00 and 15.00 hours, and normally cover three hours
video filming.
5.2.1 Different methods of estimating speed It is fairly unusual for speed measurements to be made by measuring running speed. In some cases, spot speeds are converted into running speeds. The usual reason is that measurements of running speed over a longer distance require some kind of identification, which cannot be done in measurements using pneumatic tubes since it is impossible to distinguish between cars with the same wheelbase. The running speed is normally lower than the corresponding spot speed, but this obviously varies due to the spread in the speed ofdifferent vehicles.
If all vehicles have the same speed, then the running
speed and spot speed are the same.
The investigation is thus a direct measurement of the average runningspeed over the sections of
approxi-mately 2 km length. Another advantage ofthe measuring
procedure is that road conditions are thought not to af-fect the measurements, which is the case when pneu-matic tubes are used. This latter fact was perhaps the most telling argument in favour of the measurement method chosen.
In the investigation, the time of passage was noted for the observed cars.
Because the vehicles were identified at both ends of
both sections, with video cameras and synchronised clocks, the running time could be calculated for each
VTI RAPPORT 435A
and every one of the sections and for each direction. The length of one of the sections was 3 660 m and the number of cars registered in one direction was 143. For each vehicle the time of passage in seconds was available. By ranking the times of passage by size, the median running time was found to be 123 seconds, and the median speed (the 73rd observation by size) = 107.12 km/h.
The mean time of passage was 124.41 seconds, with a standard deviation of 15.86 seconds.
This gives a harmonic mean speed of 105.9 : 2.2 km/h.
The ordinary mean speed is 107.53 km/h with a standard deviation of 13.05 km/h, which gives an esti-mate of 107.53 : 2.14 km/h.
In the results the mean speed over the section is given according to the latter method.
This means that the differences in speed between the different speed limits and/or road conditions are all signif-icant at the 5% risk level.
None of the sections was investigated at times of heavy traffic but, broadly speaking, in the middle of the day and on weekdays, owing to the fact that video lming necessitated daylight conditions.
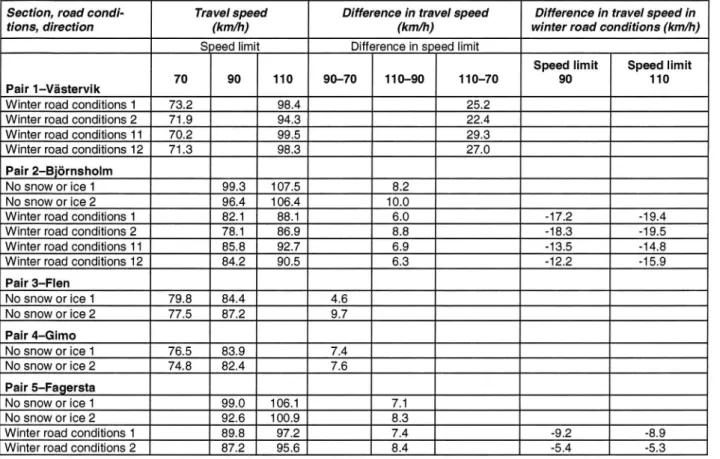
5.3 Travel speed of same vehicle on both sec ons
Table 6 sets out the distribution of measurements over the different pairs, speed limits and road conditions. The table shows the differences in running speed obtained as a consequence of different speed limits and the effect of winter road conditions on running speed.
The table shows that there is a stable speed difference irrespective of road conditions between the sections in each pair which were equivalent in all respects other than the speed limits.
Table 6 Travel speed of identified vehicles which passed through each section in the pair; with respect to
speed limit, road conditions and direction.
Section, road condi- Travel speed Difference in travel speed Difference in travel speed in
tions, direction (km/h) (km/h) winter road conditions (km/h)
S eed limit Difference in speed limit
Speed limit Speed limit
_ _ 70 90 110 90 70 110 90 110-70 90 110
Pair 1 Vastervik
Winter road conditions 1 73.2 98.4 25.2
Winter road conditions 2 71.9 94.3 22.4
Winter road conditions 11 70.2 99.5 29.3
Winter road conditions 12 71.3 98.3 27.0
Pair 2-Bj6rnsholm
No snow or ice 1 99.3 107.5 8.2
No snow or ice 2 96.4 106.4 10.0
Winter road conditions 1 82.1 88.1 6.0 -17.2 -19.4
Winter road conditions 2 78.1 86.9 8.8 -18.3 -19.5
Winter road conditions 11 85.8 92.7 6.9 -13.5 -14.8
Winter road conditions 12 84.2 90.5 6.3 -12.2 -15.9
Pair 3 Flen No snow or ice 1 79.8 84.4 4.6 No snow or ice 2 77.5 87.2 9.7 Pair 4-Gimo No snow or ice 1 76.5 83.9 7.4 No snow or ice 2 74.8 82.4 7.6 Pair 5 Fagersta No snow or ice 1 99.0 106.1 7.1 No snow or ice 2 92.6 100.9 8.3
Winter road conditions 1 89.8 97.2 7.4 -9.2 89
Winter road conditions 2 87.2 95.6 8.4 -5.4 -5.3
5.3.1 Cumulative speed distribution
By comparing the cumulative speed distributions, we can gain an idea whether speed distribution has been shifted sideways or in some other way. It is seen from the figures in Appendix No 1 that, by and large, speed distribution is shifted sideways to a lower speed when the speed limit is lowered or road conditions deteriorate. This is illus-trated by Figure 10 which plots the cumulative running speed distribution on the 90 and 110 km/h sections at Bjornsholm on roads both with no snow or ice and with slippery conditions.
The difference in speed due to differences in speed limit persists all the time even when road conditions are
26
very bad, while at the same time there is a tendency for the scatter in speeds to decrease at a low mean speed,
or to increase at a high mean speed. This is borne out by measurements at Bjernsholm on roads with no snow or ice and with winter road conditions. The pairs of curves represent different directions.
The figures demonstrate that the scatter in running speeds between vehicles is relatively large for one and the same speed limit. Figure 11 sets out the standard deviation in running speed as a function of mean travel speed.
The standard deviation in travel speed is 11 12% of the mean running speed.
Bjornsholm, 110/90, roads free of snow and ice or with winter conditions, and by direction 1.0 0.9 0.8 0.7 0.6 0.5
90 km/h, winter road conditions
110 km/h, road free of snow or ice
90 km/h, road free of snow or ice
0.4 110 km/h, winter road conditions
0.3 0.2 0.1 Pr op or ti on 0.0 50 60 70 80 90 1 00 1 1O 1 20 130 140 150 Running speed (km/h) A 0
Cumulative speed distribution on roads free of snow and ice or with winter conditions, and by direction, at Bjornsholm.
0.21.
E
Q N Q 14 12 10 .0 St an da rd de vi at io n (k m/ h) O R B -{> 0 3 3 } 70 75 80 85 90 95 1 00 105 1 10Mean running speed (km/h)
Figure 11 Standard deviation of running speed as a function of mean running speed
Bjornsholm, roads free of snow and ice or with winter conditions. Winter 96/97
1.0 0.9
110 to 90 km/h, winter road conditions 110 to 90 km/h mfad
0.8 free of snow and Ice
0.7 90 to 110 km/h, road
.5 Ola free of snow and ice
5
Q 0.5E 0.4
90 to 110 km/h, 0.3 road conditions 0.2 0.1 0.0 -2o -10 o 10 20 30 40Difference in running speed (km/h)
Figure 12 Distribution functions for roads free ofsnow and ice at ij rnsholm for the difference in running speed between 110 and 90 km/h.
5.3.2 Variation in running speed difference for
the same vehicle on roads free of snow and ice and with winter conditions It is interesting to study in Figure 12 how the speed between the sections correlates for individual vehicles. It would not have been entirely strange to assume that the correlation is high, i.e. that the speed for all cars is about 7 8 km/h higher on the 110 km/h road than that on the 90 km/h road for the same vehicle. Figure 12 sets out the distribution functions for the pair of sec-tions at Bjornsholm, one of which has the speed limit 90 km/h and the other the limit 110 km/h, for roads free of snow and ice and with winter conditions.
It is seen that the correlation in speed for the indi vidual car on the two sections in the pair is fairly low
irrespective of road conditions. For traffic as a whole,
speed is higher at a speed limit of 110 km/h. On the other hand this clear difference is not present for the individual cars. The figure shows that about 10% of vehicles drove at a lower speed on the 110 km/h section than on the 90 km/h section, and over 10% drove more than 20 km/h faster on the 110 km/h section.
In order to study this in greater detail, the differences
in the speeds of cars at Gimo, at the limits of 90 and 70
km/h and in both directions, are plotted in Figure 13. The results are the same as those in Figure 12.
To the south of Fagersta, the running speed on roads both free of snow and ice and with winter conditions was studied. The running speed on roads free of snow and ice and with winter conditions, for both directions, is plotted in Figure 14.
It is evident from the above that the same
phenom-enon also occurs on the latter sections, in spite of the
fact that the lengths of these sections are 3 980 m and 6 640 m, and there is a gap of 6 500 In between the sections at Fagersta. The difference in speed is thus by no means the same on different sections with different speed limits, but hasan unexpectedly large variation irrespective of road conditions or direction. One way of elucidating this is to analyse the scatter in running speed difference between the two sections; the results are set out in Figure 15.
Gimo, road free of snow and ice, winter 96/97
70 to 90 km/h Pr op or ti on 9 . 0 9 . 0 9 . 0 9 . 0 p r O l e -b U I C D N C D C O O -1O -5 O 5 90 to 70 km/h 1 0 1 5 20 25 30
Change in running speed by direction (km/h)
Figure 13 Distribution function for difference in running speed between the 90 and 70 km/h sections for travel in both directions.
Fagersta, road free of snow and ice and with winter conditions, winter 96/97
Pr op or ti on 9 . 0 9 . 0 9 . 0 9 . 0 p r o ém wn m m wm o o -10 -5 0 5 1 O 1 5 20 25 30
Change in running speed by direction (km/h), 110 90 km/h
Figure 14 Distributionfunction for di erence in speed between the 110 and 90 km/h sectionsfor different road conditions and directions.
It will be seen from Figure 15 that extrapolation to a difference in running speed = 0 shows that the standard deviation in running speed difference between the two
VTI g 12 / d) /
%
'05 10 Q g: (D 1; v .9 2> a: . 03: 6 '1': 13 E 4 '0S
a; 2 O O 5 1O 15 20 25 30Difference in running speed (km/h)
Figure 15 Standard deviation ofdifference between running speeds on the two sections as a function ofthe di erence in running speeds.
sections is of the order of 6 km/h, and that, naturally, the standard deviation increases as the difference in running speeds increases.
6 Conclusions
The large variation in the running speeds of cars be-tween two otherwise equivalent sections which have different speed limits shows that the difference in speed is more a random phenomenon than one governed by
the difference in speed limits. In contrast, the difference
in speed distributions on the two sections is a function
of the speed limit, and the mean value of the speed
distribution is higher for a higher speed limit.
In both practical and theoretical terms, this is
signif-icant and implies that random variation in traffic in regard to the speed of vehicles is considerably greater than previously known. At the same time, the choice of selec-tive measures directed at certain groups of vehicles and drivers is made more difficult since these measures cannot be automatically related to the group that drives fast or slowly.
30
The initial hypothesis of the investigation, that vehicles are driven at the same low speed in very bad road conditions, irrespective ofthe speed limit, can be rejected as regards speed distribution, but it is obviously true for a group of vehicles. But it is equally true that a small group ofvehicles in actualfact reduce their speed in spite ofa higher speed limit, but that a major-ity drive at a higher speed, and some at a much higher speed, at the higher speed limit than is the case at the lower speed limit.
The investigation thus demonstrates that the speed
behaviour of an individual car (driver) varies greatly
and is to a high degree in uenced byfactors other than the speed limit. However; the speed oftraf c, the mean running speed or the speed distribution for all cars, is very greatly dependent on the speed limit in force.
7 Literature
Moller, S: Véiglag Trafikfliide Hastighet. (Road
conditions Traffic ow Speed). (In Swedish).
VTI Bulletin No 794. Swedish National Road and Transport Research Institute. Linkoping, 1996. Nilsson, G: F rsiik med tidsdifferentierade
hastig-hetsgranser (Tests on temporally
differenti-ated speed limits). (In Swedish). VTI Bulletin No
607. Swedish National Road and Transport
Re-search Institute. Linkoping, 1990.
VTI RAPPORT 435A
Wretling, P., Oberg, G: Effekt pa vaglag och hastighet
av osaltad vintervaghallning och séinkt hastig-hetsgréins. (Effect on road conditions and speed due to winter road management with no road salt
and reduced speed limits). (In Swedish). VTI
Bul-letin No 826. Swedish National Road and Trans-port Research Institute. Linkoping, 1997.
Appendix 1
Page 1(4)
Comparison of cumulative speed distributions on the
different pairs and in different road conditions
1.0 . _ 1 f .0 C
0.9
n
'1
VASTERVIK,PAIR 1, winter road '
08 conditions 2 I 0.7 II
l
S '70 km/hl r110km/hl gQ 0.5
I
e
l
m 0.4 0.3 0.2 0.1 I.r -r
y
0.0 ' I A 40 50 60 70 80 90 100 110 120 130 140 km/hFigure 1:1 Va'stervik. Comparison of 70 110 km/h in winter road conditions. I III .5 ' J' 0.9 0.8 _ .. BJORNSHOLM, PAIR 2,
0.7- road with no snow or ice
0.6 c .9
E
g 0.5E
IE km/h
110 km/h
0.4 0.3 0.2 0.10.0
50 60 70-
80 90.
100 110 120 130 140 150 km/hFigure 1:2 Bjornsholm. Comparison of 90 110 km/h on road with no
snow or ice.
Pr op or ti on Appendix 1 Page 2(4)
1. ' ° = O (l o O I. J.0. 0.9 BJéRNSHOLM,
PAIR 2, winter road
.0
conditions (13.2) 0.8 0.7 0.6 0.5 90 km/h 110 km/h 0.4 0.3 0.2 0.1 o_o . 1 . 50 60 7O 80 90 100 110 120 130 140 150 km/h
Figure 1:3 Bjornsholm. Comparison of 90 110 km/h in winter road
Pr op or ti on conditions (13-2-1997).
1.0 I? 35 0.9 BJORNSHOLM, r
PAIR 2,_ winter road
0_8_ conditions (14.2) I
1"
0.6 0.5 90 km/h l l I 110 km/h 0.3 I 0.2 0.1 .0 0.0 "I" . 50 6O 70 80 90 100 110 120 130 140 150 km/hFigure 1:4 Bjornsholm. Comparison of90 and 110 km/h in winter road conditions {14-2-1997).
VTI Appendix 1 Page 3(4) 1.0 . . .I;.Ill Iv
J"
0.9 FAGERSTA, PAIR 5, no snow or ice 0.8" 0.7 I 0.6 c .9 t I a 0.5 e |_90 km/h l 110 km/h 0. 0.4 '1 0.3 l 0.2 0.1 I, 0.0 ' . 50 60 70 80 90 100 110 120 130 140 km/h 150Figure 1:5 Fagersta. Comparison of 90 and 110 km/h on roads with no
snow or ice.
1.0 I l J 6' .ull °
0 9-___ FAGERSTA, PAIR 5, ' winter road conditions
0.8 I 0.7 0.6 r c .2 t a 0.5 e l 90 km/h_| 110 km/hl D. 0.4 0.3 0.2 , 0.1 I)! O 0.0 - o I l i .-50 60 70 80 90 100 110 120 130 140 km/h 150
Figure 1:6 Fagersta. Comparison of 90 and 110 km/h in winter road conditions.
Appendix 1
Page 4(4) 1.0 ..
: .-'
g . O 0.9 : g 3 FLEN, !03- PAIR 3, no snow or ice H.
0.7 f; I} g } 0.6 t c f Jll .2
t
a 0.5i
L
0.4
{a
t
013 E? Jfrg
g .I'.3 f
0.1 .P i,3"!
-Ioo 0
° ' "F
40 50 60 70 80 90 100 110 120 km/hFigure 1:7 Flen. Comparison of 70 and 90 km/h on roads with no snow or
1C6. 1.0 0
M
0.9 0.8 GIMO,PAIR 4, no snow or ice
0.7 0.6 0.5 Pr op or ti on 70 km/h
90 km/h 0.4 0.3 0.2 0.1 0.0-40
Figure 1:8 Gimo. Comparison of 70 and 90 km/h on roads with no snow or
50
1C6.
60 70 80
km/h
90 1 00 110 120