http://www.diva-portal.org
Postprint
This is the accepted version of a paper published in Energy Procedia. This paper has
been peer-reviewed but does not include the final publisher proof-corrections or journal
pagination.
Citation for the original published paper (version of record):
Song, J., Wallin, F., Li, H., Karlsson, B. (2015)
Price models of district heating in Sweden
Energy Procedia, 88: 100-105
https://doi.org/10.1016/j.egypro.2016.06.031
Access to the published version may require subscription.
N.B. When citing this work, cite the original published paper.
Permanent link to this version:
Low-carbon Cities and Urban Energy systems CUE2015, Nov 15-17, 2015, Fuzhou, China
Paper ID: CUE2015-174
PRICE MODELS OF DISTRICT HEATING IN SWEDEN
Jingjing Song1, Fredrik Wallin1, Hailong Li1, Björn Karlsson1 1 Mälardalen University, Västerås, Sweden
ABSTRACT
Traditional pricing scheme of district heating is based on previous experience of system operation. This strategy does not work well under the circumstances of decreasing demand and shifting consumption pattern. Therefore new pricing strategies are needed. To have a comprehensive view on existing price models in Sweden, a price model survey was carried out among all members of the district heating quality system REKO. Four basic price components and multiple variants of them are detected in the survey. The result also shows that most of the district heating companies still use traditional methods and do not consider their customers’ consumption pattern while charging them.
Keywords: District heating, price model, model survey,
price component
NONMENCLATURE
AbbreviationDH District Heating
FxC Fixed Component
LDC Load Demand Component
EDC Energy Demand Component
FDC Flow Demand Component
1. INTRODUCTION
District Heating (DH) companies are used to set price basing on experience of system operation and expectation of fuel price development. This strategy works fine if there is no major shift in the energy system.
Nowadays factors such as more strict building regulation and energy conservation measures are arising and shifting the heating demand in certain ways, which in turn, might not only expose DH companies to higher risk level, but could also lead to negative impact on environment [1].
Some companies already realized this challenge, and started to adapt their pricing schemes in expectation of impact users’ behavior and lower their own risk level. But whether these adaptions are self-serving tools for DH companies or could benefit all stake-holders need to be investigated through comprehensive research. In 2015, a review over different pricing principles in both regulated and deregulated markets has been made [2]; during 2011, a
master thesis about price model survey was also carried out [3].
In comparison with this earlier price model survey, this paper structured and categorized different pricing schemes into four price component groups, including both energy related and load related components, thereby released the perspective from the dualism of variable (consumption related) vs. fixed (non-consumption related) structure. The result gives a better review on all pricing schemes in use from a more scientific perspective.
2. METHOD
2.1 Data Collection
REKO is a certification mark issued by Swedish District Heating Association, 80 DH companies are certified members, including all big companies in Sweden. The heat production of REKO-marked companies accounts for 85% of yearly production in Sweden [4]. Therefore, using them as representatives is considered both sufficient and efficient.
Information of 248 pricing schemes from 80 REKO members is collected from every district heating company’s website during December 2014.
2.2 Proportion between Price Components
The proportion between different price components is also interesting, yet without detailed information of all users’ consumption data within one DH system, it is difficult to detect the exact income from each price component. But it
Figure 1. DH consumption distribution of the template
building over a normal year. 0,0 10,0 20,0 30,0 Jan Feb Mar Ap r Maj Ju n Ju l A u g Se p O kt N o v De c MWh
Paper ID: CUE2015-174
2 Copyright © 2015 by CUE2015
is possible to calculate through a number of assumptions to have an approximate idea of the distribution.
Therefore, a fictional multi-family house is used as template to get a rough glimpse over the proportion between different components. Assumptions below have been made regarding the template building:
Yearly DH consumption is 193 MWh;
25% of which is used for domestic hot water and distributed evenly throughout the year;
The rest is space heating, distributed in proportion to degree-days over a normal year. Degree-days of each month is calculated from Västerås’s weather statistic documented by SMHI between 1960 and 2014 (see Figure 1).
But 11 of the pricing schemes require more detailed assumptions (daily average / hourly average consumption) which is not suitable to make at this stage, so they are excluded from the result.
3. RESULT
3.1 Fixed Component
Fixed component (FxC) is the fixed price a user need to pay for being connected to the network. Sixty percent of investigated pricing schemes have FxC, the rest (40%) of them have no such component. Most companies seem to use this component to cover their administration cost (relating to meter-reading, billing cost, etc.), therefore this part only account for small fraction (1%~7%) in comparison to the total cost of the template building; one company even use this component to cover their other non-production costs (fixed asset investment, deprecation, salary and other costs that are indirectly related to energy production) therefore FxD accounts for 23% in their pricing scheme.
3.2 Load Demand Component
Load Demand Component (LDC) is essentially a variable component charged basing on user’s consumption pattern (load demand), it usually covers DH company’s non-production costs caused by investment on fixed assets, depreciation, salary, etc. Not all schemes have this component, there are 13% of them with no LDC. Among schemes with LDC, five methods are now in use to determine the load demand of a user:
The most primitive method (used by 14% of all investigated pricing schemes) is to use consumers’ total consumption during a certain period of time, either during the previous year or previous high peak period (in cold countries, during winter months), to determine their load demand.
The most commonly used LDC (by 51% of investigated pricing schemes) is an engineering approximation. The method introduced a slight correction regarding different user groups: it assigns consumption hours per year
(alternatively per winter in 44 schemes) to different type of users (typically 2200 hours/year for multi-family house, and 1700 hours/year for public building) and use it to divide the annual (alternatively winter) consumption to calculate user’s load demand. This method has obvious short coming: it assumes that all users in the same group have the same consumption pattern, which is not true in practice.
As the metering techniques develop, it is now possible to use daily or even hourly consumption data in new pricing schemes. Six percent of pricing schemes use a method called “load signature”. This method use the correlation between user’s historical heat consumption and outdoor temperature to predict user’s consumption at the extreme weather condition ( low outdoor temperature for northern countries) through simple linear regression. This works fine for multi-family house, but part of users might not have a linear correlation between their heat consumption and outdoor temperature, therefore it will be inaccurate and even unfair for them to be charged by this method.
Twelve percent of pricing schemes use measured peak demand during the previous peak season(s). Another 4% pricing schemes uses so called “subscribed/exceeded level” method. The users subscribe a certain level of load demand, which gives them right to buy energy at a standard price, once their load demand exceed the subscription level , the exceeded part of energy will be charged by a significantly higher peak price.
The previous three methods are engineering approximations which could not provide sufficient incitement for operation optimization, especially short-term energy conservation measures. The last two variation of LDC could reflect user’s consumption pattern in their cost, and also gives reasonable incitement for operation optimization.
3.3 Energy Demand Component
All pricing schemes must include energy demand component (EDC), which is based on the user’s energy consumption. This component is supposed to cover DH companies’ production costs. In about 15% of pricing schemes, LDC covers more than 90% in total cost of the template building. There are 5 different approaches to set price on each unit of heat consumed.
Primarily, 63% of investigated pricing schemes use constant energy price throughout whole year. This approach does not reflect the real production cost and might give too large incitment for energy conservation measures that might lead to negtive impact on environment from systematic perspective.
Then there is seasonal energy price used by 33% of the pricing schemes, which means the energy price per kWh is more expensive during the peak season (usually winter in northern countries) and cheaper during other time. This is one way to reflect the production cost and give more
Paper ID: CUE2015-174
3 Copyright © 2015 by CUE2015
incitement to energy conservation measures that could help to constrain peak-demand in DH system.
But even during the winter months, the most expensive plants are not always in operation. Therefore some pricing schemes (less than 1%) set their energy price according to the outdoor temperature, which is generally a good indicator on the demand level in the DH system, and is accessed easily by the general public to plan for active response.
As metering in smaller time-steps is available now, some DH companies (less than 0.5%) who experiences difficulties to produce heat during specific time of the day (usually in the morning and evening) introduced peak-hour price in their pricing schemes, which means that a higher energy price is enforced at peak hours (usually in the morning and evening). Accompanying the subscribed/exceeded method in LDC, 3% of pricing schemes use subscribed/exceeded energy price scheme. This method gives extra incitment to users to keep close track on their consumption and making adaption accordingly.
3.4 Flow Demand Component
Flow demand component (FDC) is in principle a cost charged on volume of hot water needed to deliver the energy user consumes. It supposed to cover DH companies’ pumping cost and a part of their heat losses. This component is adopted by about half of all pricing schemes. One third of the pricing schemes that have FDC use a premium structure, which means to compare user’s heat exchanger’s efficiency with the average value in the system. If the user has higher efficiency then there is a cost reduction, otherwise, a cost accretion. It is usually a good reminder for the user to improve the efficiency of their heat exchanger.
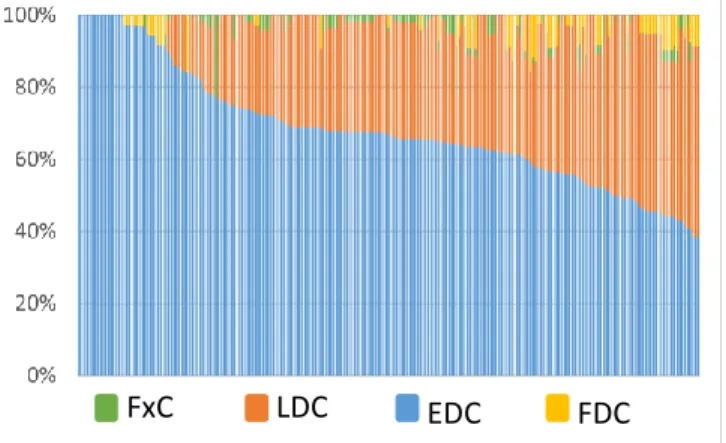
3.5 Proportion between different components
Figure 2 shows how much each price component is accounted for in the template building under different pricing schemes. Not all pricing schemes have all four
components, 17 schemes have only energy fees and quite a few of them have only one or two components acting as the ‘stabilizing’ part. The average proportion of EDC is 68%, and LDC takes 28%. FxC and FDC account for only 1% and 2% averagely of total cost.
Note that the result only represents the cost structure of the template building, and not a real distribution of DH companies’ income from each component.
4. DISCUSSION & CONCLUSION
Most of the pricing schemes are still using assigned consumption hour method and constant energy price in their LDC and EDC, which are not related to users’ real consumption pattern, and could not reflect the production cost. These methods give very low incitement to users for operation optimization, could not encourage them to actively response to system demand level, and expose DH companies to high risk level.
Whereas the newly introduced measured peak demand, seasonal energy price and subscribed/exceeded level methods, though not adopted by the majority, put user’s real consumption pattern into consideration. These methods try to give users proper signal in order to impact their consumption pattern, and could reflect real production cost. These could be a good incitement for introducing more demand response equipment to build a smart DH grid and eventually improve the effectivity in energy system in more comprehensive manner. Of course the impact of these methods on the user’s cost and eventually the user’s behavior change need to be examined.
ACKNOWLEDGEMENT
This work is a part of studies within research school REESBE (Resource-Efficient Energy System in the Built Environment), financed by The Knowledge Foundation, Västerås City and municipality owned energy company and housing company, Mälarenergi and Mimer.
REFERENCE
[1] M. Åberg, D. Henning. Optimization of a Swedish district heating system with reduced heat demand due to energy efficiency measures in residential buildings. Energy Policy 39 (2011) 7839-7852.
[2] H. Li et al. A review of the pricing mechanisms for district heating systems. Renewable and Sustainable Energy Reviews 42 (2015) 56–65.
[3] Olof Larsson. Pricing models in district heating (2011). Available at: http://publications.lib.chalmers.se/records/full text/149216.pdf
[4] Swedish Energy-Market’s Inspection. District heating companies’ annual report (Swedish). Available at http://www.energimarknadsinspektionen.se/sv/Fjarrvarme /inrapporterad-data/
Figure 2. Proportion of price components in cost calculation of template building among 237 pricing
schemes.