R E S E A R C H
Open Access
Elaborating on the assessment of the risk
of bias in prognostic studies in pain
rehabilitation using QUIPS
—aspects of
interrater agreement
Wilhelmus Johannes Andreas Grooten
1,2*, Elena Tseli
1, Björn Olov Äng
1,3,4, Katja Boersma
5, Britt-Marie Stålnacke
6,7,
Björn Gerdle
8and Paul Enthoven
8,9Abstract
Background: Many studies have been performed to identify important prognostic factors for outcomes after rehabilitation of patients with chronic pain, and there is a need to synthesize them through systematic review. In this process, it is important to assess the study quality and risk of bias. The“Quality In Prognosis Studies” (QUIPS) tool has been developed for this purpose and consists of several prompting items categorized into six domains, and each domain is judged on a three-grade scale (low, moderate or high risk of bias). The aim of the present study was to determine the interrater agreement of the risk of bias assessment in prognostic studies of patients with chronic pain using QUIPS and to elaborate on the use of this instrument.
Methods: We performed a systematic review and a meta-analysis of prognostic factors for long-term outcomes after multidisciplinary rehabilitation in patients with chronic pain. Two researchers rated the risk of bias in 43 published papers in two rounds (15 and 28 papers, respectively). The interrater agreement and Cohen’s quadratic weighted kappa coefficient (κ) and 95% confidence interval (95%CI) were calculated in all domains and separately for the first and second rounds.
Results: The raters agreed in 61% of the domains (157 out of 258), with similar interrater agreement in the first (59%, 53/90) and second rounds (62%, 104/168). The overall weighted kappa coefficient (kappa for all domains and all papers) was weak:κ = 0.475 (95%CI = 0.358–0.601). A “minimal agreement” between the raters was found in the first round,κ = 0.323 (95%CI = 0.129–0.517), but increased to “weak agreement” in the second round, κ = 0.536 (95%CI = 0.390–0.682).
Conclusion: Despite a relatively low interrater agreement, QUIPS proved to be a useful tool in assessing the risk of bias when performing a meta-analysis of prognostic studies in pain rehabilitation, since it demands of raters to discuss and investigate important aspects of study quality. Some items were particularly hard to differentiate in-between, and a learning phase was required to increase the interrater agreement. This paper highlights several aspects of the tool that should be kept in mind when rating the risk of bias in prognostic studies, and provides some suggestions on common pitfalls to avoid during this process.
Trial registration: PROSPEROCRD42016025339; registered 05 February 2016.
Keywords: Chronic pain, Inter-rater agreement, Meta-analysis, Prognosis, Rehabilitation, Review, Risk of bias
* Correspondence:Wim.Grooten@ki.se
1
Department of Neurobiology, Care Sciences and Society, Division of Physiotherapy, Karolinska Institutet, Huddinge SE-141 83, Sweden
2Allied Health Professionals Function, Functional area Occupational Therapy
and Physiotherapy, Karolinska University Hospital, Stockholm SE-171 76, Sweden Full list of author information is available at the end of the article
© The Author(s). 2019 Open Access This article is distributed under the terms of the Creative Commons Attribution 4.0 International License (http://creativecommons.org/licenses/by/4.0/), which permits unrestricted use, distribution, and reproduction in any medium, provided you give appropriate credit to the original author(s) and the source, provide a link to the Creative Commons license, and indicate if changes were made. The Creative Commons Public Domain Dedication waiver (http://creativecommons.org/publicdomain/zero/1.0/) applies to the data made available in this article, unless otherwise stated.
Background
A prognostic factor is any measure associated with a subsequent clinical outcome among people with a given health condition [1, 2]. For example, in patients with chronic pain, those with higher levels of emotional dis-tress have a worse prognosis, e.g. worse functional out-come after rehabilitation [3], while pain intensity in combination with anxiety or depressive symptoms has been identified as important prognostic factors for poor recovery [4]. Prognostic factors may thus distinguish groups of people with a different average prognosis, and by identifying these, prognostic models can be developed to provide important information for health research and guidance for more effective and efficient care [5]. The PROGRESS group (PROGnosis RESearch Strategy) has put forward prognostic studies as an important base of knowledge for clinical decision making, healthcare policy, and discovering and evaluating new approaches to patient management [6]. In studies on rehabilitation of chronic pain, several prognostic factors from different domains (demographic, illness-related, rehabilitation-related, social) have been suggested influencing a large number of outcomes (pain, function, work, quality of life) at the same time. Each year, hundreds of studies in the field of pain rehabilitation investigate different prog-nostic factors. Frequently, the findings are inconsistent; some authors suggest that a particular factor is prognos-tic while others suggest the contrary [2, 7, 8]. For this reason, it is important to perform a systematic review (SR) of existing data in order to evaluate the prognostic value of this particular factor. The aim of such SR is thus firstly to look at whether a potential prognostic factor is associated with an outcome and secondly to estimate the strength of the association through a meta-analysis (MA), where all study findings are synthesized and sum-marized, for example by calculating an average effect size. In this process, it is important to assess the quality of the included papers in order to decide if and to what extent a paper may contribute to the review (and synthe-sis). This process is called risk of bias assessment (RoB) [9]. If the included papers have methodological flaws, it is difficult to draw any conclusions regarding the exist-ence and strength of any associations and therefore has the PROGRESS group put forward several recommenda-tions to increase the study quality of prognostic studies, the transparency, better reporting, and several other
as-pects that can be improved, such as improved
standardization [2, 6]. RoB assessment, however, is a process of subjective judgment, and since different raters could rate differently, the use of a standardized tool to guide such critical appraisal in conducting sys-tematic reviews is suggested. By using this type of tool, the raters are better equipped to systematically discuss all important aspects of study quality in a
more transparent way, which also makes it easier to reach a consensus between all raters.
Cochrane Prognosis Methods Group recommends the use of the Quality In Prognosis Studies (QUIPS) tool to assess RoB in prognostic factor studies [10]. The QUIPS tool uses six important domains that should be critically appraised when evaluating validity and bias in studies of prognostic factors: (1) study participation, (2) study attri-tion, (3) prognostic factor measurement, (4) outcome measurement, (5) study confounding, and (6) statistical analysis and reporting [11]. The different domains con-tain between three and seven prompting items to be rated on a four-grade scale (yes, partial, no, unsure). Some of these items are informal and can be answered with a “yes” or “no”, mainly referring to whether essen-tial study information has been reported (e.g. “reasons for loss to follow-up are provided”), but for other items, the rater needs to make a more subjective decision (e.g. “there is adequate participation in the study by eligible individuals”). In a final stage, the rater makes an overall, conclusive judgment of the risk of bias within each domain, based on their ratings of the included items. This risk is expressed on a three-grade scale (high, moderate or low RoB) [11]. Hence, the QUIPS assessment results in six ratings of RoB, one for each domain, which are then compared for interrater agreement.
In the original study by Hayden et al. [11], kappa values evaluating QUIPS were reported to vary from 0.56 to 0.82 (median, 0.75) showing that the raters in-volved had relatively good interrater agreement. Still, Hayden et al. stated that further reliability testing should be done on a larger, more representative set of studies and tool users, including assessing reliability of individ-ual domain ratings, as well as consensus ratings between groups [11]. To our knowledge, QUIPS has not yet been widely used for RoB assessment of prognostic studies in the field of pain rehabilitation and there are no specific interrater reliability studies on QUIPS performed. Hence, the aim of the present study was to determine the interrater agreement of the risk of bias (RoB) assess-ment in prognostic studies using QUIPS and to elabor-ate on our experiences.
Methods
This paper is divided into one part on interrater agree-ment and one part elaborating on the experiences of using QUIPS. We performed a meta-analysis of early (baseline) prognostic factors in patients with chronic pain, which could influence multiple long-term outcomes after multi-disciplinary rehabilitation (MDR) [12]. The aim of the meta-analysis was to find out what factors were associated with defined outcomes (and the level of evidence), rather than exploring a hypothesis of one specific prognostic
factor for one specific outcome. Hence, papers published between 1994 and 2014 with various longitudinal study designs were included: prognostic studies, register data studies, randomized controlled intervention studies, non-controlled studies, etc. The papers were predomin-antly observational, non-controlled intervention studies that included patient information (prognostic factors) of the population of interest at baseline, together with out-come data (pain, function, work status, quality of life, etc.) at 6 months or more after baseline and subsequent MDR (see Additional file1). In the research team, three authors with expertise within MDR worked on the final selection of potential papers. Thereafter, two researchers with ex-pertise within epidemiology and prognostic studies assessed the RoB of the included papers independently following a randomization scheme. A third junior re-searcher was also involved in this process, but in the present paper, the agreement between the two senior re-searchers is the focus of interest.
QUIPS rating procedure
To assess the RoB of the included papers, the QUIPS electronic spreadsheet (in MS Excel) as provided by Hayden et al. [11] was used. The two raters independ-ently inserted relevant information from each paper in their own electronic assessment spreadsheet. The raters were able to make specific notes on quality issues for each prompting item. Each rater used only one MS Excel sheet for each paper, although several prognostic factors and outcomes could have been evaluated in the same paper. Hence, for each domain, the raters judged the six domains on theoverall quality of the paper. The authors’ notes were used later during our peer-group discussions for reaching agreement (on the overall quality of the study) when summarizing the level of evidence for every separate prognostic factor.
For QUIPS, there are no rules available that indicate how the researcher should classify the overall RoB of a paper or, in other words, how to summarize the RoB of all six domains into one overall rating on paper level, but it is recommended against computing summated scores for overall study quality [14]. In systematic re-views and/or meta-synthesis, however, it is recom-mended to include a table of included papers in which each paper is classified as having high, moderate or low RoB. It became thus evident that some sort of categorization of the papers was necessary to describe the included papers for our synthesis after finalizing all RoB assessments [3]. We based this categorization on the following criteria: If all domains were classified as having low RoB, or up to one moderate RoB, then this paper was classified as low RoB (green). If one or more domains were classified as having high RoB, or≥ 3 mod-erate RoB, then this paper was classified as high RoB
(red). All papers in between were classified as having moderate RoB (yellow). This categorization was a result of a continuous discussion between the authors.
Procedure
An initial pilot screening of five non-included papers was used to prepare the raters involved for the use of QUIPS, reaching a consensus on how to judge the differ-ent prompting items and how to summarize them in order to judge a domain. The two experienced senior re-searchers independently rated the RoB in 43 of the in-cluded papers in two separate rounds with a mid-point discussion in-between. The discussions were used to re-solve any discrepancies and to achieve 100% consensus for the papers considered in the first and second rounds, including 15 and 28 papers, respectively. Moreover, any detected vagueness in the“key-list” were further resolved during this mid-point discussion.
Statistical analyses Interrater agreement
All RoB domains in all papers (n = 43) were separately judged by the raters as having low, moderate or high RoB. Agreement was defined as the two experienced se-nior researchers scoring alike on a domain, while max-imal disagreement was defined as one rater scoring low RoB and the other scoring high RoB. All other cases of disagreement were defined as partial disagreement.
To assess whether the two experienced senior re-searchers scored the QUIPS domains equally, the inter-rater agreement was investigated to determine the consistency between the raters. The rate of agreement was calculated as a percentage by the number of do-mains judged alike by the two raters divided by the total number of domains (n = 258; i.e. 43 papers × 6 domains) before reaching consensus. This was performed across all papers, but also for the first and second rounds sep-arately (n = 90 and n = 168, respectively). An online kappa calculator was used to calculate Cohen’s kappa with quadratic weighting ( http://vassarstats.net/kap-pa.html) for all domains combined and for each separate domain across all 43 papers, but also for the two rounds separately. The coefficient was interpreted as follows: κ = 0.00–0.20, no agreement; κ = 0.21–0.39, weak agree-ment; κ = 0.40–0.59, minimal agreement; κ = 0.60–0.79, moderate agreement; κ = 0.80–0.90, strong agreement; andκ > 0.90, almost perfect agreement [13].
An online test of proportion calculator (https:// www.medcalc.org/calc/comparison_of_proportions.php) was used to test if there were any differences in over-all agreement between the raters, between the differ-ent rounds and between the papers with high and low RoB.
Results
Interrater agreement
In four out of the 43 papers (9.3%), there was full initial agreement between the two experienced senior re-searchers in all six domains. The raters judged similarly in five domains in 10 papers (23.2%); they disagreed four times in domain 6, three times in domain 1, and one time in domains 2, 3 and 5. The raters judged similarly in four domains in nine papers (20.9%); they disagreed five times in domain 5, four times in domain 3, three times in domains 1 and 3, and two times in domain 4. In 12 papers (27.9%), three domains were rated similarly; most disagreements occurred in domain 6 (nine times), followed by seven times in domain 3, six times in do-main 5, five times in dodo-main 1 and 2, and four times in domain 4. In six papers (14.0%), two domains were rated similarly; most agreement was found for domain 5 (four times) and domain 3 (three times), while the raters agreed two times in domain 6 and one time in the remaining domains each. In the remaining two papers, only one domain was judged similar (4.7%). For high-quality papers, those classified with low RoB, the agreement percentage was somewhat higher (88/133 mains = 66.2%) than for papers with high RoB (22/38 do-mains = 57.9%);p = 0.3475.
All in all, the results show that in 23 out of 43 (53.5%) of the papers, at least four domains were scored similar by the two raters (see Additional file2).
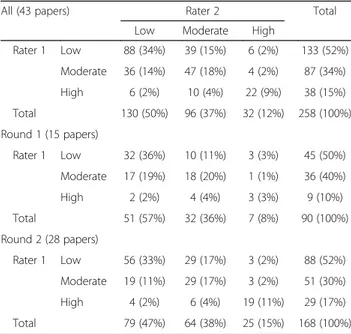
Table 1 shows the two raters’ initial judgments for all
258 domains (43 papers × 6 domains). The raters agreed in 157 domains (60.9%). In the first round, the raters judged alike in 58.9% (53/90) of the domains, and in the second round, in 61.9% (104/168). Although no differ-ences between the rounds concerning % agreement were seen, both raters had a higher proportion of prompting items classified as high RoB in the second round com-pared to the first round.
In 4.6% of the domains (12/258), the raters disagreed maximally. Maximal disagreement was not caused by one of the raters judging consistently lower or higher RoB than the other; hence, there was no systematic dif-ference in rating style. The overall quadratic weighted kappa coefficient (kappa for all domains and all papers) was interpreted as a “weak agreement”, κ = 0.475 (95% CI = 0.358–0.601). “Minimal agreement” was found for the first round, κ = 0.323 (95% CI = 0.129–0.517), and the kappa improved somewhat in the second round to weak agreement,κ = 0.536 (95% CI = 0.390–0.682).
The Kappa calculations for the separate domains showed that minimal agreement was found for do-mains 1, 3, 4 and 6; weak agreement was found for domain 5 “study confounding”; and “moderate agree-ment” was found for domain 2 “study attrition” (Table 2).
Elaboration on QUIPS
With the intention to improve future inter-rater agree-ment on RoB assessagree-ment, we elaborate below on the prompting items in the QUIPS tool that should be dis-cussed before performing RoB assessment in a system-atic review. This is in line with Hayden et al., who encouraged clear specification of the tool items, as this will probably improve interrater agreement [11]. Table3
gives some of the specific questions that raters could use in their discussion on the prompting items before and during the review process. Using these questions, raters could systematically and objectively reach a consensus.
For all domains, it is important to decide the weight of each item, e.g. concerning the prompting item on the source population in the domain“study participation”. Only a few papers in our sample reported any data in this regard, so we decided not to put much emphasis on this prompting item, since it is unclear how the OR of a prognostic factor can be different between participants and eligible non-participants if the source population is not presented.
On the prompting items relating to “participation and attrition”, we found it important to use cut-offs in order to ensure consistency. In our analyses, we used an arbi-trary cut-off point of at least 67% for both participation and attrition rates as acceptable. This factor probably in-creased the consistency in the second round. In order to reach consistency between the raters for many of the prompting items, it is crucial to reach a consensus on what is meant by“adequate” and how much information is needed to produce a yes.
Within our research team, we discussed how to judge the RoB on the prompting item“The method and setting
Table 1 Comparison of risk of bias judgment for all papers and for rounds 1 and 2 separately
All (43 papers) Rater 2 Total
Low Moderate High
Rater 1 Low 88 (34%) 39 (15%) 6 (2%) 133 (52%) Moderate 36 (14%) 47 (18%) 4 (2%) 87 (34%) High 6 (2%) 10 (4%) 22 (9%) 38 (15%) Total 130 (50%) 96 (37%) 32 (12%) 258 (100%) Round 1 (15 papers) Rater 1 Low 32 (36%) 10 (11%) 3 (3%) 45 (50%) Moderate 17 (19%) 18 (20%) 1 (1%) 36 (40%) High 2 (2%) 4 (4%) 3 (3%) 9 (10%) Total 51 (57%) 32 (36%) 7 (8%) 90 (100%) Round 2 (28 papers) Rater 1 Low 56 (33%) 29 (17%) 3 (2%) 88 (52%) Moderate 19 (11%) 29 (17%) 3 (2%) 51 (30%) High 4 (2%) 6 (4%) 19 (11%) 29 (17%) Total 79 (47%) 64 (38%) 25 (15%) 168 (100%)
of outcome measurement is the same for all study par-ticipants” when two different but both adequate mea-sures were used. For instance, is there an increased risk of bias if patients’ pain intensity levels were measured both using a visual analogue scale (VAS) and a numeric rating scale (NRS)? Both measures are considered valid and reliable and measure the same construct “pain in-tensity”. It is therefore difficult to know if this intro-duced a systematic error in the OR estimates.
Regarding the domains “confounding” and “statistical analyses”, it is important that the raters are familiar with epidemiological methodological issues and statistical ana-lyses, which was the case in the current study. Despite this, the raters sometimes differed in their RoB judgments. One explanation is that different experts prefer different statis-tical methods, and there is no golden standard for which method is the most optimal method that should be used. It is therefore important to have a discussion on this topic to reach consensus on which study design, regression models, and imputation methods are acceptable and which are not.
Sometimes, we found it difficult to know “where” (in which domain) to rate a methodological flaw and/or if this flaw should be counted one or two times. For ex-ample, when a paper provided an odds ratio (OR) for a prognostic factor without reporting if the OR was ad-justed for confounding, one rater could rate a “high RoB” in the domain of “statistical analysis and reporting” (poor reporting), while the other could rate high RoB in the domain of study confounding (presuming that the data was not adjusted for confounders since it was not mentioned). Moreover, we used neither any specific guidelines nor any prior criteria about how many “nos” on specific prompting items resulted in to moderate or high RoB for that domain, but the raters felt that the judgment was not that hard. If for example the item “re-cruitment period” was classified as no but the other five prompting items in the “participating domain” were classified as a yes, then the overall rating on this item
was “low RoB”, while if the prompting item on
participating rate was classified as a no, the RoB would be classified as a high RoB in this domain.
As a final comment on the prompting item in the do-main of “Statistical analyses and reporting - There is no selective reporting of results”, it is important to reach consensus on whether or not to check published proto-cols or other pre-publications for selective reporting of the outcomes and prognostic studies, or if the paper should be judged without this additional knowledge. Discussion
The results of our study showed that the raters agreed in 61% of the domains, with similar interrater agreement in the first and second round. The overall weighted kappa coefficient was weak, and suggestions for improvement were provided.
Hayden et al. [11] reported kappa values varying from 0.56 to 0.82 (median 0.75) from nine review teams on 205 studies. Compared to these studies, our kappa values were somewhat lower, which might be due to various causes. A limitation when comparing the present study with the study of Hayden et al. [11] is that all studies quoted in Hayden et al. used a previous version of the tool instead of the currently recommended QUIPS tool applied in our study. Some studies [14,15] used a previ-ous version of QUIPS, or a previprevi-ous version combined with items from other tools [16–18]. It is therefore diffi-cult to know to what extent kappa values are influenced by the different versions of the QUIPS tool. Further-more, in several studies, kappa values were not based on RoB assessment of the six QUIPS domains, but on the prompting items [14, 17–22], which is not recom-mended [11] since calculating kappa from a large num-ber of items (using a yes/no judgment) compared to a small number of domains (using a three-grade scale) may result in an overestimation of the kappa value. Some studies [15,21] calculated a total quality score for each study based on all domains, which may not be par-ticularly informative, as it ascribes equal weight to each
Table 2 Interrater agreement for all papers and for the two rounds separately
All papers (43 papers) Round 1 (15 papers) Round 2 (28 papers) κ1 95% CI2 κ1 95% CI2 κ1 95% CI2 1. Study participation 0.356 0.063–0.669 − 0.023 − 0.041–0.594 0.475 0.100–0.851 2. Study attrition 0.647 0.353–0.771 0.400 0.000–0.835 0.714 0.426–1.000 3. Prognostic factor measurement 0.384 0.044–0.723 0.852 0.544–1.00 0.028 − 0.453–0.612 4. Outcome measurement 0.358 0.072–0.645 0.211 0.00–0.660 0.443 0–095-0.792 5. Study confounding 0.526 0.269–0.784 0.561 0.00–1.00 0.481 0.186–0.776
6. Statistical analysis and reporting 0.364 0.077–0.651 − 0.070 0.321–0.486 0.533 0.176–0.627
Overall 0.475 0.358–0.601 0.323 0.129–0.517 0.536 0.390–0.682
1
Quadratic weighted kappa (κ)
2
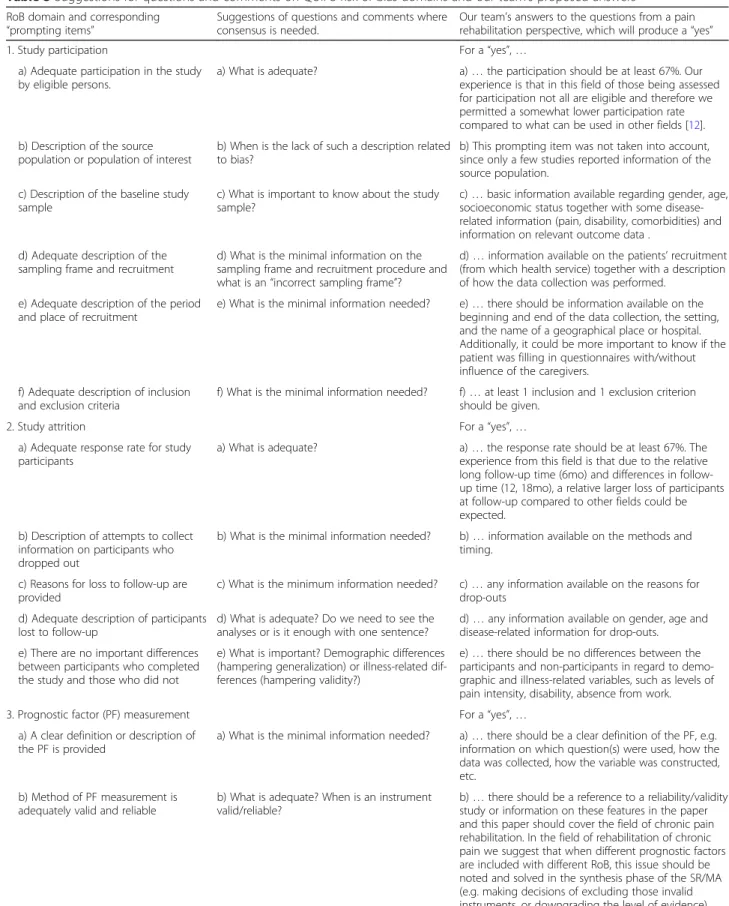
Table 3 Suggestions for questions and comments on QUIPS risk of bias domains and our team’s proposed answers
RoB domain and corresponding
“prompting items” Suggestions of questions and comments whereconsensus is needed.
Our team’s answers to the questions from a pain rehabilitation perspective, which will produce a“yes”
1. Study participation For a“yes”, …
a) Adequate participation in the study by eligible persons.
a) What is adequate? a)… the participation should be at least 67%. Our experience is that in this field of those being assessed for participation not all are eligible and therefore we permitted a somewhat lower participation rate compared to what can be used in other fields [12]. b) Description of the source
population or population of interest
b) When is the lack of such a description related to bias?
b) This prompting item was not taken into account, since only a few studies reported information of the source population.
c) Description of the baseline study sample
c) What is important to know about the study sample?
c)… basic information available regarding gender, age, socioeconomic status together with some disease-related information (pain, disability, comorbidities) and information on relevant outcome data .
d) Adequate description of the sampling frame and recruitment
d) What is the minimal information on the sampling frame and recruitment procedure and what is an“incorrect sampling frame”?
d)… information available on the patients’ recruitment (from which health service) together with a description of how the data collection was performed.
e) Adequate description of the period and place of recruitment
e) What is the minimal information needed? e)… there should be information available on the beginning and end of the data collection, the setting, and the name of a geographical place or hospital. Additionally, it could be more important to know if the patient was filling in questionnaires with/without influence of the caregivers.
f) Adequate description of inclusion and exclusion criteria
f) What is the minimal information needed? f)… at least 1 inclusion and 1 exclusion criterion should be given.
2. Study attrition For a“yes”, …
a) Adequate response rate for study participants
a) What is adequate? a)… the response rate should be at least 67%. The experience from this field is that due to the relative long up time (6mo) and differences in follow-up time (12, 18mo), a relative larger loss of participants at follow-up compared to other fields could be expected.
b) Description of attempts to collect information on participants who dropped out
b) What is the minimal information needed? b)… information available on the methods and timing.
c) Reasons for loss to follow-up are provided
c) What is the minimum information needed? c)… any information available on the reasons for drop-outs
d) Adequate description of participants lost to follow-up
d) What is adequate? Do we need to see the analyses or is it enough with one sentence?
d)… any information available on gender, age and disease-related information for drop-outs. e) There are no important differences
between participants who completed the study and those who did not
e) What is important? Demographic differences (hampering generalization) or illness-related dif-ferences (hampering validity?)
e)… there should be no differences between the participants and non-participants in regard to demo-graphic and illness-related variables, such as levels of pain intensity, disability, absence from work.
3. Prognostic factor (PF) measurement For a“yes”, …
a) A clear definition or description of the PF is provided
a) What is the minimal information needed? a)… there should be a clear definition of the PF, e.g. information on which question(s) were used, how the data was collected, how the variable was constructed, etc.
b) Method of PF measurement is adequately valid and reliable
b) What is adequate? When is an instrument valid/reliable?
b)… there should be a reference to a reliability/validity study or information on these features in the paper and this paper should cover the field of chronic pain rehabilitation. In the field of rehabilitation of chronic pain we suggest that when different prognostic factors are included with different RoB, this issue should be noted and solved in the synthesis phase of the SR/MA (e.g. making decisions of excluding those invalid instruments, or downgrading the level of evidence).
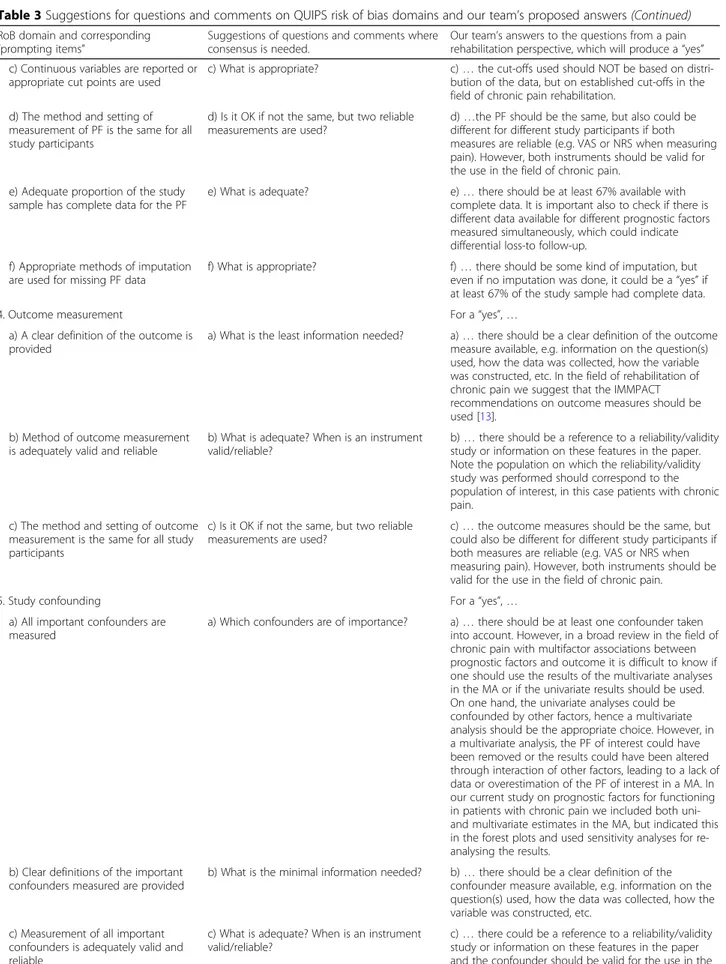
Table 3 Suggestions for questions and comments on QUIPS risk of bias domains and our team’s proposed answers (Continued)
RoB domain and corresponding
“prompting items” Suggestions of questions and comments whereconsensus is needed.
Our team’s answers to the questions from a pain rehabilitation perspective, which will produce a“yes” c) Continuous variables are reported or
appropriate cut points are used
c) What is appropriate? c)… the cut-offs used should NOT be based on distri-bution of the data, but on established cut-offs in the field of chronic pain rehabilitation.
d) The method and setting of measurement of PF is the same for all study participants
d) Is it OK if not the same, but two reliable measurements are used?
d)…the PF should be the same, but also could be different for different study participants if both measures are reliable (e.g. VAS or NRS when measuring pain). However, both instruments should be valid for the use in the field of chronic pain.
e) Adequate proportion of the study sample has complete data for the PF
e) What is adequate? e)… there should be at least 67% available with complete data. It is important also to check if there is different data available for different prognostic factors measured simultaneously, which could indicate differential loss-to follow-up.
f) Appropriate methods of imputation are used for missing PF data
f) What is appropriate? f)… there should be some kind of imputation, but even if no imputation was done, it could be a“yes” if at least 67% of the study sample had complete data.
4. Outcome measurement For a“yes”, …
a) A clear definition of the outcome is provided
a) What is the least information needed? a)… there should be a clear definition of the outcome measure available, e.g. information on the question(s) used, how the data was collected, how the variable was constructed, etc. In the field of rehabilitation of chronic pain we suggest that the IMMPACT recommendations on outcome measures should be used [13].
b) Method of outcome measurement is adequately valid and reliable
b) What is adequate? When is an instrument valid/reliable?
b)… there should be a reference to a reliability/validity study or information on these features in the paper. Note the population on which the reliability/validity study was performed should correspond to the population of interest, in this case patients with chronic pain.
c) The method and setting of outcome measurement is the same for all study participants
c) Is it OK if not the same, but two reliable measurements are used?
c)… the outcome measures should be the same, but could also be different for different study participants if both measures are reliable (e.g. VAS or NRS when measuring pain). However, both instruments should be valid for the use in the field of chronic pain.
5. Study confounding For a“yes”, …
a) All important confounders are measured
a) Which confounders are of importance? a)… there should be at least one confounder taken into account. However, in a broad review in the field of chronic pain with multifactor associations between prognostic factors and outcome it is difficult to know if one should use the results of the multivariate analyses in the MA or if the univariate results should be used. On one hand, the univariate analyses could be confounded by other factors, hence a multivariate analysis should be the appropriate choice. However, in a multivariate analysis, the PF of interest could have been removed or the results could have been altered through interaction of other factors, leading to a lack of data or overestimation of the PF of interest in a MA. In our current study on prognostic factors for functioning in patients with chronic pain we included both uni-and multivariate estimates in the MA, but indicated this in the forest plots and used sensitivity analyses for re-analysing the results.
b) Clear definitions of the important confounders measured are provided
b) What is the minimal information needed? b)… there should be a clear definition of the confounder measure available, e.g. information on the question(s) used, how the data was collected, how the variable was constructed, etc.
c) Measurement of all important confounders is adequately valid and reliable
c) What is adequate? When is an instrument valid/reliable?
c)… there could be a reference to a reliability/validity study or information on these features in the paper and the confounder should be valid for the use in the
of the nominated items, and the method is therefore not recommended [11, 23]. There are also large differences between the RoB of different domains, which also sug-gests that an overall rating based on all domains should not be used. Some reviews included studies with other designs than prognostic prospective longitudinal studies, which also could have influenced the ratings [19,20].
A number of recent reviews have investigated RoB using the same QUIPS version as the current study [24,
25] and describe the process of involving a third rater in order to reach total agreement. In the present study, this was not necessary because the two raters were able to come to 100% consensus through discussion. Bruls et al. [24] showed, similar to our results, a large variation in kappa values for the different domains (κ = 0.13 for do-main study confounding and κ = 0.82 for domain study participation). den Bakker et al. [25] also found low interrater agreement for the domain study confounding, and these results are somewhat contradictory to our re-sults, which showed the second highest kappa coefficient for this domain (all studies). One reason for this discrep-ancy could be that the majority of the papers included in
our analyses were methodologically flawed in this par-ticular domain. Thirteen papers were rated as high RoB in this domain (compared to only 3 papers in the do-main on“prognostic factor measurement”). It should be noted that disagreement between the raters is related to (1) the interpretation of the text (the paper), and (2) the interpretation of the specific prompting items in the do-main. It is impossible to separate these two factors, which could make it difficult to speculate on the reasons for discrepancies between various studies.
Several authors [24–26] describe that difficulties to reach agreement are concentrated to some of the QUIPS domains, and the domains that are problematic may de-pend on the area of research. If the area is complex, it is more difficult to reach an agreement, possibly because the items can be interpreted in different ways. It might be more difficult, as in the current study, to perform RoB assessment on prognostic studies in the field of pain rehabilitation and on patients with chronic pain, due to the well-known diversity of the symptoms, variation in outcomes and other methodological difficulties. Most of the papers included in the present study were classified
Table 3 Suggestions for questions and comments on QUIPS risk of bias domains and our team’s proposed answers (Continued)
RoB domain and corresponding
“prompting items” Suggestions of questions and comments whereconsensus is needed.
Our team’s answers to the questions from a pain rehabilitation perspective, which will produce a“yes” field of chronic pain.
d) The method and setting of confounding measurement are the same for all study participants
d) Is it OK if not the same, but two reliable measurements are used?
d)… the confounder measures should be the same, but could also be different for different study participants if both measures are reliable (e.g. VAS or NRS when measuring pain).
e) Appropriate methods are used if imputation is used for missing confounder data
e) What do we accept as an appropriate method when handling missing data?
e)… there could be any kind of imputation, but even if no imputation was done, it could be a“yes” if at least 67% of the study sample had complete data.
f) Important potential confounders are accounted for in the study design
f) What do we accept as an appropriate study design?
f)… there should have been some kind of
randomization or confounders included in the analyses. Since blinding of researchers and patients to treatment is nearly impossible in the field of chronic pain rehabilitation, we accepted randomization only. g) Important potential confounders are
accounted for in the analysis
g) If not, do we judge here or on point 6c) or on both points?
g) see point f) and point 6c)
6. Statistical Analysis and Reporting For a“yes”, …
a) Sufficient presentation of data to assess the adequacy of the analytic strategy
a) What is sufficient? a)… there should be enough information available to understand the statistical methods applied, so that the rater can determine whether the methods used were correct.
b) Strategy for model building is appropriate and is based on a conceptual framework or model
b) What is appropriate? If there is no model described, is there a risk of bias?
b) We decided that this point was NOT to be considered, but more emphasis was put on point 6a) c) The selected statistical model is
adequate for the design of the study
c) What is adequate? c)… there should be some form of statistical analyses description available, resulting in information on the effect of the PF on the outcome.
d) There is no selective reporting of results
d) Is there a need to check pre-publications such as protocols for this information?
d)… all variables (outcomes and PF) that are described in the method section should be included in the result section with words or in numbers (tables, figures).
as having multiple domains with high risk of bias. Add-itionally, as our review included papers in which several prognostic factors and outcomes were assessed at the same time, it was a methodological challenge to assess the RoB assessment at study level, i.e. to give an overall score. For example, the RoB may vary within a study for different prognostic factors and outcomes, as well as the judgment for assessment of confounding. Using onlyone QUIPS electronic Excel spreadsheet for each paper may have introduced difficulties to rate the level of evidence for each single prognostic factor, which was our overall purpose with the SR/MA. It is therefore important, espe-cially in broad reviews, that researchers à priori decide if the RoB applies at study level or at single factor level.
In our study, we found that the interrater agreement was higher in papers of good quality. Some, but not all, of the reviews reporting strong inter-rater agreement also found that most of the included studies had good methodological quality and low RoB [14, 17]. This is consistent with the findings of Wright et al. [22] and Paxton et al. [27] in which a higher kappa value was found in studies of high quality. Paxton et al. [27], using the same version of QUIPS as in the current study, re-ported moderate agreement (kappa = 0.7 (95% CI 0.5-0.8), which is somewhat higher than the overall kappa for the present study, but appears to be in line with our results for the second round. One reason for a higher kappa in their study might be that about half of the studies included were classified with low RoB [27], which was a higher percentage than in the current study. It seems that recently published papers have a higher methodological quality than earlier papers, i.e. have lower RoB [25,27], and our study included many papers that were published more than 10 years ago. One reason for the quality improvement of more recent papers might be the introduction of specific checklists for reporting studies, which may have had a positive effect on the interrater agreement of RoB assessment. Our ex-perience was that assessing the RoB was easier in high-quality papers compared to poorly written papers. In relation to this, differences in study quality between our study and the aforementioned studies could lead to different distributions in the 3 × 3 tables, and since the kappa coefficient is dependent on the prevalence index, the differences in results could also be due to differences in prevalence distribution [28].
We believe that it is important to have regular discus-sions in the research group on how to interpret the in-structions to the prompting items in the QUIPS tool. Since the raters were experienced and senior in the field, both identified the methodological flaws in the studies, but disagreed on where (at what prompting item and do-main) to rate the specific methodological drawback (see below). Discussions were needed to rate the importance of
the prompting items and also to agree on how many nos on the prompting items in the different domains were needed to rate that domain as “moderate or high risk of bias”. Hayden et al. emphasize the need of modification/ clarification of the prompting items for each research question [11]. We agree that it is very important for raters to have several meetings before and during the process. While this flexibility makes it easier to apply QUIPS in dif-ferent areas, it may also make it more difficult to compare the results of different review studies, even within the same area. Interestingly, the kappa for the domain “prog-nostic factor” was much lower in the second round com-pared to the first round, but we could not find any plausible explanation as to why this occurred.
Methodological considerations
Among the strengths of our study, this paper is unique in several aspects: not only we analysed levels of interrater reliability and elaborated on several aspects of the QUIPS tool, but we also reported on our experiences and the learning process of using this tool in the field of rehabilita-tion of chronic pain. On the other hand, the number of raters and papers included in our analyses was small, resulting in low prevalence in some of the cells (n = 1–3), when performing sub-group analyses. Moreover, the re-sults of this paper could have limited influence on the use of the QUIPS tool when assessing the RoB in prospective studies in other areas, but we believe that our paper can serve to inspire researchers from other fields to work in a more structured manner and avoid the common pit-falls we have highlighted in this paper. As a final comment, it is important to notice that kappa statistics we used showed the level of agreement between the raters, which is not the same as the agreement to the“true RoB”. Due to the subjectivity of the ratings and the lack of a golden standard, there could have been an overestimation of the estimates if both raters make the same error.
Implications
This study could have some implications for further re-search. Firstly, we underline the importance of having at least two raters carry out RoB assessment of every paper included in the review, which is not the case in a number of recently published review studies. Secondly, it is im-portant that the raters have initial and continuing discus-sions throughout the process on how to interpret the instructions, how to define the qualifiers used in the in-structions and cut-off points when applicable (e.g. the 67% attrition/participation rate), set for defining“minimal level of adequate”, and, finally, that they agree on how to define differences between moderate and high RoB as well as how to classify the overall RoB. The researchers should keep in mind that the suggestions presented in this study should not be seen as decision trees, but as aspects to
discuss when assessing the RoB. Since QUIPS is the main recommended tool for analysing RoB in prognostic stud-ies, it could be of interest to continue refining the tool for example through world-wide workshops including re-searchers from all fields. Perhaps in the future, as the de-sign and conduct of prognostic studies may differ between fields, some field-specific prompting items could be added as well as some additional guidance for QUIPS. As a first step, it could be of interest to study if the use of the pro-posed questions influences the overall agreement between raters.
Conclusions
Despite relatively low interrater agreement, QUIPS proved to be a useful tool for assessing the risk of bias when performing a meta-analysis of prognostic studies in pain rehabilitation, since it demands of raters to dis-cuss and investigate important aspects of study quality. Some items were particularly hard to differentiate, and a learning phase was required to increase the interrater agreement. This paper highlights several aspects of the tool that should be kept in mind when rating the risk of bias in prognostic studies and provides some suggestions on common pitfalls to avoid during this process.
Additional files
Additional file 1:List of included papers.doc. This Word-file contains ref-erences of all 43 studies included in the analyses. (DOCX 16 kb)
Additional file 2:Datasheet.xls. This Excel datasheet includes the ratings of the two included raters on each RoB domain in all 43 studies. (XLSX 18 kb)
Abbreviations
95%CI:95% confidence Interval; MA: Meta-analysis; MDR: Multidisciplinary rehabilitation; NRS: Numeric rating scale; OR: Odds ratio; QUIPS: Quality In Prognosis Studies; RoB: Risk of bias; SR: Systematic review; VAS : Visual analogue scale
Acknowledgements
The authors want to thank Dr. Jill Hayden for her commitment and helpful guidance at the start of the screening process.
Funding
1. The Swedish Research Council, Stockholm, Sweden
2. The Swedish Research Council for Health, Working Life and Welfare (FORTE), Stockholm, Sweden.
3. The AFA-Insurance, Stockholm, Sweden; Availability of data and materials Additional files are supplemented. Authors’ contributions
PE, ET, BG, BMS and KB performed the study eligibility assessment in the systematic review. WG, ET and PE performed the QUIPS assessment. WG, ET and PE performed the data collection and data analysis for the present study. WG, BÄ and PE designed the present study. WG and PE wrote a first draft of the manuscript. All authors participated in revising the manuscript and approved the final version.
Ethics approval and consent to participate Not Applicable.
Consent for publication Not Applicable. Competing interests
The authors declare that they have no competing interests.
Publisher’s Note
Springer Nature remains neutral with regard to jurisdictional claims in published maps and institutional affiliations.
Author details
1Department of Neurobiology, Care Sciences and Society, Division of
Physiotherapy, Karolinska Institutet, Huddinge SE-141 83, Sweden.2Allied
Health Professionals Function, Functional area Occupational Therapy and Physiotherapy, Karolinska University Hospital, Stockholm SE-171 76, Sweden.
3School of Education, Health and Social Studies, Dalarna University, Falun
SE-791 88, Sweden.4Center for Clinical Research Dalarna - Uppsala University,
Falun SE-791 82, Sweden.5School of Law, Psychology and Social Work, Örebro University, Örebro SE-701 82, Sweden.6Department of Community Medicine
and Rehabilitation, Rehabilitation Medicine, Umeå University, Umeå SE-901 87, Sweden.7Department of Clinical Sciences, Danderyd Hospital, Karolinska
Institutet; Department of Rehabilitation Medicine, Danderyd Hospital, SE-182 88 Stockholm, Sweden.8Pain and Rehabilitation Centre, and Department of
Medical and Health Sciences, Linköping University, SE-581 85 Linköping, Sweden.9Division of Physiotherapy, Department of Medical and Health
Sciences, Linköping University, SE-581 85 Linköping, Sweden.
Received: 8 October 2018 Accepted: 23 January 2019
References
1. Armitage P, Gehan EA. Statistical methods for the identification and use of prognostic factors. Int J Cancer. 1974;13(1):16–36.
2. Riley RD, Hayden JA, Steyerberg EW, Moons KG, Abrams K, Kyzas PA, Malats N, Briggs A, Schroter S, Altman DG, et al. Prognosis Research Strategy (PROGRESS) 2: prognostic factor research. PLoS Med. 2013;10(2):e1001380. 3. Tseli E, Boersma K, Stålnacke B-M, Enthoven P, Gerdle B, Äng BO, Grooten WJA. Prognostic Factors for Physical Functioning After Multidisciplinary Rehabilitation in Patients With Chronic Musculoskeletal Pain: A Systematic Review and Meta-Analysis. Clin J Pain. 2019;35(2):148–73.
4. Mallen CD, Peat G, Thomas E, Dunn KM, Croft PR. Prognostic factors for musculoskeletal pain in primary care: a systematic review. Br J Gen Pract. 2007;57(541):655–61.
5. Croft P, Altman DG, Deeks JJ, Dunn KM, Hay AD, Hemingway H, LeResche L, Peat G, Perel P, Petersen SE, et al. The science of clinical practice: disease diagnosis or patient prognosis? Evidence about“what is likely to happen” should shape clinical practice. BMC Med. 2015;13:20.
6. Hemingway H, Croft P, Perel P, Hayden JA, Abrams K, Timmis A, Briggs A, Udumyan R, Moons KGM, Steyerberg EW, et al. Prognosis research strategy (PROGRESS) 1: a framework for researching clinical outcomes. BMJ. 2013;346:e5595. 7. Altman DG. Systematic reviews of evaluations of prognostic variables. BMJ.
2001;323(7306):224–8.
8. Altman DG, Riley RD. Primer: an evidence-based approach to prognostic markers. Nat Clin Pract Oncol. 2005;2(9):466–72.
9. Hemingway H, Riley RD, Altman DG. Ten steps towards improving prognosis research. BMJ. 2009;339:b4184.
10. Group CCPM: The Cochrane Collaboration Prognosis Methods Group, Review Tools. 2018.
11. Hayden JA, van Der Windt DA, Cartwright JL, Côté P, Bombardier C. Assessing bias in studies of prognostic factors. Ann Intern Med. 2013; 158(4):280.
12. Tseli E, Grooten WJA, Stålnacke B-M, Boersma K, Enthoven P, Gerdle B, Äng BO. Predictors of multidisciplinary rehabilitation outcomes in patients with chronic musculoskeletal pain: protocol for a systematic review and meta-analysis. Syst Rev. 2017;6(1):199.
13. McHugh ML. Interrater reliability: the kappa statistic. Biochem Med. 2012; 22(3):276–82.
14. Chapple CM, Nicholson H, Baxter GD, Abbott JH. Patient characteristics that predict progression of knee osteoarthritis: a systematic review of prognostic studies. Arthritis Care Res. 2011;63(8):1115–25.
15. Elshout G, Monteny M, van der Wouden JC, Koes BW, Berger MY. Duration of fever and serious bacterial infections in children: a systematic review. BMC Fam Pract. 2011;12(1):33.
16. Gieteling MJ, Bierma-Zeinstra SM, Lisman-van Leeuwen Y, Passchier J, Berger MY. Prognostic factors for persistence of chronic abdominal pain in children. J Pediatr Gastroenterol Nutr. 2011;52(2):154–61.
17. Singh AS, Mulder C, Twisk JW, van Mechelen W, Chinapaw MJ. Tracking of childhood overweight into adulthood: a systematic review of the literature. Obes Rev. 2008;9(5):474–88.
18. Spee LA, Madderom MB, Pijpers M, van Leeuwen Y, Berger MY. Association between helicobacter pylori and gastrointestinal symptoms in children. Pediatrics. 2010;125(3):e651–69.
19. Jeejeebhoy FM, Zelop CM, Windrim R, Carvalho JC, Dorian P, Morrison LJ. Management of cardiac arrest in pregnancy: a systematic review. Resuscitation. 2011;82(7):801–9.
20. Johnson SR, Swinton JR, Granton JT. Prognostic factors for survival in scleroderma associated pulmonary arterial hypertension. J Rheumatol. 2008; 35(8):1584–90.
21. Van Drongelen A, Boot CR, Merkus SL, Smid T, Van Der Beek AJ. The effects of shift work on body weight change—a systematic review of longitudinal studies. Scand J Work Environ Health. 2011;37:263–75.
22. Wright AA, Cook C, Abbott JH. Variables associated with the progression of hip osteoarthritis: a systematic review. Arthritis Care Res. 2009;61(7):925–36. 23. Kamper SJ, Rebbeck TJ, Maher CG, McAuley JH, Sterling M. Course and
prognostic factors of whiplash: a systematic review and meta-analysis. Pain. 2008;138(3):617–29.
24. Bruls VE, Bastiaenen CH, de Bie RA. Prognostic factors of complaints of arm, neck, and/or shoulder: a systematic review of prospective cohort studies. Pain. 2015;156(5):765–88.
25. den Bakker CM, Anema JR, Zaman AG, de Vet HC, Sharp L, Angenete E, Allaix ME, Otten RH, Huirne JA, Bonjer HJ. Prognostic factors for return to work and work disability among colorectal cancer survivors; A systematic review. PLoS One. 2018;13(8):e0200720.
26. Bollen L, Jacobs W, Van der Linden Y, Van der Hel O, Taal W, Dijkstra P. A systematic review of prognostic factors predicting survival in patients with spinal bone metastases. Eur Spine J. 2018;27(4):799–805.
27. Paxton D, Pauling JD. Does nailfold capillaroscopy help predict future outcomes in systemic sclerosis? A systematic literature review. Seminars in Arthritis and Rheumatism. 2018;48(3):482–94.
28. Sim J, Wright CC. The kappa statistic in reliability studies: use, interpretation, and sample size requirements. Phys Ther. 2005;85(3):257–68.