Citation for the original published paper (version of record):
Forouzanfar, M H., Afshin, A., Alexander, L T., Anderson, H R., Bhutta, Z. et al. (2016)
Global, regional, and national comparative risk assessment of 79 behavioural, environmental
and occupational, and metabolic risks or clusters of risks, 1990-2015: a systematic analysis for
the Global Burden of Disease Study 2015.
The Lancet, 388(10053): 1659-1724
https://doi.org/10.1016/S0140-6736(16)31679-8
Access to the published version may require subscription.
N.B. When citing this work, cite the original published paper.
Permanent link to this version:
Global, regional, and national comparative risk assessment of
79 behavioural, environmental and occupational, and metabolic
risks or clusters of risks, 1990–2015: a systematic analysis for the
Global Burden of Disease Study 2015
GBD 2015 Risk Factors Collaborators*
Summary
Background
The Global Burden of Diseases, Injuries, and Risk Factors Study 2015 provides an up-to-date synthesis of
the evidence for risk factor exposure and the attributable burden of disease. By providing national and subnational
assessments spanning the past 25 years, this study can inform debates on the importance of addressing risks in context.
Methods
We used the comparative risk assessment framework developed for previous iterations of the Global Burden of
Disease Study to estimate attributable deaths, disability-adjusted life-years (DALYs), and trends in exposure by age group,
sex, year, and geography for 79 behavioural, environmental and occupational, and metabolic risks or clusters of risks
from 1990 to 2015. This study included 388 risk-outcome pairs that met World Cancer Research Fund-defi ned criteria for
convincing or probable evidence. We extracted relative risk and exposure estimates from randomised controlled trials,
cohorts, pooled cohorts, household surveys, census data, satellite data, and other sources. We used statistical models to
pool data, adjust for bias, and incorporate covariates. We developed a metric that allows comparisons of exposure across
risk factors—the summary exposure value. Using the counterfactual scenario of theoretical minimum risk level, we
estimated the portion of deaths and DALYs that could be attributed to a given risk. We decomposed trends in attributable
burden into contributions from population growth, population age structure, risk exposure, and risk-deleted
cause-specifi c DALY rates. We characterised risk exposure in relation to a Socio-demographic Index (SDI).
Findings
Between 1990 and 2015, global exposure to unsafe sanitation, household air pollution, childhood underweight,
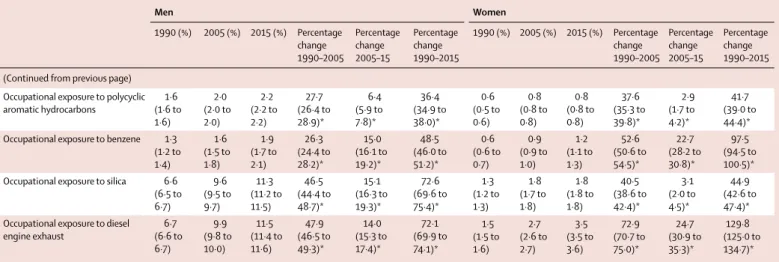
childhood stunting, and smoking each decreased by more than 25%. Global exposure for several occupational risks,
high body-mass index (BMI), and drug use increased by more than 25% over the same period. All risks jointly evaluated
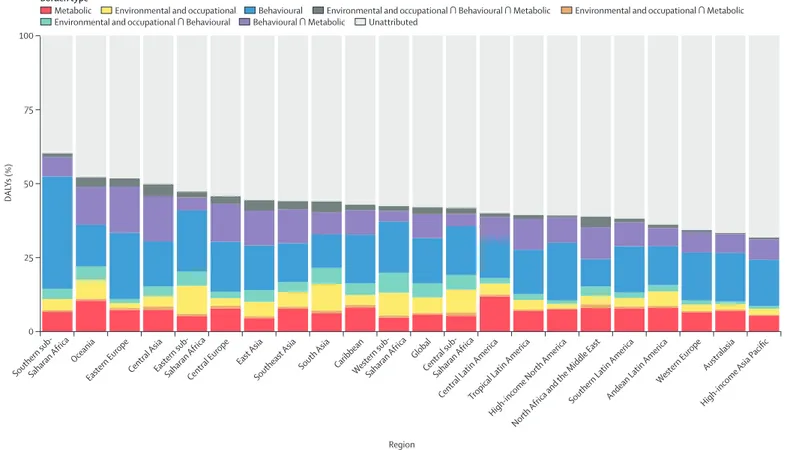
in 2015 accounted for 57·8% (95% CI 56·6–58·8) of global deaths and 41·2% (39·8–42·8) of DALYs. In 2015, the ten
largest contributors to global DALYs among Level 3 risks were high systolic blood pressure (211·8 million [192·7 million
to 231·1 million] global DALYs), smoking (148·6 million [134·2 million to 163·1 million]), high fasting plasma glucose
(143·1 million [125·1 million to 163·5 million]), high BMI (120·1 million [83·8 million to 158·4 million]), childhood
undernutrition (113·3 million [103·9 million to 123·4 million]), ambient particulate matter (103·1 million [90·8 million
to 115·1 million]), high total cholesterol (88·7 million [74·6 million to 105·7 million]), household air pollution
(85·6 million [66·7 million to 106·1 million]), alcohol use (85·0 million [77·2 million to 93·0 million]), and diets high
in sodium (83·0 million [49·3 million to 127·5 million]). From 1990 to 2015, attributable DALYs declined for
micronutrient defi ciencies, childhood undernutrition, unsafe sanitation and water, and household air pollution;
reductions in risk-deleted DALY rates rather than reductions in exposure drove these declines. Rising exposure
contributed to notable increases in attributable DALYs from high BMI, high fasting plasma glucose, occupational
carcinogens, and drug use. Environmental risks and childhood undernutrition declined steadily with SDI; low physical
activity, high BMI, and high fasting plasma glucose increased with SDI. In 119 countries, metabolic risks, such as high
BMI and fasting plasma glucose, contributed the most attributable DALYs in 2015. Regionally, smoking still ranked
among the leading fi ve risk factors for attributable DALYs in 109 countries; childhood underweight and unsafe sex
remained primary drivers of early death and disability in much of sub-Saharan Africa.
Interpretation
Declines in some key environmental risks have contributed to declines in critical infectious diseases.
Some risks appear to be invariant to SDI. Increasing risks, including high BMI, high fasting plasma glucose, drug use,
and some occupational exposures, contribute to rising burden from some conditions, but also provide opportunities
for intervention. Some highly preventable risks, such as smoking, remain major causes of attributable DALYs, even as
exposure is declining. Public policy makers need to pay attention to the risks that are increasingly major contributors
to global burden.
Funding
Bill & Melinda Gates Foundation.
Copyright
© The Author(s). Published by Elsevier Ltd. This is an Open Access article under the CC BY license.
Lancet 2016; 388: 1659–724 This online publication has been corrected. The corrected version first appeared at thelancet.com on January 5, 2017
See Editorial page 1447 See Comment pages 1448 and 1450
*Collaborators listed at the end of the Article
Correspondence to: Prof Christopher J L Murray, Institute for Health Metrics and Evaluation, Seattle, WA 98121, USA
Introduction
Analysis of the causes of poor health—specifi cally, the
connections between risk factors and development of
poor health—can provide insights into opportunities
and priorities for prevention, research, policy, and
development. One of the mainstays of modern
epidem-iology is quantifi cation of elevated risks for particular
diseases or injuries from exposure to a given risk factor
for groups of individuals. Quantifi cation of elevated risk
for exposed groups of individuals from an array of
risk-outcome pairs is important to inform decision making on
individual health; however, public policy debates require
the comprehensive metric of population-level risk, which
is a function of elevated risk in the exposed population
and the fraction of the population exposed to a given risk.
Eff orts to measure population risk have combined data for
excess risk with the number of individuals exposed to
provide comparative quantifi cation of diff erent health
risks for populations that have been infl uential in
establishment of policy priorities.
1,2The comparative risk assessment (CRA) approach
developed for the Global Burden of Diseases, Injuries, and
Risk Factors (GBD) Study
3,4provides an overarching
conceptual framework for population risk assessment
across risks and over time. The scale of the GBD Study
required extensive work to develop exposure metrics,
assess relationships, and compile health data from
diff erent parts of the world with diff ering levels of metadata
and uncertainty, and the unique contribution of this work
has been broadly recognised.
5–7A robust debate on specifi c
risks and results emerged after publication of the Global
Burden of Diseases, Injuries, and Risk Factors Study 2013
(GBD 2013).
8Inclusion and exclusion of particular risks
and outcomes;
3,4,9the optimum targets for indicators such
as high systolic blood pressure,
10,11cholesterol,
11,12diets high
in sodium,
13and air pollution;
4,14and the certainty of some
dietary components of risk
8,15were challenged, in addition
to some details of methods. Underlying many of these
discussions were heterogeneities in the strength of causal
evidence for diff erent risk-outcome pairs.
8The Global Burden of Diseases, Injuries, and Risk
Factors Study 2015 (GBD 2015) CRA, in addition to
updating data and methods, adds new transparency about
the evidence supporting causal connections for each of the
388 risk-outcome pairs included in the analysis, allows the
quantifi cation and reporting of levels and trends in
exposure, decomposes changes in attributable burden into
population growth, ageing, risk exposure, and risk-deleted
disability-adjusted life-year (DALY) rates, and examines
how risks change with development. As with all iterations
of the GBD Study, GBD 2015 results presented here
supersede all previously published GBD CRA estimates.
Methods
Overview
The CRA conceptual framework was developed by
Murray and Lopez,
16who established a causal web of
hierarchically organised risks or causes that contribute to
Research in context
Evidence before this study
The most recent assessment of attributable deaths and
disability-adjusted life-years (DALYs) at the global, regional, and
national level was the Global Burden of Diseases, Injuries, and
Risk Factors Study 2013, which covered 79 risk factors or
combinations of risks from 1990 to 2013 in 188 countries.
Added value of this study
This study (the Global Burden of Diseases, Injuries, and Risk
Factors Study 2015) incorporates recently published studies,
newly acquired data for exposure to relative risks, and new
risk-outcome pairs meeting study inclusion criteria. To enhance
transparency of the supporting evidence, we provided an
assessment of the strength of evidence supporting causality for
all 388 risk-outcome pairs. For the fi rst time, we separately
assessed trends in risk exposure by computing a summary
exposure value, which allows comparisons over time and across
place for dichotomous, polytomous, and continuous risks.
Quantifi cation of exposure trends allowed decomposition of
trends in attributable DALYs into the portion contributed by
changes in population growth, population structure, exposure,
and risk-deleted DALY rates. We found that reductions in
exposure have been key drivers of change for only a small set of
environmental risks, including sanitation, household air
pollution, and behavioural risks (eg, undernutrition and
smoking). For many risks, trends in attributable DALYs have
been driven by the interplay between population growth,
ageing, and declines in risk-deleted DALY rates. For some
risks, including body-mass index, fasting plasma glucose,
occupational exposure to carcinogens, and drug use, exposure is
increasing and driving up attributable burden. Although an
average risk transition has occurred as countries move through
the development continuum, many risks initially increase and
then decline at the highest development levels. We document
leading risks for each country and territory included in the study.
Implications of all the available evidence
Risk assessments allow identifi cation of several groups of risk
factors that deserve policy attention. Risks such as smoking,
unsafe sanitation, and childhood undernutrition still cause
many attributable DALYs, but recent trends show that exposure
can be reduced. This assessment of risk also shows many large
global risks for which changes in exposure are slow, such as
high systolic blood pressure, ambient air pollution, diets high in
sodium, high cholesterol, and alcohol intake, highlighting huge
opportunities for intervention. Two large risks—high BMI and
high fasting plasma glucose—have particularly large and
concerning increases in exposure.
health outcomes (methods appendix p 161), which allows
quantifi cation of risks or causes at any level in the
framework. In GBD 2015, as in previous iterations of
the GBD Study, we evaluated a set of behavioural,
environmental and occupational, and metabolic risks,
where risk-outcome pairs were included based on
evidence rules (methods appendix p 161). These risks
were organised into four hierarchical levels, described in
table 1. To date, we have not quantifi ed the contribution
of other classes of risk factors (methods appendix p 161);
however, using an analysis of the relationship between
risk exposures and development, measured with use of
the Socio-demographic Index (SDI), we provide some
insights into the potential magnitude of distal social,
cultural, and economic factors.
Two types of risk assessments are possible within the
CRA framework: attributable burden and avoidable
burden. Attributable burden is the reduction in current
disease burden that would have been possible if past
population exposure had shifted to an alternative or
counterfactual distribution of risk exposure. Avoidable
burden is the potential reduction in future disease
burden that could be achieved by changing the current
distribution of exposure to a counterfactual distribution
of exposure. Murray and Lopez
16identifi ed four types
of counterfactual exposure distributions: theoretical,
plausible, feasible, and cost-eff ective minimum risk. In
GBD studies to date and in this study, we focus on
attributable burden using the theoretical minimum risk
level (TMREL), which is the level of risk exposure that
minimises risk at the population level, or the level of risk
that captures the maximum attributable burden.
Overall, this analysis follows the CRA methods used in
GBD 2013.
4The methods described in this study provide
a high-level overview of the analytical logic, with a focus
on areas of notable change from the methods used in
GBD 2013, with details provided in the methods
appendix. This study complies with the Guidelines for
Accurate and Transparent Health Estimates Reporting
statement (methods appendix pp 177–79).
17Geographic units of analysis and years for estimation
In the GBD framework, geographies have been arranged
as a set of hierarchical categories: seven super-regions,
21 regions nested within the seven super-regions, and
195 countries and territories nested in the 21 regions.
Additionally, GBD collaborator interest and availability of
data resulted in an expansion of countries for which we
disaggregate our estimates at the subnational level. At the
fi rst level of subnational division, 256 geographic units
are included in GBD 2015. For this study, we present
results for the 195 national and territory-level geographies.
We produced a complete set of age-specifi c, sex-specifi c,
cause-specifi c, and location-specifi c estimates of risk
factor exposure and attributable burden for 1990, 1995,
2000, 2005, 2010, and 2015 for included risk factors.
Results presented in this study emphasise results for
1990, 2005, and 2015; online data visualisations provide
access to results for all GBD metrics from 1990 to 2015.
Attributable burden formula
Four key components are included in estimation of the
burden attributable to a given risk factor: the metric of
burden being assessed (number of deaths, years of life lost
[YLLs], years lived with disability [YLDs], or DALYs [the sum
of YLLs and YLDs]), the exposure levels for a risk factor, the
relative risk of a given outcome due to exposure, and the
counterfactual level of risk factor exposure. Estimates of
attributable DALYs for a risk-outcome pair are equal to
DALYs for the outcome multiplied by the population
attributable fraction (PAF) for the risk-outcome pair for a
given age, sex, location, and year. A similar logic applies for
estimation of attributable deaths, YLLs, or YLDs. Risks are
categorised on the basis of how exposure was measured:
dichotomous, polytomous, and continuous. The PAF
represents the proportion of risk that would be reduced in a
given year if the exposure to a risk factor in the past were
reduced to a counterfactual level of exposure (methods
appendix p 27).
Causal evidence for risk-outcome pairs
In this study, as in GBD 2013, we have included
risk-outcome pairs that we have assessed as meeting the World
Cancer Research Fund grades of convincing or probable
evidence (methods appendix pp 12–13 contains defi nitions
of these grades).
9Table 2 provides a summary of the
evidence supporting a causal relationship between a risk
and an outcome for each pair included in GBD 2015. For
each risk-outcome pair, we used recent systematic reviews
to identify independent prospective studies (randomised
controlled trials, non-randomised interventions, and
cohorts) that evaluated the putative relationship. For
risk-outcome pairs for which no recent systematic review was
available, we either updated reviews developed for GBD
2013 or did a new systematic search of literature (methods
appendix pp 44–159). Table 2 summarises the evidence
using multiple dimensions, which supports our
assessment that each included risk-outcome pair meets
the criteria of convincing or probable evidence (methods
appendix [pp 12–13] contains a justifi cation of the criteria
presented to support causality). In this summary of
evidence, we have focused on randomised controlled trials
and prospective observational studies, along with
supporting evidence, like dose-response relationships and
biologically plausible mechanisms. Other evidence
supporting causal connections, such as case-control
studies, are not summarised in table 2.
Estimation process
Information about the data sources, estimation methods,
computational tools, and statistical analysis used in
derivation of our estimates are provided in the methods
appendix. The analytical steps for estimation of burden
attributable to single or clusters of risk-outcome pairs are
See Online for appendix
For the online data visualisations see http://vizhub. healthdata.org/gbd-compare
Exposure defi nition Theoretical minimum risk exposure level Data representativeness index
<2005 2005–15 Total
All risk factors ·· ·· 100·0% 100·0% 100·0%
Environmental and occupational risks ·· ·· 100·0% 100·0% 100·0%
Unsafe water, sanitation, and handwashing
·· ·· 73·2% 60·6% 78·8%
Unsafe water source Proportion of households with access to diff erent water sources (unimproved, improved except piped, piped water supply) and reported use of household water treatment methods (boiling or fi ltering; chlorinating or solar fi ltering; no treatment)
All households have access to water from a piped water supply that is also boiled or fi ltered before drinking
83·5% 70·1% 88·4%
Unsafe sanitation Proportion of households with access to diff erent sanitation facilities (unimproved, improved except sewer, sewer connection)
All households have access to toilets with sewer connection
83·5% 69·5% 88·4%
No handwashing with soap Proportion of individuals who wash their hands with soap and water after potential faecal contact
All individuals wash hands with soap and water after potential faecal contact
7·6% 24·2% 27·3%
Air pollution ·· ·· 100·0% 100·0% 100·0%
Ambient particulate matter pollution
Annual average daily exposure to outdoor air concentrations of PM with an aerodynamic diameter smaller than 2·5 μm, measured in μg/m³
Uniform distribution between 2·4 μg/m³ and 5·9 μg/m³
100·0% 100·0% 100·0%
Household air pollution from solid fuels
Annual average daily exposure to household concentrations of PM with an aerodynamic diameter smaller than 2·5 μm, measured in μg/m³ from solid fuel use (coal, wood, charcoal, dung, and agricultural residues)
No households are exposed to excess indoor concentration of particles from solid fuel use (assuming concentration of particulate matters, aerodynamic diameter smaller than 2·5 μm, measured in μg/m³ in no fuel use is consistent with a theoretical minimum risk level of 2·4–5·9)
69·7% 60·6% 75·8%
Ambient ozone pollution Seasonal (3 month) hourly maximum ozone concentrations, measured in ppb
Uniform distribution between 33·3 μg/m³ and 41·9 μg/m³, according to minimum/5th percentile concentrations
100·0% 100·0% 100·0%
Other environmental risks ·· ·· 44·9% 40·9% 47·0%
Residential radon Average daily exposure to indoor air radon levels measured in becquerels (radon disintegrations per s) per cubic metre (Bq/m³)
10 Bq/m³, corresponding to the outdoor concentration of radon
36·4% 36·4% 36·4%
Lead exposure Blood lead levels in μg/dL of blood, bone lead levels in μg/g of bone
2 μg/dL, corresponding to lead levels in preindustrial humans as natural sources of lead prevent the feasibility of zero exposure
33·3% 19·2% 36·9%
Occupational risks ·· ·· 94·4% 93·4% 94·4%
Occupational carcinogens 94·4% 93·4% 94·4%
Occupational exposure to asbestos Proportion of the population with cumulative exposure to asbestos
No occupational exposure to asbestos 94·4% 93·4% 94·4%
Occupational exposure to arsenic Proportion of the population ever exposed to arsenic at work/through their occupation
No occupational exposure to arsenic 94·4% 93·4% 94·4%
Occupational exposure to benzene Proportion of the population ever exposed to benzene at work/through their occupation
No occupational exposure to benzene 94·4% 93·4% 94·4%
Occupational exposure to beryllium
Proportion of the population ever exposed to beryllium at work/through their occupation
No occupational exposure to beryllium 94·4% 93·4% 94·4%
Occupational exposure to cadmium
Proportion of the population ever exposed to cadmium at work/through their occupation
No occupational exposure to cadmium 94·4% 93·4% 94·4%
Occupational exposure to chromium
Proportion of the population ever exposed to chromium at work/through their occupation
No occupational exposure to chromium 94·4% 93·4% 94·4%
Occupational exposure to diesel engine exhaust
Proportion of the population ever exposed to diesel engine exhaust at work/through their occupation
No occupational exposure to diesel engine exhaust 94·4% 93·4% 94·4%
Occupational exposure to second-hand smoke
Proportion of the population ever exposed to second-hand smoke at work/through their occupation
No occupational exposure to second-hand smoke 94·4% 93·4% 94·4%
Occupational exposure to formaldehyde
Proportion of the population ever exposed to formaldehyde at work/through their occupation
No occupational exposure to formaldehyde 94·4% 93·4% 94·4%
Occupational exposure to nickel Proportion of the population ever exposed to nickel at work/through their occupation
No occupational exposure to nickel 94·4% 93·4% 94·4%
Occupational exposure to polycyclic aromatic hydrocarbons
Proportion of the population ever exposed to polycyclic aromatic hydrocarbons at work/through their occupation
No occupational exposure to polycyclic aromatic hydrocarbons
94·4% 93·4% 94·4%
Exposure defi nition Theoretical minimum risk exposure level Data representativeness index
<2005 2005–15 Total (Continued from previous page)
Occupational exposure to silica Proportion of the population ever exposed to silica at work/ through their occupation
No occupational exposure to silica 94·4% 93·4% 94·4%
Occupational exposure to sulphuric acid
Proportion of the population ever exposed to sulphuric acid at work/through their occupation
No occupational exposure to sulphuric acid 94·4% 93·4% 94·4%
Occupational exposure to trichloroethylene
Proportion of the population ever exposed to trichloroethylene at work/through their occupation
No occupational exposure to trichloroethylene 94·4% 93·4% 94·4%
Occupational asthmagens Proportion of the population currently exposed to asthmagens at work/through their occupation
Background asthmagen exposures 94·4% 93·4% 94·4%
Occupational particulate matter, gases, and fumes
Proportion of the population ever exposed to particulates, gases, or fumes at work/through their occupation
No occupational exposure to particulates, gases, or fumes
94·4% 93·4% 94·4%
Occupational noise Proportion of the population ever exposed to noise greater than 85 decibels at work/through their occupation
Background noise exposure 94·4% 93·4% 94·4%
Occupational injuries Proportion of the population at risk of injuries related to work/through their occupation
The rate of injury deaths per 100 000 person-years is zero
24·2% 32·3% 35·4%
Occupational ergonomic factors Proportion of the population who are exposed to ergonomic risk factors for low back pain at work/through their occupation
All individuals have the ergonomic factors of clerical and related workers
94·4% 93·4% 94·4%
Behavioural risks ·· ·· 100·0% 100·0% 100·0%
Child and maternal malnutrition ·· ·· 93·9% 91·4% 93·9%
Suboptimal breastfeeding 70·7% 57·6% 77·8%
Non-exclusive breastfeeding Proportion of children younger than 6 months who receive predominant, partial, or no breastfeeding
All children are exclusively breastfed for fi rst 6 months of life
70·7% 57·6% 77·8%
Discontinued breastfeeding Proportion of children aged 6–23 months who do not receive any breastmilk
All children continue to receive breastmilk until 2 years of age
68·1% 65·3% 79·2%
Childhood undernutrition 77·8% 61·6% 79·3%
Childhood underweight Proportion of children less than –3 SDs, –3 to –2 SDs, and –2 to –1 SDs of the WHO 2006 standard weight-for-age curve
All children are above –1 SD of the WHO 2006 standard weight-for-age curve
77·3% 61·6% 78·8%
Childhood wasting Proportion of children less than –3 SDs, –3 to –2 SDs, and –2 to –1 SDs of the WHO 2006 standard weight-for-length curve
All children are above –1 SD of the WHO 2006 standard weight-for-height curve
75·8% 61·1% 79·3%
Childhood stunting Proportion of children less than –3 SDs, –3 to –2 SDs, and –2 to –1 SDs of the WHO 2006 standard height-for-age curve
All children are above –1 SD of the WHO 2006 standard height-for-height curve
92·3% 79·6% 93·7%
Iron defi ciency Peripheral blood haemoglobin concentration in g/L Country specifi c 66·8% 30·7% 68·3%
Vitamin A defi ciency Proportion of children aged 28 days to 5 years with serum retinol concentration <0·7 μmol/L
No childhood vitamin A defi ciency 38·9% 5·1% 40·9%
Zinc defi ciency Proportion of the population with inadequate zinc intake versus loss
No inadequate zinc intake 84·3% 84·3% 84·3%
Tobacco smoke ·· ·· 87·9% 94·4% 97·0%
Smoking Proportion of the population with cumulative exposure to tobacco smoking; proportion of the population who currently smoke
100% of population are lifelong non-smokers 84·8% 92·4% 95·5%
Second-hand smoke Average daily exposure to indoor air PM from second-hand smoke with an aerodynamic diameter smaller than 2·5 μg, measured in μg/m³
No second-hand smoke exposure 58·6% 79·8% 86·4%
Alcohol and drug use ·· ·· 100·0% 100·0% 100·0%
Alcohol use Average daily alcohol consumption of pure alcohol (measured in g/day) in current drinkers who had consumed alcohol during the past 12 months; binge drinking: proportion of the population reporting binge consumption of at least 60 g for males and 48 g for females of pure alcohol on a single occasion
No alcohol consumption 100·0% 100·0% 100·0%
Drug use Proportion of the population dependent on opioids, cannabis, cocaine, or amphetamines; proportion of the population who have ever injected drugs
No use 26·3% 49·0% 50·0%
Exposure defi nition Theoretical minimum risk exposure level Data representativeness index
<2005 2005–15 Total (Continued from previous page)
Dietary risks ·· ·· 90·4% 92·4% 92·9%
Diet low in fruits Average daily consumption of fruits (fresh, frozen, cooked, canned, or dried, excluding fruit juices and salted or pickled fruits)
Consumption of fruit between 200 g and 300 g per day
88·9% 88·9% 88·9%
Diet low in vegetables Average daily consumption of vegetables (fresh, frozen, cooked, canned or dried vegetables including legumes but excluding salted or pickled vegetables, juices, nuts and seeds, and starchy vegetables such as potatoes or corn)
Consumption of vegetables between 340 g and 500 g per day
88·9% 88·9% 88·9%
Diet low in whole grains Average daily consumption of whole grains (bran, germ, and endosperm in their natural proportion) from breakfast cereals, bread, rice, pasta, biscuits, muffi ns, tortillas, pancakes, and other sources
Consumption of whole grains between 100 g and 150 g per day
10·6% 9·1% 16·2%
Diet low in nuts and seeds Average daily consumption of nut and seed foods Consumption of nuts and seeds between 16 g and 25 g per day
88·9% 88·9% 88·9%
Diet low in milk Average daily consumption of milk, including non-fat, low-fat, and full-fat milk, excluding soy milk and other plant derivatives
Consumption of milk between 350 g and 520 g per day
88·9% 88·9% 88·9%
Diet high in red meat Average daily consumption of red meat (beef, pork, lamb, and goat but excluding poultry, fi sh, eggs, and all processed meats)
Consumption of red meat between 18 g and 27 g per day
88·9% 88·9% 88·9%
Diet high in processed meat Average daily consumption of meat preserved by smoking, curing, salting, or addition of chemical preservatives
Consumption of processed meat between 0 g and 4 g per day
22·2% 11·6% 27·3%
Diet high in sugar-sweetened beverages
Average daily consumption of beverages with ≥50 kcal per 226·8 g serving, including carbonated beverages, sodas, energy drinks, and fruit drinks, but excluding 100% fruit and vegetable juices
Consumption of sugar-sweetened beverages between 0 g and 5 g per day
22·2% 12·6% 26·8%
Diet low in fi bre Average daily intake of fi bre from all sources, including fruits, vegetables, grains, legumes, and pulses
Consumption of fi bre between 19 g and 28 g per day
88·9% 88·9% 88·9%
Diet low in calcium Average daily intake of calcium from all sources, including milk, yogurt, and cheese
Consumption of calcium between 1·00 g and 1·50 g per day
88·9% 88·9% 88·9%
Diet low in seafood omega-3 fatty acids
Average daily intake of eicosapentaenoic acid and docosahexaenoic acid
Consumption of seafood omega-3 fatty acids between 200 mg and 300 mg per day
88·9% 88·9% 88·9%
Diet low in polyunsaturated fatty acids
Average daily intake of omega-6 fatty acids from all sources, mainly liquid vegetable oils, including soybean oil, corn oil, and saffl ower oil
Consumption of polyunsaturated fatty acids between 9% and 13% of total daily energy
88·9% 88·9% 88·9%
Diet high in trans fatty acids Average daily intake of trans fat from all sources, mainly partially hydrogenated vegetable oils and ruminant products
Consumption of trans fatty acids between 0% and 1% of total daily energy
39·9% 39·4% 39·9%
Diet high in sodium 24 h urinary sodium measured in g per day 24 h urinary sodium between 1 g and 5 g per day 28·8% 13·1% 32·3%
Sexual abuse and violence ·· ·· 43·9% 59·1% 66·2%
Childhood sexual abuse Proportion of the population who have ever experienced one or more acts of childhood sexual abuse, defi ned as the experience with an older person of unwanted non-contact, contact abuse, or intercourse, when aged 15 years or younger
No childhood sexual abuse 27·8% 19·7% 34·3%
Intimate partner violence Proportion of the population who have ever experienced one or more acts of physical or sexual violence by a present or former intimate partner since age 15 years
No intimate partner violence 41·9% 56·6% 63·6%
Unsafe sex Proportion of the population with exposure to sexual encounters that convey the risk of disease
No exposure to a disease agent through sex 17·7% 48·0% 48·0%
Low physical activity Average weekly physical activity at work, at home, transport related, and recreational measured by MET min per week
Highly active, ≥8000 MET min per week 45·5% 50·5% 66·7%
Metabolic risks ·· ·· 83·8% 88·4% 93·9%
High fasting plasma glucose Serum fasting plasma glucose measured in mmol/L 4·8–5·4 46·0% 60·1% 71·2%
High total cholesterol Serum total cholesterol, measured in mmol/L 2·78–3·38 49·5% 48·5% 69·2%
High systolic blood pressure Systolic blood pressure, measured in mm Hg 110–115 55·1% 66·2% 79·3%
summarised in the methods appendix (p 162). Table 1
provides defi nitions of exposure for each risk factor, the
TMREL used, and metrics of data availability. For each
risk, we estimated eff ect size as a function of age and sex
and exposure level, mean exposure, the distribution of
exposure across individuals, and the TMREL. The
approach taken is largely similar to GBD 2013 for
each quantity for each risk. Some methodological
improvements have been implemented and new data
sources incorporated. The methods appendix (pp 44–159)
provides details of each step by risk. Citation information
for the data sources used for relative risks are provided in
searchable form through a web tool. We estimate the
joint eff ects of combinations of risk factors using the
same methods as GBD 2013, namely using published
studies to estimate the fraction of a risk that was mediated
through the other risk (methods appendix pp 28–35).
Relative risks by age and sex for each risk factor and
outcome pair are provided in the methods appendix
(pp 215–44).
All point estimates are reported with 95% uncertainty
intervals (UIs). UIs include uncertainty from each
relevant component, consisting of exposure, relative
risks, TMREL, and burden rates. Where percentage
change is reported (with 95% UIs), we computed it on
the basis of the point estimates being compared. In this
study, we provide further methodological detail on new
extensions to the CRA analysis.
Summary exposure value calculation
In previous GBD studies, we did not report comparable
exposure metrics for the risk factors included because of
the complexity of quantifi cation of polytomous and
continuous risks.
18Because of substantial interest in the
trends in exposure, we developed a summary measure of
exposure for each risk. This measure, called the summary
exposure value (SEV), is the relative risk-weighted
prevalence of exposure. Formally, it is defi ned as:
where Pr
iis prevalence of category i exposure, RR
iis
relative risk of the category i, and RR
maxis the maximum
relative risk observed (between categories). This quantity
is estimated for each age, sex, location, year, and outcome.
For each risk factor, a single SEV is estimated by
averaging of the outcome of specifi c SEV values for each
age, sex, location, and year across outcomes. In the case
of dichotomous exposure, SEV is equal to prevalence.
For continuous risks:
where P(x) is the density of exposure at level x of
exposure, RR(x) is relative risk of the level x, and RR
maxis
the highest relative risk that is supported by data and
refl ects a level where more than 1% of the global
population are exposed to that level or a higher risk.
SEV takes the value zero when no excess risk for a
population exists and the value one when the population
is at the highest level of risk; we report SEV on a scale
from 0% to 100% to emphasise that it is risk-weighted
prevalence. We computed as the level for exposure with
the highest relative risk supported by cohort or trial data
and for which at least 1% or more of the global
population is exposed. For comparison purposes, we
have also computed age-standardised SEVs for every
risk factor from the most detailed level using the GBD
population standard.
Decomposition of changes in deaths and DALYs into the
contribution of population growth, ageing, risk
exposure, and risk-deleted DALY rates
We did two related decomposition analyses of changes in
DALYs from 1990 to 2015: decomposing changes in
cause-specifi c DALYs due to changes in population
growth, population age structure, exposure to all risks for
a disease, and risk-deleted death and DALY rates; and
decomposing changes in risk-attributable all-cause
DALYs due to changes in population growth, population
age structure, risk exposure to the single risk factor, and
Exposure defi nition Theoretical minimum risk exposure level Data representativeness index
<2005 2005–15 Total (Continued from previous page)
High body-mass index Body-mass index, measured in kg/m² 20–25 78·3% 83·3% 90·9%
Low bone mineral density Standardised mean bone mineral density values measured at the femoral neck in g/cm²
99th percentile of NHANES 2005–10 by age and sex 23·7% 11·1% 25·8%
Low glomerular fi ltration rate Proportion of the population with a glomerular fi ltration rate <60 mL/min per 1·73 m², and excluding end-stage renal disease
>60 mL/min per 1·73 m² 9·1% 17·2% 20·2%
The percentage of available data is calculated out of a total of 519 subnational Level 2 geographies. PM=particulate matter. ppb=parts per billion. MET=metabolic equivalent. NHANES=National Health and Nutrition Examination Survey.
Table 1: Global Burden of Disease 2015 risk factor hierarchy, exposure defi nitions, theoretical minimum risk exposure level, and data representativeness index for 1985–2015, pre-2005, and 2005–15
For the web tool see http://ghdx. healthdata.org/
SEV
=
Σ
i=1Pr
iRR
i1
nRR
max1
SEV
=
∫
x=lRR(x)P(x)dx
1
uRR
max1
Outcome RCTs (n) RCTs with signifi cant eff ect in the opposite direction (%) RCTs with null fi ndings (%) Prospective observational studies (n)* Prospective observational studies with signifi cant association in the opposite direction (%) Lower limit of RR >1·5 Dose-response relationship Biological plausibility† Analogy‡
Unsafe water, sanitation, and handwashing
Unsafe water source: chlorination or solar (point-of-use treatment)
Diarrhoeal diseases 24 0 42% 6 0 Yes ·· Yes No
Unsafe water source: fi lter Diarrhoeal diseases 11 0 45% 2 0 Yes ·· Yes No
Unsafe water source: improved water Diarrhoeal diseases 0 ·· ·· 5 0 Yes ·· Yes No
Unsafe water source: improved water Typhoid fever 0 ·· ·· 0 ·· Yes ·· Yes Yes
Unsafe water source: improved water Paratyphoid fever 0 ·· ·· 0 ·· Yes ·· Yes Yes
Unsafe water source: piped Diarrhoeal diseases 1 0 0 9 11% Yes ·· Yes No
Unsafe water source: piped Typhoid fever 0 ·· ·· 0 ·· Yes ·· Yes Yes
Unsafe water source: piped Paratyphoid fever 0 ·· ·· 0 ·· Yes ·· Yes Yes
Unsafe sanitation: improved sanitation Diarrhoeal diseases 0 ·· ·· 9 0 Yes ·· Yes No
Unsafe sanitation: improved sanitation Typhoid fever 0 ·· ·· 0 ·· Yes ·· Yes Yes
Unsafe sanitation: improved sanitation Paratyphoid fever 0 ·· ·· 0 ·· Yes ·· Yes Yes
Unsafe sanitation: piped Diarrhoeal diseases 0 ·· ·· 1 0 Yes ·· Yes No
Unsafe sanitation: piped Typhoid fever 0 ·· ·· 0 ·· Yes ·· Yes Yes
Unsafe sanitation: piped Paratyphoid fever 0 ·· ·· 0 ·· Yes ·· Yes Yes
No handwashing with soap Diarrhoeal diseases 19 0 42% 0 ·· No ·· Yes No
No handwashing with soap Typhoid fever 0 ·· ·· 0 ·· No ·· Yes Yes
No handwashing with soap Paratyphoid fever 0 ·· ·· 0 ·· No ·· Yes Yes
No handwashing with soap Lower respiratory infections 1 0 0 6 0 No ·· Yes No
Air pollution
Ambient particulate matter pollution Lower respiratory infections 0 ·· ·· 13 0 No Yes Yes No
Ambient particulate matter pollution Ischaemic stroke 0 ·· ·· 25 0 No Yes Yes Yes
Ambient particulate matter pollution Haemorrhagic stroke 0 ·· ·· 25 0 No Yes Yes Yes
Ambient particulate matter pollution Ischaemic heart disease 0 ·· ·· 16 0 No Yes Yes Yes
Ambient particulate matter pollution Chronic obstructive pulmonary disease
0 ·· ·· 11 0 No Yes Yes Yes
Ambient particulate matter pollution Tracheal, bronchial, and lung cancer
0 ·· ·· 27 0 No Yes Yes Yes
Household air pollution from solid fuels Lower respiratory infections 0 ·· ·· 0 ·· No Yes Yes No
Household air pollution from solid fuels Cataract 0 ·· ·· 0 ·· No Yes Yes No
Household air pollution from solid fuels Ischaemic stroke 0 ·· ·· 25 0 No Yes Yes Yes
Household air pollution from solid fuels Haemorrhagic stroke 0 ·· ·· 25 0 No Yes Yes Yes
Household air pollution from solid fuels Ischaemic heart disease 0 ·· ·· 16 0 No Yes Yes Yes
Household air pollution from solid fuels Chronic obstructive pulmonary disease
0 ·· ·· 0 ·· No Yes Yes Yes
Household air pollution from solid fuels Tracheal, bronchial, and lung cancer
0 ·· ·· 0 ·· No Yes Yes Yes
Ambient ozone pollution Chronic obstructive pulmonary disease
0 ·· ·· 4 0 No Yes Yes No
Other environmental risks
Residential radon Tracheal, bronchial, and lung cancer
0 ·· ·· 3 0 No Yes Yes No
Lead exposure Systolic blood pressure 0 ·· ·· 3 0 ·· Yes Yes ··
Lead exposure Idiopathic intellectual disability
0 ·· ·· 8 0 No Yes Yes No
Occupational risks
Occupational exposure to asbestos Larynx cancer 0 ·· ·· 27 ·· No ·· Yes Yes
Occupational exposure to asbestos Tracheal, bronchial, and lung cancer
0 ·· ·· 18 0 Yes ·· Yes Yes
Outcome RCTs (n) RCTs with signifi cant eff ect in the opposite direction (%) RCTs with null fi ndings (%) Prospective observational studies (n)* Prospective observational studies with signifi cant association in the opposite direction (%) Lower limit of RR >1·5 Dose-response relationship Biological plausibility† Analogy‡
(Continued from previous page)
Occupational exposure to asbestos Ovarian cancer 0 ·· ·· 15 0 No ·· Yes Yes
Occupational exposure to asbestos Mesothelioma 0 ·· ·· 5 0 Yes ·· Yes Yes
Occupational exposure to arsenic Tracheal, bronchial, and lung cancer
0 ·· ·· 3 0 No ·· Yes No
Occupational exposure to benzene Leukaemia 0 ·· ·· 12 0 Yes ·· Yes No
Occupational exposure to beryllium Tracheal, bronchial, and lung cancer
0 ·· ·· 4 0 No ·· Yes No
Occupational exposure to cadmium Tracheal, bronchial, and lung cancer
0 ·· ·· 7 0 No ·· Yes No
Occupational exposure to chromium Tracheal, bronchial, and lung cancer
0 ·· ·· 26 0 No ·· Yes No
Occupational exposure to diesel engine exhaust
Tracheal, bronchial, and lung cancer
0 ·· ·· 17 0 No ·· Yes No
Occupational exposure to second-hand smoke
Tracheal, bronchial, and lung cancer
0 ·· ·· 25 0 No ·· Yes No
Occupational exposure to formaldehyde
Nasopharyngeal cancer 0 ·· ·· 1 0 No ·· Yes Yes
Occupational exposure to formaldehyde
Leukaemia 0 ·· ·· 12 0 No ·· Yes Yes
Occupational exposure to nickel Tracheal, bronchial, and lung cancer
0 ·· ·· 1 0 No ·· Yes No
Occupational exposure to polycyclic aromatic hydrocarbons
Tracheal, bronchial, and lung cancer
0 ·· ·· 39 0 No ·· Yes No
Occupational exposure to silica Tracheal, bronchial, and lung cancer
0 ·· ·· 17 0 No ·· Yes No
Occupational exposure to sulphuric acid Larynx cancer 0 ·· ·· 3 0 Yes ·· Yes No
Occupational exposure to trichloroethylene
Kidney cancer 0 ·· ·· 20 0 No ·· Yes No
Occupational asthmagens Asthma 0 ·· ·· 3 0 No ·· Yes No
Occupational particulate matter, gases, and fumes
Chronic obstructive pulmonary disease
0 ·· ·· 1 0 No ·· Yes No
Occupational noise Age-related and other hearing loss
0 ·· ·· 4 0 Yes ·· Yes No
Occupational ergonomic factors Low back pain 0 ·· ·· 10 0 No ·· Yes No
Child and maternal malnutrition
Non-exclusive breastfeeding Diarrhoeal diseases 0 ·· ·· 5 0 Yes ·· Yes No
Non-exclusive breastfeeding Lower respiratory infections 0 ·· ·· 6 0 Yes ·· Yes No
Discontinued breastfeeding Diarrhoeal diseases 0 ·· ·· 2 0 No ·· Yes No
Childhood underweight Diarrhoeal diseases 0 ·· ·· 7 ·· Yes ·· Yes No
Childhood underweight Lower respiratory infections 0 ·· ·· 7 ·· Yes ·· Yes No
Childhood underweight Measles 0 ·· ·· 7 ·· Yes ·· Yes No
Childhood wasting Diarrhoeal diseases 0 ·· ·· 7 ·· Yes ·· Yes No
Childhood wasting Lower respiratory infections 0 ·· ·· 7 ·· Yes ·· Yes No
Childhood wasting Measles 0 ·· ·· 7 ·· Yes ·· Yes No
Childhood stunting Diarrhoeal diseases 0 ·· ·· 7 ·· No ·· Yes No
Childhood stunting Lower respiratory infections 0 ·· ·· 7 ·· No ·· Yes No
Childhood stunting Measles 0 ·· ·· 7 ·· No ·· Yes No
Iron defi ciency Maternal haemorrhage 0 ·· ·· 0 ·· No ·· Yes Yes
Iron defi ciency Maternal sepsis and other pregnancy-related infections
0 ·· ·· 0 ·· No ·· Yes Yes
Outcome RCTs (n) RCTs with signifi cant eff ect in the opposite direction (%) RCTs with null fi ndings (%) Prospective observational studies (n)* Prospective observational studies with signifi cant association in the opposite direction (%) Lower limit of RR >1·5 Dose-response relationship Biological plausibility† Analogy‡
(Continued from previous page)
Vitamin A defi ciency Diarrhoeal diseases 19 0 63% 0 ·· No ·· Yes No
Vitamin A defi ciency Measles 12 0 83% 0 ·· Yes ·· Yes No
Zinc defi ciency Diarrhoeal diseases 14 0 29% 0 ·· No ·· Yes No
Zinc defi ciency Lower respiratory infections 6 0 17% 0 ·· No ·· Yes No
Tobacco smoke
Smoking Tuberculosis 0 ·· ·· 4 0 No ·· Yes Yes
Smoking Lower respiratory infections 0 ·· ·· 0 ·· No ·· Yes Yes
Smoking Lip and oral cavity cancer 0 ·· ·· 3 0 Yes ·· Yes Yes
Smoking Nasopharyngeal cancer 0 ·· ·· 3 0 Yes ·· Yes Yes
Smoking Oesophageal cancer 0 ·· ·· 5 0 Yes ·· Yes Yes
Smoking Larynx cancer 0 ·· ·· 4 0 Yes ·· Yes Yes
Smoking Stomach cancer 0 ·· ·· 9 0 No ·· Yes Yes
Smoking Colon and rectum cancer 0 ·· ·· 19 0 No ·· Yes Yes
Smoking Liver cancer 0 ·· ·· 54 0 Yes ·· Yes Yes
Smoking Pancreatic cancer 0 ·· ·· 13 0 Yes ·· Yes Yes
Smoking Tracheal, bronchial, and lung
cancer
0 ·· ·· 38 0 Yes ·· Yes Yes
Smoking Cervical cancer 0 ·· ·· 15 0 No ·· Yes Yes
Smoking Kidney cancer 0 ·· ·· 8 0 Yes ·· Yes Yes
Smoking Bladder cancer 0 ·· ·· 17 0 Yes ·· Yes Yes
Smoking Leukaemia 0 ·· ·· 14 0 No ·· Yes Yes
Smoking Ischaemic heart disease 0 ·· ·· 86 ·· No ·· Yes Yes
Smoking Ischemic stroke 0 ·· ·· 60 ·· No ·· Yes Yes
Smoking Haemorrhagic stroke 0 ·· ·· 60 ·· No ·· Yes Yes
Smoking Hypertensive heart disease 0 ·· ·· 5 ·· No ·· Yes Yes
Smoking Atrial fi brillation and fl utter 0 ·· ·· 16 0 No ·· Yes Yes
Smoking Aortic aneurysm 0 ·· ·· 10 0 No ·· Yes Yes
Smoking Peripheral vascular disease 0 ·· ·· 10 0 No ·· Yes Yes
Smoking Other cardiovascular and
circulatory diseases
0 ·· ·· 1 0 No ·· Yes Yes
Smoking Chronic obstructive
pulmonary disease
0 ·· ·· 42 0 Yes ·· Yes Yes
Smoking Silicosis 0 ·· ·· 0 ·· No ·· Yes Yes
Smoking Asbestosis 0 ·· ·· 0 ·· No ·· Yes Yes
Smoking Coal workers pneumoconiosis 0 ·· ·· 0 ·· Yes ·· Yes Yes
Smoking Other pneumoconiosis 0 ·· ·· 0 ·· Yes ·· Yes Yes
Smoking Asthma 0 ·· ·· 6 0 No ·· Yes Yes
Smoking Interstitial lung disease and
pulmonary sarcoidosis
0 ·· ·· 0 ·· Yes ·· Yes Yes
Smoking Other chronic respiratory
diseases
0 ·· ·· 1 0 Yes ·· Yes Yes
Smoking Peptic ulcer disease 0 ·· ·· 7 0 No ·· Yes No
Smoking Diabetes mellitus 0 ·· ·· 51 0 No ·· Yes No
Smoking Cataract 0 ·· ·· 10 0 No ·· Yes No
Smoking Macular degeneration 0 ·· ·· 5 20% No ·· Yes No
Smoking Rheumatoid arthritis 0 ·· ·· 5 0 No ·· Yes No
Smoking Hip fracture 0 ·· ·· 15 20% No ·· Yes Yes
Outcome RCTs (n) RCTs with signifi cant eff ect in the opposite direction (%) RCTs with null fi ndings (%) Prospective observational studies (n)* Prospective observational studies with signifi cant association in the opposite direction (%) Lower limit of RR >1·5 Dose-response relationship Biological plausibility† Analogy‡
(Continued from previous page)
Smoking Non-hip fracture 0 ·· ·· 14 14% No ·· Yes Yes
Second-hand smoke Otitis media 0 ·· ·· 17 0 No Yes Yes No
Second-hand smoke Tracheal, bronchial, and lung cancer
0 ·· ·· 4 0 No Yes Yes Yes
Second-hand smoke Ischaemic heart disease 0 ·· ·· 4 25% No Yes Yes Yes
Second-hand smoke Ischaemic stroke 0 ·· ·· 10 0 Yes Yes Yes Yes
Second-hand smoke Haemorrhagic stroke 0 ·· ·· 10 0 Yes Yes Yes Yes
Alcohol and drug use
Alcohol use Tuberculosis 0 ·· ·· 3 0 No Yes Yes Yes
Alcohol use Lower respiratory infections 0 ·· ·· 2 0 No Yes Yes Yes
Alcohol use Lip and oral cavity cancer 0 ·· ·· 1 0 No Yes Yes Yes
Alcohol use Nasopharyngeal cancer 0 ·· ·· 1 0 No Yes Yes Yes
Alcohol use Other pharyngeal cancer 0 ·· ·· 1 0 No Yes Yes Yes
Alcohol use Oesophageal cancer 0 ·· ·· 1 0 No Yes Yes Yes
Alcohol use Colon and rectum cancer 0 ·· ·· 6 0 No Yes Yes Yes
Alcohol use Liver cancer 0 ·· 3 0 No Yes Yes Yes
Alcohol use Laryngeal cancer 0 ·· ·· 0 ·· No Yes Yes Yes
Alcohol use Breast cancer 0 ·· ·· 12 0 No Yes Yes Yes
Alcohol use Ischaemic heart disease 0 ·· ·· 32 0 No Yes Yes Yes
Alcohol use Ischaemic stroke 0 ·· ·· 20 0 No Yes Yes Yes
Alcohol use Haemorrhagic stroke 0 ·· ·· 16 0 No Yes Yes Yes
Alcohol use Atrial fi brillation and fl utter 0 ·· ·· 10 0 No Yes Yes Yes
Alcohol use Hypertensive heart disease 0 ·· ·· 2 0 No Yes Yes Yes
Alcohol use Pancreatitis 0 ·· ·· 4 0 No Yes Yes No
Alcohol use Epilepsy 0 ·· ·· 0 ·· No Yes Yes No
Alcohol use Diabetes mellitus 0 ·· ·· 9 0 No Yes Yes No
Alcohol use Cirrhosis 0 ·· ·· 14 0 No Yes Yes Yes
Alcohol use Injuries 0 ·· ·· 29 0 No Yes Yes Yes
Alcohol use Self-harm 0 ·· ·· 0 ·· No Yes Yes Yes
Alcohol use Interpersonal violence 0 ·· ·· 11 0 No Yes Yes Yes
Drug use Hepatitis B 0 ·· ·· 6 0 Yes ·· Yes Yes
Drug use Hepatitis C 0 ·· ·· 16 0 Yes ·· Yes Yes
Drug use Self-harm 0 ·· ·· 1 0 No ·· Yes No
Dietary risks
Diet low in fruits Lip and oral cavity cancer 0 ·· ·· 2 0 No Yes Yes Yes
Diet low in fruits Nasopharyngeal cancer 0 ·· ·· 2 0 No Yes Yes Yes
Diet low in fruits Other pharyngeal cancer 0 ·· ·· 2 0 No Yes Yes Yes
Diet low in fruits Larynx cancer 0 ·· ·· 2 0 No Yes Yes Yes
Diet low in fruits Oesophageal cancer 0 ·· ·· 5 0 No Yes Yes Yes
Diet low in fruits Tracheal, bronchial, and lung cancer
0 ·· ·· 22 0 No Yes Yes Yes
Diet low in fruits Ischaemic heart disease 0 ·· ·· 9 0 No Yes Yes Yes
Diet low in fruits Ischaemic stroke 0 ·· ·· 9 0 No Yes Yes Yes
Diet low in fruits Haemorrhagic stroke 0 ·· ·· 5 0 No Yes Yes Yes
Diet low in fruits Diabetes mellitus 0 ·· ·· 9 0 No Yes Yes No
Diet low in vegetables Oesophageal cancer 0 ·· ·· 5 0 No Yes Yes No
Diet low in vegetables Ischaemic heart disease 0 ·· ·· 9 0 No Yes Yes Yes
Outcome RCTs (n) RCTs with signifi cant eff ect in the opposite direction (%) RCTs with null fi ndings (%) Prospective observational studies (n)* Prospective observational studies with signifi cant association in the opposite direction (%) Lower limit of RR >1·5 Dose-response relationship Biological plausibility† Analogy‡
(Continued from previous page)
Diet low in vegetables Ischaemic stroke 0 ·· ·· 8 0 No Yes Yes Yes
Diet low in vegetables Haemorrhagic stroke 0 ·· ·· 5 0 No Yes Yes Yes
Diet low in whole grains Ischaemic heart disease 0 ·· ·· 7 0 No Yes Yes Yes
Diet low in whole grains Ischaemic stroke 0 ·· ·· 6 0 No Yes Yes Yes
Diet low in whole grains Haemorrhagic stroke 0 ·· ·· 6 0 No Yes Yes Yes
Diet low in whole grains Diabetes mellitus 0 ·· ·· 10 0 No Yes Yes No
Diet low in nuts and seeds Ischaemic heart disease 1 0 100% 6 0 No Yes Yes No
Diet low in nuts and seeds Diabetes mellitus 1 0 100% 5 0 No Yes Yes No
Diet low in milk Colon and rectum cancer 0 ·· ·· 7 0 No Yes Yes No
Diet high in red meats Colon and rectum cancer 0 ·· ·· 8 0 No Yes Yes No
Diet high in red meats Diabetes mellitus 0 ·· ·· 9 11% No Yes Yes No
Diet high in processed meats Colon and rectum cancer 0 ·· ·· 9 11% No Yes Yes No
Diet high in processed meats Ischaemic heart disease 0 ·· ·· 5 0 No Yes Yes No
Diet high in processed meats Diabetes mellitus 0 ·· ·· 8 0 No Yes Yes No
Diet high in sugar-sweetened beverages Body-mass index 10 0 60% 22 0 ·· Yes Yes ··
Diet low in fi bre Colon and rectum cancer 0 ·· ·· 15 0 No Yes Yes No
Diet low in fi bre Ischaemic heart disease 0 ·· ·· 12 0 No Yes Yes No
Diet low in calcium Colon and rectum cancer 0 ·· ·· 13 0 No Yes Yes No
Diet low in seafood omega-3 fatty acids Ischaemic heart disease 17 0 88% 16 0 No Yes Yes No
Diet low in polyunsaturated fatty acids Ischaemic heart disease 8 0 75% 11 0 No Yes Yes No
Diet high in trans fatty acids Ischaemic heart disease 0 ·· ·· 4 0 No Yes Yes No
Diet high in sodium Systolic blood pressure 45 0 73% ·· ·· ·· Yes Yes ··
Diet high in sodium Stomach cancer 0 ·· ·· 3 0 No Yes Yes No
Sexual abuse and violence
Intimate partner violence HIV/AIDS 0 ·· ·· 2 0 No ·· Yes No
Intimate partner violence Maternal abortion, miscarriage, and ectopic pregnancy
0 ·· ·· 1 0 Yes ·· Yes No
Intimate partner violence Depressive disorders 0 ·· ·· 6 0 No ·· Yes Yes
Intimate partner violence Self-harm 0 ·· ·· 2 0 Yes ·· Yes Yes
Childhood sexual abuse Alcohol use disorders 0 ·· ·· 4 0 No ·· Yes Yes
Childhood sexual abuse Depressive disorders 0 ·· ·· 5 0 No ·· Yes Yes
Childhood sexual abuse Self-harm 0 ·· ·· 8 0 No ·· Yes Yes
Low physical activity
Low physical activity Colon and rectum cancer 0 ·· ·· 20 15% No Yes Yes Yes
Low physical activity Breast cancer 0 ·· ·· 35 0 No Yes Yes Yes
Low physical activity Ischaemic heart disease 0 ·· ·· 45 9% No Yes Yes Yes
Low physical activity Ischaemic stroke 0 ·· ·· 27 11% No Yes Yes Yes
Low physical activity Diabetes mellitus 0 ·· ·· 57 7% No Yes Yes No
Metabolic risks
High fasting plasma glucose Ischaemic heart disease 8 0 100% 150 ·· Yes Yes Yes Yes
High fasting plasma glucose Ischaemic stroke 9 0 100% 150 ·· Yes Yes Yes Yes
High fasting plasma glucose Haemorrhagic stroke 9 0 100% 150 ·· Yes Yes Yes Yes
High fasting plasma glucose Peripheral vascular disease 14 ·· ·· 4 0 Yes Yes Yes Yes
High fasting plasma glucose Tuberculosis 0 ·· ·· 17 0 Yes Yes Yes No
High fasting plasma glucose Chronic kidney disease 5 ·· ·· 32 ·· Yes Yes Yes No
High total cholesterol Ischaemic heart disease 21 0 57% 88 ·· Yes Yes Yes Yes
Outcome RCTs (n) RCTs with signifi cant eff ect in the opposite direction (%) RCTs with null fi ndings (%) Prospective observational studies (n)* Prospective observational studies with signifi cant association in the opposite direction (%) Lower limit of RR >1·5 Dose-response relationship Biological plausibility† Analogy‡
(Continued from previous page)
High total cholesterol Ischaemic stroke 21 0 57% 88 ·· Yes Yes Yes Yes
High systolic blood pressure Rheumatic heart disease 0 ·· ·· 62 ·· Yes Yes Yes Yes
High systolic blood pressure Ischaemic heart disease 56 0 ·· 88 ·· Yes Yes Yes Yes
High systolic blood pressure Ischaemic stroke 54 0 ·· 150 ·· Yes Yes Yes Yes
High systolic blood pressure Haemorrhagic stroke 54 0 ·· 150 ·· Yes Yes Yes Yes
High systolic blood pressure Cardiomyopathy and myocarditis
0 ·· ·· 62 ·· Yes Yes Yes Yes
High systolic blood pressure Atrial fi brillation and fl utter 20 5% 60% 88 ·· Yes Yes Yes Yes
High systolic blood pressure Aortic aneurysm 0 ·· ·· 62 ·· Yes Yes Yes Yes
High systolic blood pressure Peripheral vascular disease 0 ·· ·· 88 ·· Yes Yes Yes Yes
High systolic blood pressure Endocarditis 0 ·· ·· 62 ·· Yes Yes Yes Yes
High systolic blood pressure Other cardiovascular and circulatory diseases
0 ·· ·· 88 ·· No Yes Yes Yes
High systolic blood pressure Chronic kidney disease 8 ·· ·· 88 ·· Yes Yes Yes No
High body-mass index Oesophageal cancer 0 ·· ·· 8 0 No Yes Yes Yes
High body-mass index Colon and rectum cancer 0 ·· ·· 38 0 No Yes Yes Yes
High body-mass index Liver cancer 0 ·· ·· 34 0 No Yes Yes Yes
High body-mass index Gallbladder and biliary tract cancer
0 ·· ·· 10 0 No Yes Yes Yes
High body-mass index Pancreatic cancer 0 ·· ·· 20 0 No Yes Yes Yes
High body-mass index Breast cancer (after menopause)
0 ·· ·· 44 2% No Yes Yes Yes
High body-mass index Breast cancer (before menopause)
0 ·· ·· 25 8% No Yes Yes No
High body-mass index Uterine cancer 0 ·· ·· 37 0 No Yes Yes Yes
High body-mass index Ovarian cancer 0 ·· ·· 31 3% No Yes Yes Yes
High body-mass index Kidney cancer 0 ·· ·· 28 0 No Yes Yes Yes
High body-mass index Thyroid cancer 0 ·· ·· 16 0 No Yes Yes Yes
High body-mass index Leukaemia 0 ·· ·· 17 0 No Yes Yes Yes
High body-mass index Ischaemic heart disease 0 ·· ·· 129 ·· No Yes Yes Yes
High body-mass index Ischaemic stroke 0 ·· ·· 102 ·· No Yes Yes Yes
High body-mass index Haemorrhagic stroke 0 ·· ·· 129 ·· No Yes Yes Yes
High body-mass index Hypertensive heart disease 0 ·· ·· 85 ·· No Yes Yes Yes
High body-mass index Diabetes mellitus 0 ·· ·· 85 ·· Yes Yes Yes No
High body-mass index Chronic kidney disease 0 ·· ·· 57 ·· No Yes Yes No
High body-mass index Osteoarthritis 0 ·· ·· 32 0 No Yes Yes Yes
High body-mass index Low back pain 0 ·· ·· 5 0 No Yes Yes Yes
Low bone mineral density Injuries 0 ·· ·· 12 ·· No Yes Yes Yes
Low glomerular fi ltration rate Ischaemic heart disease 0 ·· ·· 10 0 Yes ·· Yes Yes
Low glomerular fi ltration rate Ischaemic stroke 0 ·· ·· 12 0 Yes ·· Yes Yes
Low glomerular fi ltration rate Haemorrhagic stroke 0 ·· ·· 12 0 Yes ·· Yes Yes
Low glomerular fi ltration rate Peripheral vascular disease 0 ·· ·· 1 0 Yes ·· Yes Yes
Low glomerular fi ltration rate Gout 0 ·· ·· 3 0 Yes ·· Yes No
If multiple reports existed from one study, we counted them as one study. We only assessed the dose-response relationship for continuous risks. To evaluate the magnitude of the eff ect size for continuous risks, we evaluated the RR comparing the 75th percentile with the 25th percentile of the exposure distribution at the global level. Additional information for this table is found in the methods appendix (pp 245–63). RCT=randomised controlled trial. RR=relative risk. *Prospective cohort studies or non-randomised interventions. †Whether or not any biological or mechanistic pathway exists that could potentially explain the relationship of the risk-outcome pair. ‡Whether or not the risk is associated with another outcome from the same category and whether or not any evidence exists that it can cause the current outcome through the same pathway.