Effects of water saturation on a resistivity survey of an unconfined fluvial aquifer in Columbus, MS
10
0
0
Full text
(2) Koster and Harry. observations. The problem is that outcrops are drained, whereas the aquifers are, by definition, saturated. Water content affects a variety of geophysical attributes, including electrical resistivity and seismic and radar velocity and reflectivity (Heigold et al., 1979; Kelly and Frohlich, 1985; Mazac et al., 1988; Ahmed et al., 1988; Smith and Jol, 1995; Doser et al., 2004), so there is a need to understand the effects that water saturation has on geophysical attributes. This paper presents a study of an outcrop in a heterogeneous, unconfined, and unconsolidated fluvial aquifer system exposed at the Bacco Materials Inc. sand and gravel quarry in Columbus, Mississippi (Figure 1). The quarry site is approximately a half mile south of the MacroDispersion Experiment (MADE) site on Columbus Air Force Base, which has been the target of substantial hydrological, geological, and geophysical research (Boggs et al., 1992; MacIntyre et al., 1993, Feehley et al., 2000; Julian et al., 2001). Study of the Bacco Quarry outcrop has been used as an analog for interpretation of geophysical data at the MADE site (Bowling, 2005).. Tombigbee River. Buttahatchee River I-45. Columbus Air Force Base. MADE Site Outcrop Bacco Quarry. N. 1 km Figure 1: The study area is located adjacent to Columbus Air Force Base in Columbus, MS, and less than 1 km south of the MacroDispersion Experiment (MADE) site.. This paper focuses on comparisons between two electrical resistivity surveys of the outcrop. The first survey was conducted in 2002 when the aquifer was drained due to pumping while quarry was being excavated. The second survey was conducted in 2004 after quarrying operations had ended and the aquifer was saturated. 2. Survey Description The quarry pit is approximately 10 m deep and exposes the entire aquifer stratigraphy (Figure 2). The aquifer is composed of an upper fluvial flood plain facies composed of clayey-silt with meter scale clay and silty-clay 112.
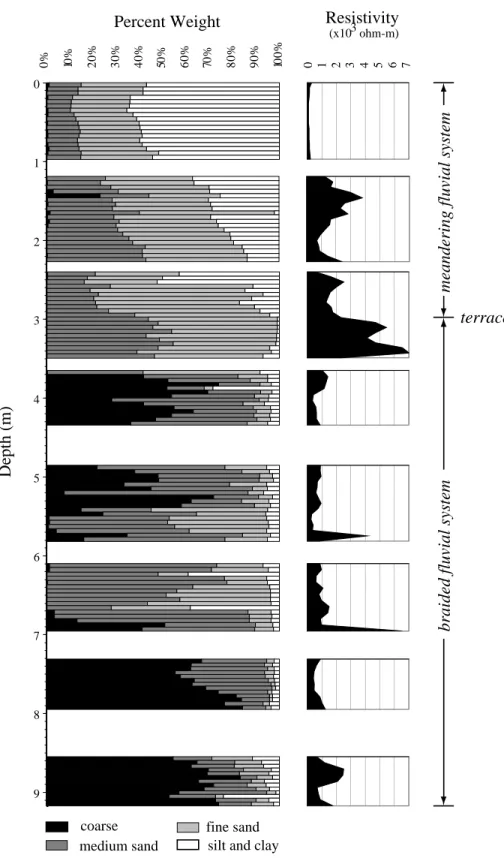
(3) Effects of Water Saturation on a Resistivity Survey of an Unconfined Fluvial Aquifer. filled channels and a lower braided stream facies composed predominantly of sand and gravelly-sand. There is a terrace surface at approximately 4 m depth that separates these facies. The terrace was identified by outcrop observation (Bowling, 2005). The bottom of the quarry exposes a clay-rich layer (identified as the Eutaw Formation by Boggs et al., 1992) that forms the aquitard beneath the aquifer. North. Core location. Road berm. South. Depth (m). 0 2. Soil. Meandering Fluvial System Terrace. 4 Channel. Braided Fluvial System. 6 8 60. 50. 40. 30. 20. 10. 0. Distance (m). Figure 2: A photo-mosaic of the eastern quarry pit wall taken during the first survey. The pit is approximately 10 m deep and the wall extends for approximately 100 m along a north-south trend. The survey lines were collected 15 m east of the pit and a core was collected 25 from the south end of the profile. After Bowling (1995).. A 9.8 m deep sediment core, 3.81 cm in diameter, was collected approximately 15 m east of the quarry wall, along the trend of the geophysical survey line described in this paper (Bowling, 2005). The core was encased in a plastic liner when collected and the ends were capped in the field to preserve the in situ conditions of the aquifer. In the laboratory the core resistivity was measured using a 4-point needle probe system with 5 cm between the potential and current electrodes (Bowling, 2005). The core sediment was then sieved at 5 cm intervals to determine the grain size distribution in the aquifer (Figure 3). The electrical resistivity surveys were collected along a 94 m long profile beside a dirt roadside parallel to and 15 m east of the quarry pit wall. Both survey lines cross the location of the core described in Figure 3. The first survey, collected in 2002, was taken when the aquifer was pumped and completely dry. The second survey, collected in 2004, was taken when the water level in the quarry pit was less than 5 m below the ground surface. At the time of the second survey there was standing water in ditches, puddles, and other low lying topographic areas and there had been no precipitation for. 113.
(4) Koster and Harry. Resistivity 3 0 1 2 3 4 5 6 7. 100%. 90%. (x10 ohm-m). 80%. 70%. 60%. 50%. 40%. 30%. 20%. 10%. 0%. Percent Weight. meandering fluvial system. 0. 1. 2. terrace. 3. 5. braided fluvial system. Depth (m). 4. 6. 7. 8. 9. coarse medium sand. fine sand silt and clay. Figure 3: Grain size analysis (left) and resistivity measurements from a 3.81 cm diameter sediment core, 9.25 m long collected at the quarry. Grain size and resistivity were measured in 1.2 m intervals. The location of this core was 25 m from the south end of the surface resistivity survey line. Grain sizes are: silt + clay (< 0.0625 mm), fine sand (0.0625-0.25 mm), medium-coarse sand (0.25-2 mm), and gravel (>2 mm). After Bowling (1995).. 114.
(5) Effects of Water Saturation on a Resistivity Survey of an Unconfined Fluvial Aquifer. approximately three weeks, so the standing surface water is believed to be the water table surface. The survey area is flat, so no topographic corrections to the data are required. The surveys used a Syscal Pro resistivity imaging system with 48 electrodes spaced at 2 m intervals, deployed in a Wenner-Schlumberger array. A pine tree located near the south end of the survey line provided a fiducial point so that the two survey lines could be co-located. The difference in electrode placement between the two surveys is estimated to be less than 1 m, which is half of the electrode spacing. The Res2DINV software by Geotomo Software (deGroot-Hedlin and Constable, 1990; Loke and Dahlin, 2002; www.geoelectrical.com) was used to invert the data to obtain subsurface resistivity images. No obvious outliers were identified in the data, so no data filtering was conducted prior to inversion. The inversion process calculates the subsurface resistivity values on a 2-D cross section grid that are required to model the voltages measured at the surface electrodes. The model grid extends horizontally the length of the resistivity profile with grid spacing of 1 m, and vertically to 10.5 m depth in eight layers with layer thicknesses ranging from 1 m near the surface to 1.75 m at the bottom. The inversion was terminated when the RMS difference between the measured and modeled voltages was less than 3%. Experimentation with different grid sizes, convergence criteria, and regularization parameters showed that these inversion parameters were optimal for this survey. The 2D resistivity cross sections obtained from the inverse modeling were subtracted from one another to create a resistivity difference cross section. In order to verify co-location of the surveys, the gridded images were shifted horizontally by 0 m, 2 m north, and 2 m south with respect to each other before differencing. The shifted cross sections showed only slight differences, indicating that misalignment of the survey lines did not bias the results. 3. Results The channels in the meandering stream facies and the boundary between the meandering and braided stream facies are imaged in the surveys of the aquifer in both the drained and saturated state (Figures 4 and 5). The clay and silty-clay filled channels in the flood plain facies have similar resistivity values, less than 200 ohm-m, in both surveys. This is attributed to the low permeability of the channel-fill, which minimizes ground water penetration between surveys. In the flood plain facies, outside of the channels, resistivity in the saturated aquifer ranges from 0 to 600 ohm-m less than that measured in the drained aquifer (Figure 6). This drop in resistivity is attributed to two factors. First, the groundwater acts as an electrolytic conductor, producing an ionic current that reduces the bulk resistivity in the saturated soil (Telford et al., 1990). Second, the dispersed clays in the splay deposits which compose the upper flood plain facies are more conductive when damp, providing a solidphase pathway for current flow.. 115.
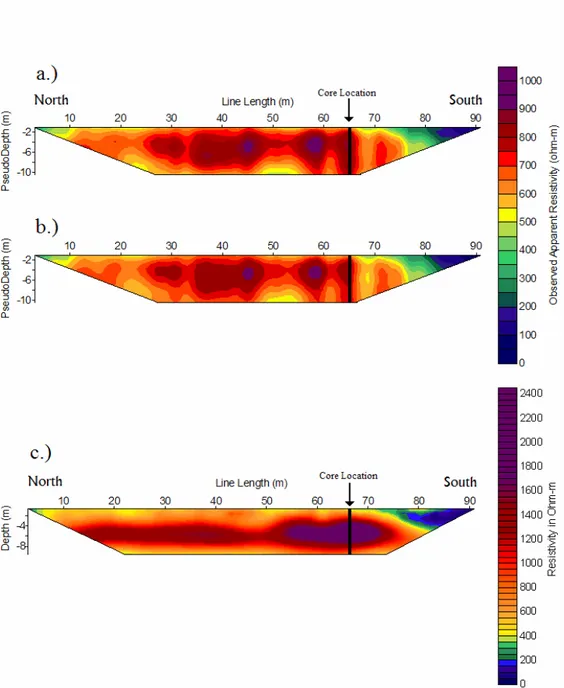
(6) Koster and Harry. Figure 4: Results of 2002 resistivity survey, when the aquifer was drained by pumping in the adjacent quarry pit. a) Observed pseudosection. b) Modeled pseudosection. c) Subsurface resistivity profile obtained from inverse model. Pseudosections plot apparent resistivity (measured voltage divided by input current, corrected for electrode geometry) as a function of pseudodepth (distance between current and voltage electrode pairs). This allows a direct comparison of measured and modeled data. The subsurface resistivity profile represents the true subsurface resistivity structure that best fits the measured voltages. Note the location of the core described in Figure 3.. 116.
(7) Effects of Water Saturation on a Resistivity Survey of an Unconfined Fluvial Aquifer. Figure 5: Results of 2004 resistivity survey, when the aquifer was saturated. a) Observed pseudosection. b) Calculated pseudosection. c) Resistivity inversion model of the second survey line collected in 2004. See caption to Figure 3 for explanation of pseudosections. Note the location of the core described in Figure 3.. 117.
(8) Koster and Harry. The resistivity in the braided stream facies is 0-1100 ohm-m higher when saturated than when drained (Figure 6). The reason for such a large magnitude decrease is enigmatic. The presence of meteoric water in the pore space should either have no effect on resistivity if the water is not ionized, or if ionized, the water should provide an electrolytic conductivity pathway that results in a decrease in resistivity. One possible explanation for the increase in resistivity is that the small discontinuous clay bodies in the braided stream facies develop surface charges and act as capacitors in the electrical circuit (e.g., develop a Nernst potential; Telford et al., 1990). The clay bodies, when drained, would have only a minor affect on the resistivity of the facies because they make up only a small fraction of the facies. When saturated, they become negatively charged on the surface, inhibiting ion flow in the pore space.. Figure 6: Difference in resistivity obtained by subtracting the unsaturated model (Figure 5c) from the saturated model (Figure 4c).. 4. Summary The affects of groundwater saturation on electrical resistivity in the unconfined fluvial aquifer studied here are strongly dependant on the sedimentary facies. Resistivity generally decreases with water saturation in the meandering fluvial facies, which is dominated by silt and clayey-silt flood plain deposits. This is attributed to ionic currents in the pore fluid. Clay and silty-clay filled channels within this facies show very little change in resistivity with changing bulk-saturation of the aquifer. This is attributed to a lack of groundwater penetration into these relatively impermeable deposits. In the braided fluvial facies, resistivity generally decreases with increasing water saturation. The cause of this is uncertain, but may be related to the development of surface charges on saturated clays, which act as capacitors and impede subsurface current flow. The saturation dependence of resistivity complicates the use of outcrop-based resistivity measurements as a quantitative tool to estimate clay 118.
(9) Effects of Water Saturation on a Resistivity Survey of an Unconfined Fluvial Aquifer. content in similar buried (saturated) aquifers in clay-poor soils. However, outcrop studies do provide a robust qualitative tool for identifying major stratigraphic features on the basis of their resistivity character. In particular, the channel boundaries and lithologic contacts between the major sedimentary facies (meandering vs. braided stream deposits) are well constrained in both the drained and saturated surveys, and the characteristic differences between the two facies identified in the drained outcrop study can be applied to the saturated aquifer. The braided fluvial facies has a relatively high resistivity in comparison to the meandering fluvial facies in both the saturated and drained aquifer, and the clay and silty-clay filled channels are easily recognized by their extremely low resistivity in both survey lines. These observations indicate that studies of electrical resistivity surveys of drained outcrops provide a good basis for mapping facies in similar buried saturated aquifers, at least those involving the types of fluvial facies studied here. However, quantitative predictions of clay or clay + silt content (often of interest due to it’s correlation with hydraulic conductivity) on the basis of resistivity values is less reliable. 5. References Ahmed, S., G.D. Marsily, and A. Talbot: 1988. Combined use of hydraulic and electrical properties of an aquifer in a geostatistical estimation of transmissivity. Ground Water, 26, 78-86. Boggs, J.M., S.C. Young, L.M. Beard, L.W. Gelhar, K.R. Rehfield, and E.E. Adams: 1992. Field study of dispersion in a heterogeneous aquifer 1. Overview and site description. Water Resources Research, 28, 3281-3291. Bowling, J.C.: 2005. Integrated Geophysical and Geological Investigation of a Heterogeneous Fluvial Aquifer in Columbus, Mississippi, Ph.D. Dissertation, The University of Alabama, Tuscaloosa, Alabama, 116 pp. deGroot-Hedlin, C., and S. Constable: 1990. Occam's inversion to generate smooth, two-dimensional models from magnetotelluric data. Geophysics, 55, 16131624. Doser, D.I., O.S. Dena-Ornelas, R.P. Langford, and M.R. Baker: 2004. Monitoring yearly changes and their influence on electrical properties of the shallow subsurface at two sites near the Rio Grande, West Texas. Journal of Environmental and Engineering Geophysics, 9, 179-190. Feehley, C.E., C. Zheng, and F.J. Molz: 2000. A dual-domain mass transfer approach for modeling solute transport in heterogeneous porous media, application to the MADE site. Water Resources Research, 36, 2501-2515. Heigold, P.C., R.H. Gilkeson, K. Cartwright, and P.C. Reed: 1979. Aquifer transmissivity from surficial electrical methods. Ground Water, 17, 338-345. Hubbard, S.S., and Y. Rubin: 2000. Hydrogeological parameter estimation using geophysical data: A review of selected techniques. Journal of Contaminant Hydrology, 45, 3-34. Julian, H.E., J.M. Boggs, C. Zheng, and C.E. Feehley: 2001. Numerical simulation of a natural gradient tracer experiment for the Natural Attenuation Study: flow and physical transport. Ground Water, 39, 534-545. Kelly, W.E., and R.K. Frohlich: 1985. Relations between aquifer electrical and hydraulic properties. Ground Water, 23, 182-189.. 119.
(10) Koster and Harry. Loke, M. H., and T. Dahlin: 2002. A comparison of the Gauss-Newton and quasiNewton methods in resistivity imaging inversion. Journal of Applied Geophysics, 49, 149-162. MacIntyre, W.G., J.M. Boggs, C.P. Antworth, and T.B. Stauffer: 1993. Degradation kinetics of aromatic organic solutes introduced into a heterogeneous aquifer. Water Resources Research, 29, 4045-4052. Mazac, O., M. Cislerova, T. Vogel: 1988. Application of geophysical methods in describing spatial variability of saturated hydraulic conductivity in the zone of aeration. Journal of Hydrology, 103, 117-126. Smith, D.G., and H.M. Jol: 1995. Ground penetrating radar: antenna frequencies and maximum probable depths of penetration in Quaternary sediments. Journal of Applied Geophysics, 33, 93-100. Telford, W.M., L.P. Geldart, and R.E. Sheriff, Applied Geophysics, 2nd edition, Cambridge University Press, 770 pp. Wolfe, P.J., and B.H. Richard: 1996. Integrated geophysical studies of buried valley aquifers. Journal of Environmental & Engineering Geophysics, 1, 75-84.. 120.
(11)
Figure


+3


Related documents
Parallellmarknader innebär dock inte en drivkraft för en grön omställning Ökad andel direktförsäljning räddar många lokala producenter och kan tyckas utgöra en drivkraft
Närmare 90 procent av de statliga medlen (intäkter och utgifter) för näringslivets klimatomställning går till generella styrmedel, det vill säga styrmedel som påverkar
• Utbildningsnivåerna i Sveriges FA-regioner varierar kraftigt. I Stockholm har 46 procent av de sysselsatta eftergymnasial utbildning, medan samma andel i Dorotea endast
I dag uppgår denna del av befolkningen till knappt 4 200 personer och år 2030 beräknas det finnas drygt 4 800 personer i Gällivare kommun som är 65 år eller äldre i
Den förbättrade tillgängligheten berör framför allt boende i områden med en mycket hög eller hög tillgänglighet till tätorter, men även antalet personer med längre än
Det har inte varit möjligt att skapa en tydlig överblick över hur FoI-verksamheten på Energimyndigheten bidrar till målet, det vill säga hur målen påverkar resursprioriteringar
Detta projekt utvecklar policymixen för strategin Smart industri (Näringsdepartementet, 2016a). En av anledningarna till en stark avgränsning är att analysen bygger på djupa
The government formally announced on April 28 that it will seek a 15 percent across-the- board reduction in summer power consumption, a step back from its initial plan to seek a
