REPORT 6775 • AUGUST 2017
pile driving
MATHIAS H ANDERSSON, SANDRA ANDERSSON, JIMMY AHLSÉN, BRODD LEIF ANDERSSON, JONATAN HAMMAR, LEIF KG PERSSON, JÖRGEN PIHL, PETER SIGRAY, ANDREAS WIKSTRÖM
During the construction of bridges, offshore wind farms and other offshore or near-shore structures, some form of pile driving method is often used to drive the structure into the bottom. This may cause noise levels that are so high that marine organisms can be disturbed, harmed or even killed.
This study has produced a scientific basis for assessing underwater pile driving noise and its effects on marine life. The report includes technical descriptions of pile driving activities, underwater acoustics, sound propagation, and the impact on harbour porpoises, the fish species cod and herring, fish eggs and fish larvae.
Today, Sweden lacks established thresholds for when underwater noise poses a threat to marine animals. The authors propose harmful levels for injury and negative effects, which can then be used to establish guidance values for regulating underwater noise that are adapted for Swedish waters and species. Several European countries have some form of thresholds indicating when serious environmental impacts can occur, as well as standards for measuring and reporting underwater noise.
ISSN 0282-7298
A framework for regulating
underwater noise during
pile driving
MATHIAS H ANDERSSON, SANDRA ANDERSSON, JIMMY AHLSÉN, BRODD LEIF ANDERSSON, JONATAN HAMMAR, LEIF KG PERSSON, JÖRGEN PIHL, PETER SIGRAY, ANDREAS WIKSTRÖM
Swedish EPA SE-106 48 Stockholm. Visiting address: Stockholm – Valhallavägen 195, Östersund – Forskarens väg 5 hus Ub. Tel: +46 10-698 10 00, fax: +46 10-698 16 00, e-mail: registrator@naturvardsverket.se Internet: www.naturvardsverket.se Orders Ordertel: +46 8-505 933 40,
The authors assume sole responsibility for the con-tents of this report, which
therefore cannot be cited as representing the views of the Swedish EPA.
The Vindval research programme collects, creates and communicates information and facts about the environmental impact of wind power on the environment, the social landscape and people’s perception of wind power installations. Vindval provides funding for research, including literature reviews and syntheses regarding the effects and experiences of wind power.
SWEDISH ENVIRONMENTAL PROTECTION AGENCY
Mathias H Andersson, Brodd Leif Andersson, Jörgen Pihl, Leif KG Persson, Peter Sigray
Swedish Defence Research Agency (FOI).
Sandra Andersson, Andreas Wikström, Jimmy Ahlsén, Jonatan Hammar Marine Monitoring at Kristineberg AB.
Please cite the report as follow:
Andersson, M.H., Andersson, S., Ahlsén, J., Andersson, B.L., Hammar, J., Persson, L.K.G., Pihl, J., Sigray, P., Wikström, A. 2016.
A framework for regulating underwater noise during pile driving. A technical Vindval report, ISBN 978-91-620-6775-5, Swedish
Internet: www.naturvardsverket.se/publikationer The Swedish Environmental Protection Agency Phone: + 46 (0)10-698 10 00, Fax: + 46 (0)10-698 16 00
E-mail: registrator@naturvardsverket.se
Address: Naturvårdsverket, SE-106 48 Stockholm, Sweden Internet: www.naturvardsverket.se
ISBN 978-91-620-6775-5 ISSN 0282-7298 © Naturvårdsverket 2017 Print: Arkitektkopia AB, Bromma 2017
Preface
The Vindval research programme is a collaboration between the Swedish Energy Agency and the Swedish Environmental Protection Agency that aims to develop and communicate science-based facts about the impacts of wind power on humans, nature and the environment.
The programme’s first two phases in 2005–2014 produced nearly 30 research papers and four so-called synthesis reports. In the synthesis reports, experts compile and assess overall research results and experiences regarding the effects of wind power, both nationally and internationally, in four areas: human interests, birds and bats, marine life and land mammals. The results have provided the basis for environmental impact assessments and for the planning and permit processes associated with wind power installations.
Vindval’s third phase, launched in 2014 and ending in 2018, also includes conveying the experience and new knowledge from the wind farms currently in operation. Results from the programme will also be useful in supervisory and monitoring programmes, as well as guidance for government agencies.
As before, Vindval sets high standards for the scientific review of research applications and research results, as well as for decisions on approving the reports and publishing the results.
This report has been written by Mathias H. Andersson,
Brodd Leif Andersson, Jörgen Pihl, Leif KG Persson and Peter Sigray from the Swedish Defence Research Agency (FOI), as well as Sandra Andersson, Andreas Wikström, Jimmy Ahlsén and Jonatan Hammar from Marine Monitoring at Kristineberg AB. The authors are responsible for the content, conclusions and recommendations. This report has been translated from the Swedish original (report no 6723, 2016) by Lisa Del Papa, Språkkonsulterna. Vindval, August 2017
Contents
PREFACE 3 SUMMARY – SWEDISH 7 SUMMARY 9 GLOSSARY 11 1 BACKGROUND 13 1.1 Underwater sound 141.2 Purpose of the study and reader’s guide 15
2 RECOMMENDATIONS ON HARMFUL NOISE LEVELS FOR
PILE DRIVING 17
2.1 Definition of threshold 17
2.2 Recommended noise levels 17
2.2.1 Fish 18
2.2.2 Fish eggs and larvae 20
2.2.3 Harbour porpoises 20
2.3 Methods for reducing the environmental impact of pile driving noise 21
2.4 Towards regulation of underwater noise 22
2.5 Sound propagation from pile driving in Swedish waters 23
2.5.1 Kattegat 25
2.5.2 Hanöbukten 26
2.5.3 The Southern Baltic 27
2.5.4 The Bothnian Sea 28
3 PILE DRIVING AS A SOUND SOURCE 29
3.1 Installation techniques 29
3.1.1 Impact pile driving 30
3.1.2 Vibratory pile driving 30
3.1.3 Drilling 31
3.1.4 High frequency, low energy pile driving 31
3.2 Pile driving as a sound source 32
3.2.1 Sources 32
3.2.2 Factors that affect noise radiation 36
3.2.3 Metrics and units 36
3.2.4 Measured sound levels 40
3.3 Frequency weighting 42
3.4 Standards for acoustical measurements 43
4 SOUND PROPAGATION AND MODELS 46
4.1 Sound propagation in Swedish waters 46
4.3 Modelling of pile driving noise 49
4.3.1 Sources 50
4.3.2 Environmental models in the two sample areas 51
4.3.3 Results of the sound propagation simulations 51
5 NOISE MITIGATION METHODS 57
5.1 Bubble curtains 57
5.2 Isolation casings 59
5.3 Cofferdams 60
5.4 Hydro Sound Dampers and encapsulated bubbles 60
5.5 Impact of noise mitigation systems on noise level at longer distances 61
6 THE EFFECTS OF PILE DRIVING NOISE ON HARBOUR
PORPOISES, COD AND HERRING 64
6.1 Introduction 64
6.1.1 Hearing of harbour porpoises and fish 66
6.1.2 Injury from pile driving noise at the individual level 67
6.1.3 Behavioural reaction in response to pile driving noise 67
6.1.4 Impact on population levels from pile driving noise 68
6.2 Studies on fish (cod and herring) 69
6.2.1 Hearing of cod and herring 70
6.2.2 Summary of results 71
6.2.3 Findings from literature review on cod and herring 74
6.2.4 International guidelines and studies of other fish species 77
6.3 Fish eggs and larvae 80
6.3.1 Airgun effects 82
6.3.2 Explosion effects 83
6.3.3 Effects of pile driving noise 83
6.4 Harbour porpoises 84
6.4.1 Hearing of harbour porpoises 84
6.4.2 Threshold shift (TS) 87
6.4.3 Behavourial response 89
6.4.4 Masking of echolocation ability 91
7 INTERNATIONAL GUIDELINES 92
7.1 Summary 92
7.2 Guidelines 92
7.2.1 Great Britain 93
7.2.2 Overall picture from other countries 94
7.2.3 Ireland 95 7.3 Threshold values 95 7.3.1 Denmark 95 7.3.2 Germany 97 7.3.3 United States 97 7.3.4 Netherlands 98 8 REFERENCES 100
Summary – Swedish
Vid byggnation av broar, havsbaserad vindkraft och andra havsbaserade eller strandnära konstruktioner används det oftast någon form av pålningsteknik för att få ner konstruktionen i botten. Detta innebär att ett fundament, balk eller spont hamras eller vibreras ner i botten, vilket kan generera mycket höga ljudnivåer som sprids ut i vattnet och ner i botten. Ljudnivåerna är så höga att marina organismer kan störas, skadas eller till och med dödas.
Idag saknar Sverige fastställda ljudnivåer för när undervattensbuller blir så högt att de kan skada djur i havet. Det saknas därför också vedertagna begränsningsvärden som anger vilka nivåer av undervattensbuller som kan tillåtas för bullrande aktiviteter utan att riskera allvarliga miljöeffekter. Flera länder i Europa har någon form av gränsvärden för när bullernivån under vattnet kan ge upphov till allvarlig miljöpåverkan liksom standarder för hur undervattensbuller skall mätas och rapporteras. Syftet med denna studie var att ta fram ett vetenskapligt underlag rörande ljudet från pålning i havet och dess påverkan på det marina livet. Slutmålet var att utifrån den vetenskapliga information som finns idag ge förslag på ljudnivåer för skador och negativ påverkan som sedan kan användas för att ta fram begränsnings värden för reglering av undervattensbuller anpassade för svenska vatten och arter. Studien ger ett antal exempel på vilka faktorer som påverkar ljud utbredningen i svenska vatten och hur detta påverkar ett pålningsslags ljudnivå som funktion av avstånd i fyra typområden kring den svenska kusten. Vidare presenteras ingående både tekniska beskrivningar av pålningsaktiviteter, undervattensakustik samt påverkan på marina djur. Denna påverkan (skada och flyktbeteende men ej subtila effekter) demonstreras med hjälp av ett antal typarter som tandvalen tumlare (Phocoena phocoena) och fiskarterna torsk (Gadus morhua) och sill (Clupea clupea) samt fiskägg och fisklarver. I denna studie har författarna gått tillbaka till de originalkällor av information som andra länders gränsvärden grundas på, så att rekommendationerna bygger på vetenskapliga nivåer och inte värden som har avrundats eller på annat sätt ändrats.
Studien presenterar ljudnivåer i tre olika enheter då dessa har olika bio-logisk relevans för påverkan från en pålningsaktivitet. Inga av dessa värden har frekvensviktats för att anpassas för en specifik art då denna metod ännu inte är helt vedertagen. Den första enheten är ljudtrycksnivå SPL(topp), d.v.s. det maximala över- eller undertryck som den av pålningsslaget genererade ljudpulsen har. Denna enhet har hög relevans för beteendepåverkan. För ljud-exponeringsnivå SEL, beräknas ljudnivån över en viss tid och tar då med energin i hela ljudpulsen. SEL är den enhet som visats vara bäst relaterad till hörselskador. SEL(enkel) är värdet för en enkel puls och för det kumulativa SEL(kum) har antalet pulser under en viss tid summerats.
Litteraturstudien på torsk och sill visar att det i dagsläget inte finns några studier som kan användas för att fastställa en artspecifik ljudnivå för skada men litteraturen visar tydligt på att höga bullernivåer kan påverka torsk och
sill negativt. Istället baseras de föreslagna nivåerna i huvudsak på studier på andra arter som har exponerats för pålningsljud i laboratoriemiljö med stöd av studier från mer storskaliga experiment i tankar och hav. De nivåer då fisk riskerar att dödas eller få allvarliga skador på inre organ är SPL(topp) 207 dB re 1 µPa, SEL(enkel) 174 dB re 1 µPa2s och SEL
(kum) 204 dB re 1 µPa2s. Notera att
för skada på fisk har det kumulativa värdet högre relevans än enkelvärdet för SEL eftersom studier visar att skador uppkommer efter en viss tids exponering. Nivåerna för påverkan på fiskägg och larver grundas i att inga negativa effekter har observerats vid exponering för ljudtryck från pålning upp till SPL(topp) 217 dB re 1 µPa, SEL(enkel) 187 dB re 1 µPa2s och SEL
(kum) 207 dB re 1 µPa2s.
Det finns emellertid mycket få studier relaterat till pålningsljud för dessa livsstadier.
För tumlare finns det fler artspecifika studier gjorda relaterat till buller än för torsk och sill. Det är dock endast ett fåtal som kan användas för att bestämma ljudnivåer som leder till skada eller negativ beteendepåverkan. De ljudnivåer som riskerar ge tillfällig hörselnedsättning (TTS) hos tumlare är SPL(topp) 194 dB re 1 µPa, SEL(enkel) 164 dB re 1 µPa2s och SEL
(kum) 175 dB re
1 µPa2s. Det är framförallt den kumulativa ljudexponeringsnivån SEL
(kum) som
har stor betydelse för just TTS, dock hänger detta värde ihop med en specifik tid och antalet pulser vilket kan vara svårt att uppskatta i förväg. Vidare avseende permanent hörselskada (PTS) är ljudnivån SPL(topp) 200 dB re 1 µPa, SEL(enkel) 179 dB re 1 µPa2s och SEL
(kum)190 dB re 1 µPa2s. Föreslagna nivåer
Summary
Pile driving is a common technique used during the construction of bridges, offshore wind power, and underwater infrastructure or shoreline structures. It is the process by which a foundation, beam or pole is hammered or vibrated down into the bottom, which can generate extremely loud noise that propa-gates throughout the surrounding water and sediment. The noise can reach such high levels that marine animals are at risk of disturbance, injury or even death.
Sweden currently lacks established thresholds stating the level at which underwater noise potentially disturbs or injures marine animals. Hence, there are no guidance values for allowable underwater noise levels from noise-producing activities to avoid serious environmental impacts. Several countries in Europe have defined thresholds for when underwater noise can result in severe negative environmental impacts as well as standards for measuring, analysing and reporting underwater noise levels.
The purpose of this study is to review the scientific literature on under-water noise from pile driving and its effects on marine life. The study aims to define the noise levels that can cause injury and other negative effects and, on this basis, recommend noise levels that can be used to establish guidance values for regulating underwater noise for Swedish waters and species. The study presents examples of the factors that contribute to sound propagation in Swedish waters and how this influences the noise level from a pile strike as a function of distance at four study areas along the Swedish coast. Additionally, the study contains a thorough technical description of pile driving activities, basic underwater acoustics and noise effects on marine animals. These effects (injury and behavioral, e.g., flight, but not subtle effects) are demonstrated on representative species such as the harbour por-poise (Phocoena phocoena), Atlantic cod (Gadus morhua), Atlantic herring (Clupea harengus) and on fish larvae and eggs. The study’s authors look at the original sources of information that other countries base their guidelines and thresholds on, so the recommendations follow scientifically determined levels rather than values that have been rounded off or otherwise altered.
The study presents sound levels in three different units, each with different biological relevance to the effects caused by a pile driving activity. None of the sound levels have been frequency weighted for a specific species, as this method is not yet fully established. The first unit used is the sound pressure level SPL(peak), which is the maximum overpressure or underpressure of the noise pulse generated by the pile strike. This unit has a high relevance for behavioural effects. The sound exposure level, SEL, is the calculated energy level over a period of time and expresses the energy of the entire sound pulse. SEL is the unit most related to hearing impairing effects. SEL(ss) is the value for a single strike while SEL(cum) is the cumulative value of a determined number of pulses over a period of time.
The review revealed that for Atlantic cod and Atlantic herring there are cur-rently no studies that can be used to determine a species’ specific threshold value for injury, but studies show that loud noise can affect both species negatively. Because of this, the recommended noise levels for injury are based mainly on studies on other species exposed to pile driving noise in laboratory environments, supported by studies conducting large-scale experiments in tanks and oceans. The levels at which fish are at risk of death or sustaining serious injury to internal organs is SPL(peak) 207 dB re 1 µPa,SEL(ss) 174 dB re 1 µPa2s and SEL
(cum) 204 dB re 1 µPa2s. Note that for injury in fish, the
cumu-lative sound exposure level has higher relevance than the single-strike level as the cited studies found injuries after a certain time period of exposure. The thresholds for fish larvae and eggs are based on the fact that no negative effects were observed at exposures of up to SPL(peak) 217 dB re 1 µPa, SEL(ss) 187 dB re 1 µPa2s and SEL
(cum) 207 dB re 1 µPa2s. However, there are
rela-tively few studies on early life stages of fish.
There are more species-specific studies on harbour porpoises regarding noise than there are for Atlantic cod and Atlantic herring. Nonetheless, only a few can be used to determine thresholds that will lead to injury or negative behavioural effects. The levels at which there is a risk of a temporary impact on hearing, i.e. temporary threshold shift (TTS), for the harbour porpoises is SPL(peak) 194 dB re 1 µPa, SEL(ss) 164 dB re 1 µPa2s and SEL
(cum) 175 dB re
1 µPa2s. When it comes to TTS, the cumulative sound exposure level, SEL (cum),
is of primary importance. However, this unit is dependent on a specific time and number of pulses. For permanent threshold shift (PTS), the level is set to SPL(peak) 200 dB re 1 µPa, SEL(ss) 179 dB re 1 µPa2s and SEL
(cum) 190 dB re
1 µPa2s. The recommended level should be revised as new relevant studies
Glossary
ACCOBAMS Agreement on the Conservation of Cetaceans in the Black Sea, Mediterranean Sea and Contiguous Atlantic Area.
ASCOBANS Agreement on the Conservation of Small Cetaceans in the Baltic, North East Atlantic, Irish and North Seas. Acoustic impedance The ratio (the resistance) of sound pressure to the
particle velocity of the sound wave.
CTD (Conductivity, Temperature and Depth). Sensor that measures water conductivity (for the calculation of salinity), temperature and depth. From these values, the sound velocity profile can then be calculated. Cut-off frequency In underwater acoustics, the cut-off frequency that
sets the limit for the lowest frequency that can prop-agate in shallow waters.
Far field The noise at a distance of at least 10 wavelengths away from the source (for the lowest frequency). An example is the wavelength at the frequency 100 Hz about 15 metres in the water. At this dis-tance, one can make a linear adjustment of sound pressure as a function of distance.
Full-field model Numerical model that calculates the exact solution to the elastodynamic wave equation everywhere, that is, in both the near and far fields.
HELCOM The Helsinki Commission. Convention on the pro-tection of the Baltic Sea’s marine environment. ICES International Council for the Exploration of the Sea. IUCN International Union for Conservation of Nature. Near field Can be defined in different ways. In this report,
it refers to the sound field near the source, for example within 10 wavelengths from a source. Numeric model An algorithm implemented in a computer in order
to solve a mathematical problem.
OALib Ocean Acoustics Library (oalib.hlsresearch.com). Website that provides software and data for model-ling sound propagation in water. Funded by the U.S. Office of Naval Research.
OSPAR The Convention for the Protection of the Marine Environment of the North-East Atlantic.
PSU Practical salinity unit. A dimensionless unit used to estimate the salinity of water. Salinity is the centration of salt in water. PSU is obtained by con-verting the conductivity of water to salinity and is expressed in parts per thousand.
Peak (P) Shortened to (peak) in this document. Also called zero-peak (Lz-p). Is expressed in dB re 1 µPa. Peak-to-Peak (P-P) Shortened to (peak-peak) in this document.
Is expressed in dB re 1 µPa.
PTS Permanent threshold shift. A permanent hearing injury that involves a reduced ability to hear sounds within the damaged frequency range.
RMS Root-mean-square is the same as the effective value. The square root of the average of the square of the sound pressure over a given duration.
SEL Sound exposure level. Is expressed in dB re 1 µPa2s.
Can be given for both a single pulse, SEL(ss), and as a weighted mean over many pulses, SEL(cum). Sound velocity
profile (SVP)
The velocity of sound as a function of water depth. Source level (SL) Same as signal strength. Refers to a reference inten-sity or reference effect generated by a plane wave with the sound pressure re 1 µPa RMS at a distance of 1 metre in an isotropic water volume with density 1,000 kg/m3 and sound speed 1,500 m/s.
SPL Sound pressure level. Is expressed in dB re 1 µPa in water and dB re 20 µPa in air.
Stratification In geology, the order in which the soil or rock layers follow each other.
Third-octave band Division of an octave band in three parts. Also known as a 1/3 octave band. An octave band is when the ratio between the lowest and highest tone is 2:1. TL Transmission loss. Indicates how much a sound
wave weakens from a point situated 1 metre from the sound source to a point at a distance R. TL con-sists of three parts, geometric dispersion, absorption and anomaly.
TTS Temporary threshold shift. A temporary hearing injury that involves a reduced ability to hear sounds within the damaged frequency range.
1 Background
During the construction of bridges, offshore wind farms and other offshore or near-shore structures, some form of pile driving method is often used to drive the structure into the bottom. This means that a foundation pile, beam or pole is hammered or vibrated down into the bottom. These operations can generate extremely high noise levels that propagate into the water and downward to the bottom. Sound can travel very far and fast in water, about four times faster than in air due to the higher density of water. This noise is so high that marine animals can be disturbed, harmed or even killed. In addi-tion, the frequency content of the emitted sound coincides with many marine organisms’ zone of audibility (Figure 1). Much construction is currently taking place in Europe’s maritime and coastal regions, with more planned in the future. In Sweden, few offshore wind farms have yet to be created despite the availability of the required permits. However, work on bridges and in ports takes place relatively often. The body of knowledge on how this noise impacts marine life has been expanded in recent years, with much measure-ment data primarily from the establishmeasure-ment of offshore wind farms. But critical gaps in knowledge remain.
Today, Sweden lacks established maximum noise levels for indicating when underwater noise can begin to cause serious environmental effects, similar to those found on land. Several European countries have some form of thresholds or guidance values indicating when serious environmental effects can occur, as well as standards for measuring and reporting underwater noise.
Figure 1. Overview of the overlap in frequency between human activities and the audibility zones of marine animals, modified after Scholik-Schomer (2015).
Underwater sound is one aspect of good environmental status according to the EU’s Marine Strategy Framework Directive and thereby part of Sweden’s Marine Environmental Ordinance, the national implementation of this direc-tive. This ordinance (HVMFS 2012:18) specifies two criteria for good envi-ronmental status, one of which one concerns impulsive sound sources. There are still no established threshold values for impulsive sound, nor are there any environmental quality standards with indicators for achieving good envi-ronmental status by 2020.
This is because the body of knowledge on sound levels in Swedish marine areas is relatively low, and the impact on population levels and eco-systems is not yet fully understood (Swedish Agency for Marine and Water Management, 2015). Environmental quality standards for marine environ-ments are based on Chapter 5 of the Swedish Environmental Code and apply for inspections and certifications, which are important tools for protecting the marine environment. The effects of underwater noise and the standards for protection measures are also part of the Swedish Environmental Code (Chapter 2), requirements for environmental assessment (Chapter 6), pro-visions for water operations (Chapter 11) and regulatory requirements (Chapter 26). The monitoring programme for the marine environment direc-tive contains a plan for future monitoring of underwater noise. This plan also states that a register should be kept containing the time and location of activ-ities like pile driving that have generated high impulsive sounds in Swedish waters (Swedish Agency for Marine and Water Management, 2015).
1.1 Underwater sound
In water, sound energy propagates as particle motion. This motion creates longitudinal pressure variations in which the medium is compressed and decompressed, giving rise to sound pressure fluctuations. Pressure and motion are related to each other through acoustic impedance. There are several fundamental differences between these two phenomenons, one being that particle motion contains information about sound direction. Furthermore, transmission losses (the dampening of sound) are different for pressure and acceleration in the vicinity of a sound source, near the seabed and near the surface, which complicates the calculations. Sound pressure fluctuations are expressed in the unit of pressure Pascal (Pa); for historical and practical rea-sons, the sound pressure level in air is referenced to 20 µPa and in water to 1 µPa. The logarithmic scale in decibels (dB) has been introduced in acoustics because of its great dynamics. This makes it important to specify which refer-ence is used when specifying a sound pressure level in decibels: 1 or 20 µPa. So, one cannot directly compare decibel values measured in air with values measured for water (see Vindval reports Sigray et al. (2009), Andersson och Sigray (2011) and Andersson et al. (2011) for a further description of under-water sound and effects from other types of sound sources).
Understanding that sound manifests itself as both pressure and particle motion significantly aids the understanding of environmental impact on marine ani-mals, who have different sensor systems for detecting sound. All fish can detect particle motion with their inner ears, which contain ear stones (otoliths) and a lateral line organ. Even invertebrates like squid can detect particle motion, but this animal group does not fall within the scope of this study. Fish that have an air-filled cavity in their body, such as a swim bladder, can transform sound pressure to motion and thus increase their sensitivity in terms of both frequency and level. Marine mammals can only register sound pressure with their ears. Chapter 6 discusses this topic further and describes the hearing of harbour porpoises, herring and cod in more detail.
Most studies about the effects of sound on marine animals only discuss sound pressure. But it is generally accepted that particle motion also plays a significant role for the effects of pile driving noise, especially for fish without swim bladders and for demersal (bottom-feeding) fish (Mueller-Blenkle et al., 2010; Van der Graaf et al., 2012; Popper et al., 2014). This is because impact pile driving can generate very high levels of particle motion in the water (Thomsen et al., 2015) and at the surface of the seabed (Miller et al., 2015; Hazelwood and Macey, 2015). There are currently no national or interna-tional guidelines on how to measure or calculate particle motion. Therefore, particle motion is not further addressed in this report, although it is an area that should be studied in order to understand the full impact of pile driving noise on fish and invertebrates.
1.2 Purpose of the study and reader’s guide
The purpose of this study is to present scientific documentation on under-water pile driving noise and its effects on marine life. The ultimate goal is to establish guidance levels for noise that causes injury and other negative effects, based on the current scientific information, which can then be used to deter-mine thresholds for regulating underwater noise adapted to Swedish waters and species. Chapter 2 contains the noise levels that this study found to be harmful to Swedish species and marine areas. It also contains examples that illustrate sound propagation in Swedish waters, and how the local acoustic environment affects sound levels from a pile driving activity as a function of distance in four study areas around the Swedish coastline. For the sake of brevity, Chapter 2 contains summary information that is not further described in detail. Subsequent chapters contain in-depth information such as technical descriptions that offer the reader insight into pile driving activities, under-water acoustics and effects on marine life. The study has returned to original sources used by other countries to determine their own thresholds. This was done in order to provide recommendations grounded in scientifically estab-lished levels. The levels have not been rounded off or otherwise changed.
Chapter 3 discusses the nature of pile driving noise and previously measured noise levels as well as measuring standards for underwater sound.
Chapter 4 describes the factors affecting sound propagation in Swedish waters, and Chapter 5 describes the noise mitigation methods in use today and how they can reduce the impacted area. Chapter 6 describes the influence on marine organisms that can result in direct and lasting effects, such as injury and flight behaviour on an individual level. The species and their scientific names that are discussed include the harbour porpoise (Phocoena phocoena) and the fish species herring (Clupea clupea) and cod (Gadus morhua), as well as fish eggs and larvae. Thresholds and guidelines from other countries relat-ing to underwater noise are described in Chapter 7.
2 Recommendations on harmful
noise levels for pile driving
2.1 Definition of threshold
A threshold indicates the level of a harmful substance or activity that must not be exceeded by a noise-producing activity. A threshold should be possi-ble to manage from an administrative point of view, be measurapossi-ble and at the same time have high biological relevance. In other words, it should be able to be linked to the percentage of a population that could be exposed to harmful noise and to how vulnerable the population is. The spatial estimate depends, however, on a number of local environmental parameters that affect sound propagation; see Section 2.4. Several countries have up to three different types of thresholds for underwater noise from impact pile driving, depending on which environmental impacts require prevention. For a detailed description of the physical units that relate to the harmful levels recommended below and how these are related to injury, see the in-depth literature survey in subsequent chapters. The levels recommended in this study can be used by government authorities to determine which noise levels are acceptable and which should not be exceeded. When multiple noise levels are indicated, the level that is exceeded first is the one that applies. The distance from a pile driving activity at which these noise levels can occur cannot be generalised because the level and the local environmental conditions of the sound source play a large role for the radiating sound and how far it will propagate. To estimate these parameters, modelling and direct measurements can be carried out at the permit application stage so as to detect any environmental risks early on in a permit process.
2.2 Recommended noise levels
Recommended noise levels for underwater pile driving that risk resulting in serious environmental impacts on fish, fish eggs and larvae are presented in Table 1 and for harbour porpoises in Table 2. The reasoning behind using these levels is briefly explained in this section, and an in-depth discussion is given in the next chapter. Note that the noise levels for TTS are not weighted, i.e., they are not adapted to the hearing ability of the porpoises (see explanation in Section 3.3). At present, weighting curves for fish are lacking. In some cases, they are available for harbour porpoises but the methodology is not standard-ised and there is uncertainty around how to make this adjustment for different types of sound sources (Tougaard et al., 2015). No European country currently uses weighted threshold values for pile driving noise, although in 2015 the U.S. National Oceanic and Atmospheric Administration (NOAA) proposed both weighted and unweighted thresholds for underwater noise. The proposed noise levels presented here are not weighted because there is no standardised method for doing this. However, a weighting methodology should be included in future
There are three different units for each type of impact and animal group. Multiple units are used because noise can affect animals differently (Southall et al., 2007), and because a measured sound level can be presented in several ways. Sound pressure level (SPL(peak)) is the maximum overpressure or under-pressure exhibited by the sound pulse generated by one pile strike. This value is easy to measure, and biological relevance is high since several scientific studies have noted a correlation between SPL and behavioural impacts – and even physiological damage.
Sound exposure level (SEL) is calculated over a given period of time and takes into account the energy of the entire sound pulse. SEL is the unit best used to express hearing injury thresholds in harbour porpoises (Tougaard et al., 2015) and injury to fish (Halvorsen et al., 2011, 2012a, b; Casper et al., 2012, 2013). SEL(ss) is the value of a single strike, and SEL(cum) expresses the cumulative value of several strikes over a given period of time. These two SEL units have different uses and are related to injury in various ways. SEL(ss) is easy to measure and has good relevance to injury in animals. However, it is not a metric that can describe the total received energy level for an animal. SEL(cum) gives us an idea of how much energy a given stationary point at a certain distance has received. But making the link to an animal’s received sound level is difficult, since many animals can travel and be exposed to more or fewer sounds (this reasoning does not apply to eggs and larvae and many sessile invertebrates). Studies show that it can be appropriate to have several different thresholds since both the number of pile strikes and the levels will influence the extent of the injury. Different thresholds can thus be used at the same time when prescribing the limiting conditions for an offshore wind farm operation. As regards the SEL unit, it should be noted that few strikes with high SEL(ss) give the same SEL(cum) as many strikes with low SEL(ss) (Halvorsen et al., 2011, 2012a).
2.2.1 Fish
Based on the literature, it is observed that high noise levels can adversely affect both cod and herring. However, there are too few studies on cod and herring that can be used to determine species-specific noise levels that can be harmful. The proposed levels are instead based on studies of other spe-cies that have been exposed to pile driving noise in a laboratory environment (Halvorsen et al., 2011, 2012a, b; Casper et al., 2013) (Table 1). The authors of these studies suggest guidelines for noise levels where injury occurs cor-responding to SEL(cum) 207 dB re 1 µPa2s, which was reached when the fish
were exposed to 960 sound pulses with a sound exposure level of SEL(ss) 177 dB re 1 µPa2s. The injury that occurred is considered to be of such
magnitude that it can affect the fishes’ survival. However, injury to internal organs was observed at lower noise levels equivalent to SEL(cum) 204 dB re 1 µPa2s, since the fish were exposed to the same number of pulses but with
a sound exposure level of SEL(ss) 174 dB re 1 µPa2s. The fish are expected to
recover from these injuries in favourable environments without predators, and with the right current conditions and easy access to food (Popper et al.,
2014). Most fish do not live under these conditions, and in the current situa-tion this lower noise level is instead proposed as a level for injury in fish (see a more detailed description of the results from the various studies on which the proposed noise levels are based in Section 6.2.4). Note that for injury to fish, the cumulative value has higher relevance than the single value for SEL because the studies present the injury after a certain period of exposure. It remains unclear how many pulses and how long fish can be exposed before injury occurs. The proposed SPL(peak) value (207 dB re 1 µPa) is taken from the guidelines in Popper et al. (2014), based on the same laboratory studies.
Table 1. Recommendations on thresholds for pile driving noise for fish, fish eggs and larvae. The threshold levels are presented as SPL (maximum overpressure or underpressure of the generated sound pulse), SEL(ss) (sound exposure level for a single sound pulse) and SEL(cum) (sum of the sound exposure levels for a number of pulses in a given period of time). See the text for the reasoning behind using these levels.
Fish Eggs and larvae
Mortality and injury to
internal organs SPLSEL(peak) 207 db re 1 µPa SPL(peak) 217 dB re 1 µPa
(ss) 174 dB re 1 µPa2s SEL(ss) 187 dB re 1 µPa2s SEL(cum) 204 dB re 1 µPa2s SEL
(cum) 207 dB re 1 µPa2s
Although the recommended noise level for injury in fish is based on stud-ies of multiple specstud-ies with anatomical and morphological differences, a degree of uncertainty still remains. There are relatively few species that have been tested, and the equipment allows for only smaller fish to be exposed. Conditions in the laboratory also differ from the fish’s natural habitat. It is primarily the exposure time that is expected to be lower for the wild fishes that are able to escape the harmful noise levels. Note that the injury observed at SEL(cum) 204 dB re 1 µPa2s occurred when fish were exposed to 960 sound
pulses (SEL(ss) 174 dB re 1 µPa2s), which is the equivalent exposure for about
24 minutes. Depending on the individual’s size and the different conditions in its surroundings, a cod can swim approximately 550–1,300 m in this time (Beamish, 1966; Wardle, 1977; Thurston and Gehrke, 1993) and a her-ring can swim the equivalent of approximately 1,500 m (He and Wadle, 1988; He, 1993). A flight behaviour assumes, however, that the fish react to the noise. During exposure to pile driving noise, behavioural changes were observed in cod in large-scale experiments in the sea at SPL(peak) 140 to 160 re 1 µPa dB (Mueller-Blenke et al., 2010) and in European sprat (similar hearing to herring) at SPL(peak-peak) 163 re 1 µPa and SEL(ss) 135 dB re 1 µPa2s (Hawkins
et al., 2014). The results show that the fish react to the pile driving noise and are thus expected to swim away from the noise. At the same time, there are studies indicating that fish exposed to high noise levels remain within an area if it is important enough to the fish’s survival or reproduction (Wadle et al., 2001; Pena et al., 2013).
At present, no noise levels are proposed for flight behaviour or a temporary threshold shift (TTS) in fish. This is because unlike physiological damage to internal organs, both flight behaviour and hearing damage are linked to the species’ specific sensitivity to frequency and sound intensity. And using the
existing literature, it is not possible to assess whether flight behaviour nega-tively affects the species at the population level or whether the effect of the impact is related to the area and period of time.
2.2.2 Fish eggs and larvae
The proposed noise levels for damage on fish eggs and larvae (Table 1) are based on the fact that no adverse effects were observed at exposures to pile driving-induced noise levels up to SEL(cum) 207 dB re 1 µPa2s (100 strikes),
SEL(ss) 187 dB re 1 µPa2s and SPL
(peak) 217 dB re 1 µPa (Bolle et al., submit-ted manuscript, b). However, several studies have observed increased
mortal-ity due to the noise from airguns at SPL(peak) 217 dB re 1 µPa and above (see Table 10). The immobility of fish eggs and larvae means that they experience a longer exposure than a larger fish. Harmful noise levels occur only near the sound source, and because the eggs and larvae exhibit naturally high levels of mortality in the wild, several authors point out that mortality caused by high impulsive noises is assessed to be insignificant for the population.
2.2.3 Harbour porpoises
For harbour porpoises, there are more species-specific studies related to noise than for cod and herring. However, only a few can be used to propose harm-ful noise levels. The proposed thresholds for harbour porpoises presented in Table 2 are based on existing literature on harbour porpoises and on inter-national thresholds. For single pulses (SPL(peak) 194 dB re 1 µPa and SEL(ss) 164 dB re 1 µPa2s ), the noise level that causes TTS is based on a study by
Lucke et al. (2009), which is deemed to have the highest relevance in relation to a pile driving noise out of all published assessments. The published study presents a peak-peak value which here has been recalculated to a peak value (–6 dB; see Section 3.2.3). The noise level for the cumulative sound exposure level (SEL(cum) 175 dB re 1 µPa2s) corresponds to the Danish threshold value
(Tougaard, 2015), which is based on a study by Kastelein et al. (2015) (see Section 7.3.1). The cumulative sound exposure level has major significance for TTS. This value is, however, linked to a specific duration and number of pulses. In this case, SEL(cum)175 dB re 1 µPa2s is related to one hour’s pile
driving with 2,760 pulses. Such exposure assumes that the harbour porpoise does not move away from the source of disturbance, which cannot be consid-ered expected behaviour in a natural environment. However, there are other combinations of sound level and number of strikes over time that can result in this harmful level.
Table 2. Recommended noise levels for pile driving noise that can result in temporary (TTS) or permanent (PTS) hearing injury in harbour porpoises. The levels are presented as SPL (maximum overpressure or underpressure of the generated sound pulse), SEL (sound exposure level over the entire pulse) and SEL(cum) (sum of the sound exposure levels for a number of pulses in a given period of time). See the text for the reasoning behind using these levels.
TTS PTS
Harbour porpoise SPL(peak) 194 dB re 1 µPa SPL(peak) 200 dB re 1 µPa
SEL(ss) 164 dB re 1 µPa2s SEL
(ss) 179 dB re 1 µPa2s SEL(cum) 175 dB re 1 µPa2s (≥1 h) SEL
No measured thresholds exist for permanent threshold shift in the harbour porpoise because it is unethical to expose them to such high noise levels. There is, however, a study on a closely related species of porpoise, the Asian porpoise (Neophocoena phocaeenoides) (Popov et al., 2011) that is relevant for PTS in harbour porpoises. Since newer studies show a frequency depend-ence in marine mammals and since the study is not considered representative of pile driving noise, PTS is instead calculated for single pulses (SEL(ss) 179 dB re 1 µPa2s) on the basis of the study by Lucke et al. (2009) (TTS + 15 dB).
This reasoning is presented in the revision of the Danish threshold values (Tougaard, 2015). The proposed noise level causing PTS from cumulative sound exposure is, as for TTS, based on a study by Kastelein et al. (2015) and calculated to SEL(cum) 190 dB re 1 µPa2s (TTS + 15 dB) in the Danish threshold
values. The proposed SPL(peak) value (200 dB re 1 µPa) for PTS is taken from a line of reasoning in NOAA (2015) and the study by Lucke et al. (2009) (TTS + 6 dB), but should be used with caution since it is the SEL value that has the best scientific agreement in the literature with regard to the impact on the hearing of marine mammals (Southall et al., 2007; Finneran, 2015).
The scope of this study did not include to propose noise levels for avoid-ance or flight behaviour in harbour porpoises. But the levels currently used and presented in Danish and Dutch guidelines for a behavioural impact are SEL(ss) 140 dB re 1 µPa2s, which are based on a study by Dähne et al. (2013).
2.3 Methods for reducing the environmental impact of pile driving noise
To get an idea of the noise levels a planned activity might generate, sound propagation calculations can be made for the specific area. These calcula-tions can also be verified by measuring the actual sound propagation in the area. This work provides important information which in turn can be used in a risk assessment for the underwater noise generated by the planned activity. Furthermore, one should estimate the biological values in the area and the periods during the year that are most critical. If the dates of the activities and the biological values overlap and the potential risk of injury become too high, several options are available for reducing these risks. The generated noise can be reduced by using various pile driving techniques, and the radiated noise can be mitigated with mitigation systems such as bubble curtains or isolation casings (see Chapter 5). Animals – primarily seals and harbour porpoises – can also be scared away from the area closest to the installation where they risk being harmed by using acoustic deterrent devices (ADDs) (Kyhn et al., 2015; Mikkelsen et al., 2015). Some fish species have even been shown to respond to sounds similar to those generated by ADDs (Kastelein et al., 2007, 2008). The operator can also create a similar effect by using a ramp-up method, in which they gradually increase the driving rate at the start of an activity. If the latest mitigation techniques and preventive measures such as ADDs are used, the impact zone for injury to animals around a pile can be limited to a few hundred metres or kilometres from the pile driving activity; see Section 5.5 and Bellman et al. (2015).
These measures are commonly used in the pile driving guidelines of several European countries. Installation work can also be appropriately scheduled in order to avoid sensitive periods of spawning and mating.
The better data there is for biological values and the noise levels that are generated and radiated, the easier it will be to prevent the negative environ-mental impact of noise. There may be times when no noise mitigation meas-ures are necessary, perhaps because an area lacks biological values or because the sound propagation conditions are such that noise levels will not cause harm within a larger area. Yet there may be occasions when noise mitigation measures must be used, as when the potential injury risks becoming extensive or when installation work is done during a specific critical period from a bio-logical point of view.
2.4 Towards regulation of underwater noise
This report can be used by operators and industry as a scientific basis for reducing the effects of impact pile driving on marine animals. After this report, based on the guidance levels, the next step is determining the pre-scribed thresholds for pile driving activities and the approach that will ensure these values are not exceeded. The following list summarises the conclusions in this report and contains recommendations on which information to include in future regulatory documents:
• Recommended harmful levels for injury to harbour porpoises, fish, fish larvae and eggs can be converted to threshold values straight off or with adjustments made based on the precautionary principle as relates to the current body of knowledge.
• When developing national thresholds, the most appropriate units for the current environmental impact should be used, i.e. SPL(peak), SEL(ss), or SEL(cum). When multiple noise levels for a threshold are indicated, the level that is exceeded first is the one that should apply.
• In the early stages of the application process, the operator should estimate the probable source level for the current activity and how this sound might propagate in the relevant area during the months when installation is scheduled. This is best done through a combination of actual measure-ments and modelling. A threshold value can thus be connected to an area around the activity in order to estimate the spatial impact.
• An assessment should be made of the biological values and the biologi-cally critical periods in the area affected by an installation in order to link the spatial impacted area to the biology.
• The population densities of the species (number of individuals per sur-face area) and their vulnerability should be taken into account when determining the threshold values within the exposed area.
• The operator should propose appropriate measures for reducing the potential negative effects, such as mitigation techniques, acoustic deter-rent devices, and choice of installation period.
• The operator should perform a survey when construction work is started to ensure that the established thresholds are not exceeded.
• Standards should be established for taking surveys, managing and ana-lysing data, and documenting requirements. Since the first version of this report, an ISO standard has been published called ISO 18406:2017 “Underwater acoustics – Measurement of radiated underwater sound from percussive pile driving”.
2.5 Sound propagation from pile driving in
Swedish waters
To give an idea of the distances at which the recommended noise levels can arise from a pile driving activity, SEL(ss) has been calculated in four selected areas. These areas were chosen because wind farms exist in the area and because they contain designated areas for offshore wind power or areas where one or more installations are under consideration. In addition, the sites represent areas with varying acoustic environmental parameters such as bottom type and salinity. There are, however, great uncertainties associated with the parameters within each area. The examples below should not be viewed as “exact” but instead illustrate the variations exhibited by the sound propagation.
Figure 2. Map of the selected sea areas where sound propagation from a pile strike is calculated. 1 Kattegat, 2 Hanöbukten, 3 The Southern Baltic and 4 The Bothnian Sea. Coloured polygons in the sea are areas designated as interesting for renewable energy production at the national level.
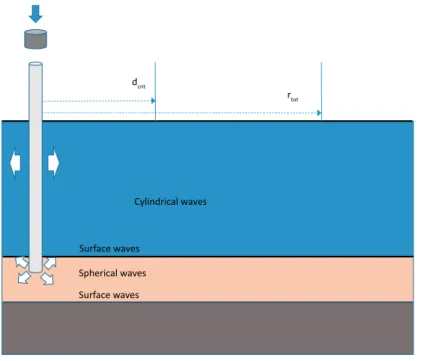
Examples of relatively extreme, but not rare, sound propagation conditions has been used. The four selected areas are the Kattegat, Hanöbukten, the Southern Baltic Sea and the Gulf of Bothnia (Figure 2). The sound source used in the calculations has the same sound level as that described in
Section 4.3, i.e., an unmitigated pile driving operation in the German North Sea. The depth at the German measurement site was 20 m and the steel piles were 6 m in diameter. The impact energy level was 700 kJ and the pile was driven into a sandy seabed. The measurement was made 750 m from the pile driving. The estimated equivalent source level was SEL(ss) 226 re 1 µPa2s for
the frequency range of 10 Hz to 25 kHz (see 4.3.1). Based on these para-meters, acoustic modelling was done using both a ray-tracing based model for high frequencies and a full-field wave-equation based model for lower frequencies (below 800 Hz). When mitigation techniques are used during a pile driving, they will have a positive effect on the noise level and will reduce the radiated noise. This means that the equivalent source level is adjusted downwards, thereby reducing the radiated intensity. To obtain an approximate figure for the levels, the number of decibels used to mitigate the radiated noise is deducted from the table values below. Today, the sound level has been successfully reduced by 10–20 dB (see also Chapter 5).
Sound velocity profiles are based on climate data from the Swedish Meteorological and Hydrological Institute, and should be viewed as type values for the selected months of February and August and for the area as a whole. In fact, a sound velocity profile can vary significantly over time. The high-resolution bottom data were taken from the Geological Survey of Sweden and are meant to resemble a type bottom (i.e. berock, sand, gravel, clay) for that specific marine area. The reference bottom type selected for use in the calculations is the one among the different bottom types in the area that is considered to be the most common. The water depth for each area was taken from a Swedish Maritime Administration database.
Estimated noise levels are highly dependent on the environmental param-eters used in the model. Sound characteristics for the bottom sediment are often unavailable. The same type of bottom can have different acoustic char-acteristics. In the absence of locally specific data, the modelled sound propa-gation should be regarded as guidance. The measured values might differ from the modelled ones. To make the results more accurate, the local acoustic characteristics should be established. In these examples, the unit SEL(ss) is used to illustrate the received noise levels as a function of distance. This is because the data were delivered in this unit from Germany and because this unit is suitable for studying the effects on the hearing of harbour porpoises. The unit can also be used to study injury to fish. But it should be noted that the onset of injury also depends on the number of sound pulses over time. For example, in the case of fish the recommended noise levels SEL(ss) 174 dB re 1 µPa2s are based on an exposure of 24 minutes (960 pulses) during which
2.5.1 Kattegat
In the Kattegat, it is assumed that the bottom consists of a 0.5 m thick sedi-ment layer of watery clay on top of a 20 m thick sedisedi-ment layer of sand underlain by crystalline bedrock. The salinity was set at 34 PSU. The calcu-lations were made out to a distance of 25 km. The water depth in the area along a bearing of 45° to 225° ranged between 20 and 40 m. Sound velocity curves that represent a typical February (winter) and August (summer) were used (Figure 3, left). August exhibits a downward-refracting profile, which means that the sound is refracted down to the seabed, which in turn absorbs a large part of the sound. During February, sound was refracted from the sur-face down to a 20 m depth up to the sursur-face. The sursur-face reflects the sound, which then becomes locked in a channel. During a pile driving operation with an equivalent source level of SEL(ss) 226 dB re 1 µPa2s, the sound will travel
longer in February than in August (Figure 3, right). The phenomenon becomes apparent at a distance of about 3 km, at which the two curves diverge. This sound propagation can be considered rather extreme – but not rare – in the area. The two vertical lines indicate two of the recommended harmful noise exposure levels for fish and harbour porpoises, respectively. It should be emphasized that if the source level changes, the blue line and the red line shift vertically. Table 3 shows the received sound exposure levels at different dis-tances when the equivalent source level was set to SEL(ss) 226 dB re 1 µPa2s.
Figure 3. Left: Sound velocity profiles for February (black) and August (red) in the Kattegat. Right: The sound propagation for a pile strike with an equivalent source level of SEL(ss) 226 dB re 1 µPa2s as a function of distance along the bearing of 45° to 225° in the Kattegat. The calculations were made with sound velocity profiles typical for February (blue) and August (red). The grey line shows the recom-mended threshold for TTS for harbour porpoises (SEL(ss) 164 dB re 1 µPa2s), and the black line mortality and injury to the internal organs of fish (SEL(ss) 174 dB re 1 µPa2s). Note that the injury also depends on the number of sound pulses over time. The figure shows examples of modeled sound propagation with special sound propagation conditions and assumptions about exposure (see explanation in Section 2.5).
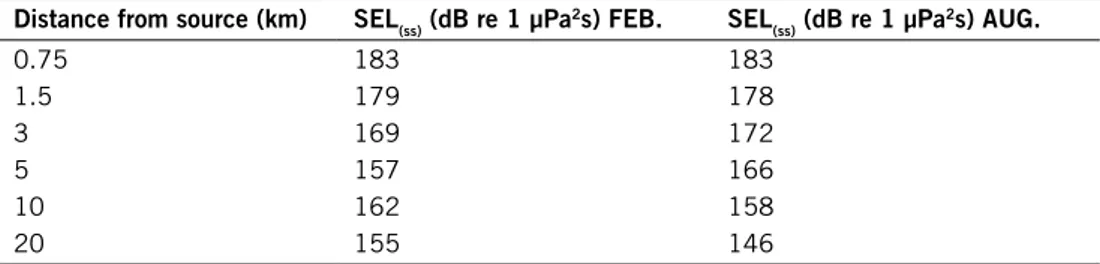
Table 3. Sound exposure level as a function of distance in the Kattegat when the equivalent source level was set at SEL(ss) 226 dB re 1 µPa2s.
Distance from source (km) SEL(ss) (dB re 1 µPa2s) FEB. SEL
(ss) (dB re 1 µPa2s) AUG. 0.75 183 183 1.5 179 178 3 169 172 5 157 166 10 162 158 20 155 146
2.5.2 Hanöbukten
In Hanöbukten, the bottom is assumed to consist of a 0.5 m thick layer of clay on top of 3 m of moraine underlain by limestone. The salinity was set at 8.6 PSU. The calculations were made out to a distance of 25 km. The water depth in the area along a bearing of 90° to 270° ranged between 50 and 60 m. Source depth was set at 32 m. The sound velocity profiles show great differ-ences from the surface down to 30 m because the surface waer is warmed up in August. Below 30 m, the difference between profiles is less. Since the sound velocity profiles do not differ significantly at the source depth, the damping is comparable for the two months and the received level at different distances similar to a pile strike with an equivalent source level of SEL(ss) 226 dB re 1 µPa2s (Figure 4, left). If the source depth was shallower, there would be a
dif-ference between the months as with the Kattegat. This sound propagation can be considered rather extreme – but not rare – in the area. The two vertical lines indicate two of the recommended harmful sound exposure levels for fish and harbour porpoises, respectively (Figure 4, right). If the source level changes, the distances will also change. Table 4 shows the received sound exposure levels at different distances when the equivalent source level was set to SEL(ss) 226 dB re 1 µPa2s. Here, the similarities in damping as a function of distance are clear.
Figure 4. Left: Sound velocity profiles for February (black) and August (red) in Hanöbukten. Sound velocity profiles for February (black) and August (red). Right: The sound propagation for a pile strike with an equivalent source level of SEL(ss) 226 dB re 1 µPa2s as a function of distance along the bearing of 90° to 270° in Hanöbukten. The calculations were made with sound velocity profiles typical for February (blue) and August (red). The grey line shows the recommendation on harmful noise levels for TTS for harbour porpoises (SEL(ss) 164 dB re 1 µPa2s), and the black line mortality and injury to the internal organs of fish (SEL(ss) 174 dB re 1 µPa2s). Note that the injury also depends on the number of sound pulses over time. The figure shows examples of modeled sound propagation with special sound propagation conditions and assumptions about exposure (see expla-nation in Section 2.5).
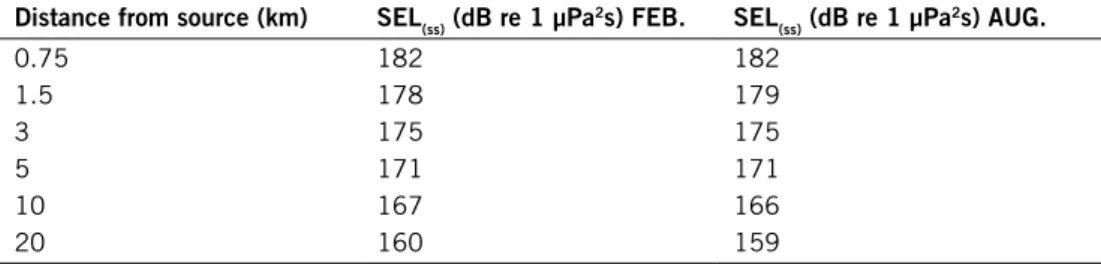
Table 4. Sound exposure level as a function of distance in Hanöbukten when the equivalent source level was set at SEL(ss) 226 dB re 1 µPa2s.
Distance from source (km) SEL(ss) (dB re 1 µPa2s) FEB. SEL
(ss) (dB re 1 µPa2s) AUG. 0.75 182 182 1.5 178 179 3 175 175 5 171 171 10 167 166 20 160 159
2.5.3 The Southern Baltic
In the Southern Baltic Sea in the vicinity of the Midsjö banks, it is assumed that the bottom consists of a 20 m thick sand layer on top of crystalline bedrock. The salinity was set at 7.8 PSU. The calculations were made out to a distance of 25 km. The water depth in the area along a bearing of 90° to 270° ranged between 20 and 50 m. The sound velocity profiles indicate large differences down to 40 m as the surface water is warm in February and then evens out at greater depths (Figure 5, left). In August, a downward-refracting profile is apparent, resulting in greater mitigation of the noise than for February. As a result, the noise becomes louder at a distance greater than about 2 km in February compared with August (Figure 5, right). For these calculations, an equivalent source level of SEL(ss) 226 dB re 1 µPa2s was
used. This sound propagation can be considered rather extreme – but not rare – in the area. The two vertical lines indicate two of the recommended harmful noise exposure levels for fish and harbour porpoises, respectively. If the source level changes, the distances will also change. Table 5 shows the received sound exposure levels at different distances when the equivalent source level was set to SEL(ss) 226 dB re 1 µPa2s.
Figure 5. Left: Sound velocity profiles for February (black) and August (red) in the Southern Baltic Sea. Right: The sound propagation for a pile strike with an equivalent source level of SEL(ss) 226 dB re 1 µPa2s as a function of distance along the bearing of 90° to 270° in the Southern Baltic Sea. The calculations were made with sound velocity profiles typical for February (blue) and August (red). The grey line shows the proposed harmful noise level for TTS in harbour porpoises (SEL(ss) 164 dB re 1 µPa2s), and the black line mortality and injury to the internal organs of fish (SEL(ss) 174 dB re 1 µPa2s). Note that the injury also depends on the number of sound pulses over time. The figure shows examples of modeled sound propagation with special sound propagation conditions and assumptions about exposure (see explanation in Section 2.5).
Table 5. Sound exposure level as a function of distance in the Southern Baltic Sea when the equivalent source level was set at SEL(ss) 226 dB re 1 µPa2s.
Distance from source (km) SEL(ss) (dB re 1 µPa2s) FEB. SEL
(ss) (dB re 1 µPa2s) AUG. 0.75 185 184 1.5 180 180 3 175 173 5 170 167 10 162 159 20 155 143
2.5.4 The Bothnian Sea
In the Bothnian Sea, the bottom is assumed to consist of a 5 m thick layer of clay on top of a 20 m sand layer underlain by bedrock. The salinity was set at 6.5 PSU. The calculations were made out to a distance of 25 km. The water depth in the area along the bearing of 90° to 270° ranged between 70 and 90 m. The source depths were chosen to give rise to the highest possible levels, which for February is 35 m and for August 52 m. At these depths both of the sound velocity profiles are nearly the same, which explains the lack of any major difference in noise levels for February and August (Figure 6, left). This means that the received noise level at different distances will be the same regardless of month (Figure 6, right). For these calculations, an equivalent source level of SEL(ss) 226 dB re 1 µPa2s was used.
This sound propagation can be considered rather extreme – but not rare – in the area. The two vertical lines indicate two of the recommended harmful noise expo-sure levels for fish and harbour porpoises, respectively. If the source level changes, the distances will also change. Table 6 shows the received sound exposure levels at different distances when the equivalent source level was set to SEL(ss) 226 dB re 1 µPa2s. Here, the similarities in damping as a function of distance are clear.
Figure 6, Left: Sound velocity profiles for February (black) and August (red) in the Bothnian Sea. Right: The sound propagation for a pile strike with an equivalent source level of SEL(ss) 226 dB re 1 µPa2s as a function of distance along the bearing of 90° to 270° in the Bothnian Sea. The calculations were made with sound velocity profiles typical for February (blue) and August (red). The grey line shows the recommended threshold for TTS for harbour porpoises (SEL(ss) 164 dB re 1 µPa2s), and the black line mortality and injury to the internal organs of fish (SEL
(ss) 174 dB re 1 µPa2s). Note that the injury also depends on the number of sound pulses over time. The figure shows examples of modeled sound propagation with special sound propagation conditions and assumptions about exposure (see explanation in Section 2.5).
Table 6. Sound exposure level (SEL(ss)) as a function of distance in the Bothnian Sea when the
equivalent source level was set at 226 dB re 1 µPa2s SEL
(ss).
Distance from source (km) SEL(ss) (dB re 1 µPa2s) FEB. SEL
(ss) (dB re 1 µPa2s) AUG. 0.75 178 179 1.5 174 176 3 171 171 5 168 169 10 162 163 20 159 157
3 Pile driving as a sound source
3.1 Installation techniques
To stabilise the ground prior to building houses, railways or bridges, or as the foundation for offshore wind turbines, the construction industry uses pile driving. Different techniques are currently available for driving the piles into the ground. The main techniques include impact pile driving, vibratory pile driving and drilling. In many cases, a combination of these techniques is used to drive the pile to the desired depth. The piles can vary in diameter, from a few decimetres for port structures up to six to eight metres for an offshore wind turbine monopile (Figure 7). To anchor a jacket foundation or tripod to the seabed, smaller piles are also used that are driven into the seabed, and in some cases the pile driving takes place completely under water. In cases where a specific area of land must be reinforced, piles of metal, wood or con-crete can also be used. An undesired effect of these installation techniques is the high noise levels they produce, which adversely affect marine organisms (Andersson and Sigray, 2009; OSPAR, 2009). This probably occurs even when the pile driving takes place on land in the vicinity of the water and not in the water itself, since vibrations travel down into the ground and out into the water. However, there is a lack of measurements and studies on the sever-ity of pile driving’s effects in the water during this cirumstance. Many factors come into play in this scenario, such as the composition of the seabed and soil, the pile driving technique and the distance to the water. The following sections briefly describe some of the main installation techniques in use today for offshore wind power. (Some examples and data are from land-based operations.) Many more installation techniques exist, but they are either in the trial stage or have not been used to any great extent. For a more detailed description on this topic, see the reports by Saleem (2011) and OSPAR (2014).
Figure 7. Left: Pile driving of a port structure in Ålseund, Norway (Photo: Mathias Andersson, FOI). Right: A pile driving ship in the German North Sea prepares the installation of an offshore wind turbine foundation (Photo: Markus Linné, FOI).
3.1.1 Impact pile driving
During impact pile driving, a hydraulic or diesel hammer strikes a pile, pipe or beam into the ground or the seabed. Falling weights are also used to drive a pile into the ground. The hammer impact energy level or the weight of the falling weight can vary greatly depending on the type of pile and soil condi-tions. Basically, more energy and heavier weights mean more noise emitted. There are some hammers that can strike at up to 3,000 kJ, and these are used today in the offshore industry. In the future, the largest piles/founda-tions (monopiles) for offshore structures are expected to be able to reach up to 8 m or more in diameter. The monopile foundation for offshore wind power works best for a water depth of 10–35 m, and about 80% of all wind turbines today rest on driven monopile foundations (OSPAR, 2014). In order to build at greater depths, even larger foundations are needed. According to Saleem (2011), foundations of at least 7–8 m in diameter are needed for 40 m depths; these remain in the demo phase for such depths. Jacket or tripod foundations can be placed in deeper waters (down to 50–60 m) and, in these cases, the legs are installed attatched to the seabed using smaller piles than traditional monopiles (Hammar et al., 2008; Saleem, 2011). In Sweden, a few wind farms have been built using impact pile driving, like the Utgrunden in Kalmarsund (McKenzie-Maxon, 2000). According to Saleem (2011), impact pile driving brings the advantages of a simple design, proven technology and an ability to handle many different soil conditions. In addition, it is relatively easy to calculate the bearing capacity for the monopile in different soil condi-tions, that is, how well the sediment holds the pile in place. One disadvan-tage of this method is that it generates the highest noise levels. Also, steel is expensive. So the deeper you need to install the more steel you need, and the heavier the structure becomes. And when it’s time to decommission the foun-dation, it is not possible to remove the entire structure – whatever is attached to the seabed or ground will remain.
3.1.2 Vibratory pile driving
Another method used is vibratory pile driving, or vibropiling. With this method, piles are vibrated into the ground at a frequency of about 20–40 Hz (OSPAR, 2014). Rotating counterweights induce this vibration and facilitate penetration of the bottom. For large piles, multiple vibrating systems can be used. Sometimes it can be necessary to impact pile drive a particular portion due to the varied seabed structure (e.g., hard structures such as boulders) during vibratory pile driving. Because the vibrations are relatively low-fre-quency, the so-called cut-off frequency can mean that it can be mitigated by the bottom in certain frequencies. This only applies for shallow water depths lower than 40 metres or so. The combination of vibratory and impact pile driving allows the total noise level to be lower than it would be using impact pile driving only, because a fewer number of strikes are needed to drive the pile into the bottom. In some cases, a lower average broadband level of 15 to 20 dB was measured compared with regular impact pile driving (Elmer et al., 2007a; Betke and Matuschek, 2010). However, it exhibits a more