FACULTY OF ENGINEERING AND SUSTAINABLE DEVELOPMENT .
Wall Compensation Algorithms for M-sequence UWB
Radar
Mhd Jihad Abou Raas
June 2016
Master’s Thesis in Electronics/Telecommunications
Master’s Program in Electronics/Telecommunications
Examiner: Magnus Isaksson
Abstract
A technique for wall compensation in the ultra-wideband (UWB) through-wall imaging radar is presented. The UWB system can be utilize in high precision measurements, but due to phase distortion and amplitude attenuation caused by the wall the precision is limited, the target is displaced, and the image is defocused.
In order to mitigate the wall effects, two methods are applied in this project. First, the unknown wall transfer function is estimated using real data measurements to design the inverse filter. Secondly, FIR Wiener filter is designed to improve the received m-sequence. After all, each method is tested using three parameters, the signal to noise ratio (SNR), the signal to clutter ratio (SCR), and the relative position error (RPE).
The inverse filter can eliminate the wall effects very well; it could correct not only the position of the target but also the image defocus. The new method can give improve the image quality and that can extend the use of UWB radar in many applications.
Table of contents
Abstract ... i
Table of contents ... iii
Table of Figures ... v
1 Introduction ... 1
1.1 Background:... 1
1.2 Ultra-Wideband Radar: ... 1
1.3 Motivation and Aim: ... 2
1.4 State of the Art:... 4
1.5 Structure of the project: ... 5
2 Theory: ... 6
2.1 M-sequence Ultra-Wideband Radar: ... 6
2.2 Wall Compensation Method: ... 8
2.2.1 Inverse filtering: ... 8
2.2.2 FIR Wiener Filter: ... 10
2.3 Figure of Merit: ... 10
3 Method ... 12
3.1 Experimental Process Steps: ... 12
3.2 Data Collection: ... 14
3.2.1 Time Domain Measurements: ... 15
3.2.2 Frequency Domain Measurements: ... 16
3.3 Filter Design: ... 17
3.3.1 Time Zero Estimation: ... 17
3.3.2 Crosstalk Removing: ... 18
3.3.3 Filtering: ... 18
4 Results and Discussion: ... 20 5 Conclusion and Future work: ... 27 References ... 28
Table of Figures
Figure 1. ReTWis radar used for rescue mission ... 2
Figure 2. The measurement system using the VNA and the oscilloscope ... 3
Figure 3 M-sequence generator with 7 shift registers ... 6
Figure 4 Ideal m-sequence, Received signal, and the cross correlation. ... 7
Figure 5 The UWB radar block diagram ... 8
Figure 6 Illustrative example for UWB signal model ... 9
Figure 7 Wiener Filter block diagram ... 10
Figure 8 The cross correlation pulse ... 11
Figure 9 Radar Setup, a)without wall, b)with the wall ... 13
Figure 10 Through setup, a)without wall, b)with the wall ... 13
Figure 11 Project method flow chart ... 15
Figure 12 Time domain measurement setup ... 16
Figure 13 A wall for reference frequency measurements ... 17
Figure 14 Time zero estimation ... 18
Figure 15 The target measurements ... 19
Figure 16 The thought setup ... 20
Figure 17 The radar setup ... 21
Figure 18 Reference Measurements ... 21
Figure 19 The cross talk after time adjustment ... 22
Figure 20 Target after removing the cross talk ... 23
Figure 21 Target position error ... 23
Figure 22 The system function of the wall 1) Magnitude, 2) Phase ... 24
1 Introduction
1.1
Background:
This thesis is a joined project between Radarbolaget AB and University of Gävle, Radarbolaget AB provides radar solution for industrial application like metal factory and wood industry. Using Ultra-wide band (UWB) radar and signal processing techniques enables Radarbolaget to measure metal in furnace where the temperature can reach up to 1200 ̊C.
The accuracy of the existing radar images is affected by many factors. One of the main impacts is when the signal is traveling through the wall to reach the target. Our main focus in this project is to overcome those effects. This will provide more reliable measurements, increase the accuracy of the readings, and improve the image resolution.
Real measurements with the actual radar are used on this project to design the proper filter, and test the filter performance after canceling the wall effects. The calibration process is done by using the wall characterization model, and by considering the wall as a linear invertible system, the wall effects can be inversed to retrieve the object image quality.
Ultra-wide band radar is used in many industrial applications. If a roller mill in a metal factory crashes, it needs at least two days to cool down in order that the technical can fix it. Using through the wall radar imaging will enable identifying the problem and save a lot of time. UWB is also used in rescue missions to detect victims trapped under rubble. In this kind of application the accuracy is very important factor, and it is very important to identify the position of target very accurately, but due to attenuation, refraction, diffraction, and signal speed variation because of signal passing through different material, this can cause a false targets position and image defocusing problems.
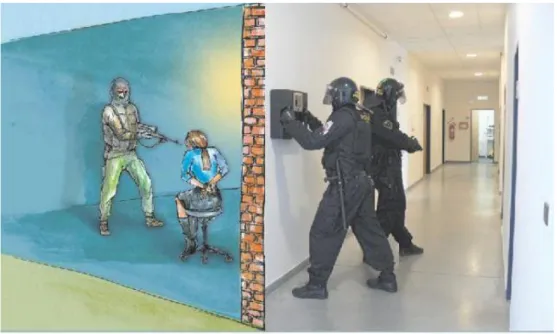
monitor patient heart beats and the movement of the thorax non-invasively [2]. In paper [3] M-sequence ultra-wideband radar, used to find trapped people under rubble from their breathing which can be used very efficient in the rescue missions. [4] Proposed the usage of UWB radar in the security screening, because of the capability of penetrating, high resolution images and no health safety issues, Figure 1 shows an example of the possible application for UWB radar, to identify a target behind a wall in a rescue missions.
Figure 1. ReTWis radar used for rescue mission
Ultra-wideband radar fractional bandwidth can reach in some application to 200%, which will result on high spatial resolution, and a frequency range between 1 to 20 GHz provide the system with a good penetrating capability, considering the power limitation specified by the Federal Communications Commission (FCC) [5], those properties lead to a high range resolution and a huge range of important application as it was mentioned before.
1.3 Motivation and Aim:
To be able to describe the objective of the project, two main outputs should be fulfilled. The industrial outcome which concerns Radarbolaget is to overcome the effects of an obstacle in the through-the-wall imaging radar (TWIR) measurements. The scientifically outcome designed to study different filtering methods, and to compare them to achieve a better signal considering specific figure of merits.
In this project we are mainly focusing on measuring a metal object behind a wall. The accuracy of the measurements is a very important factor because any changes on the metal object needs to be monitored and registered. With the wall between the target and the radar we need a way to subtract the wall effects, i.e. the radar system need to be calibrated to suppress all the unwanted effects e.g. the antenna effects, and the signal attenuation. In paper [6] the limitations of using UWB radar in detecting people behind walls were investigated. The study showed that the wall has a low-pass filter effect, and that can limit the resolution and decrease the effective range for the radar. [7] Studied the relative position error in UWB radar after placing a wall between the target and the radar system, for line of sight the error was 6 cm and increases to 24, 38 and 84 cm for a material (sheet rock, plaster, and cinder block). The position error increased after placing the material, different materials will cause different position error.
Figure 2 shows the measurement setup used in this project. Both time domain measurement using the oscilloscope and frequency domain measurement using the vector network analyzer are carried out to design the transfer function that describes the effects caused by the wall, and then compensates for those effects using the inverse filtering.
1.4 State of the Art:
Several studies have been focusing on the subject of radar calibration for TWI measurements. Because of the complexity and variety of the wall material, it is difficult to have a mathematical modelthat can describe the wall effects. Many approaches have been focusing on measuring the dielectric constant of the wall material using real measurements. The transfer function of the wall is estimated by using both time and frequency domain measurements to numerically solve the dielectric constant for each material under test in [8], and also the loss tangent, then compare the measured value with the lecture values. The comparison gives a good approximation in the real part of the dielectric constant (ɛ`), but for the imaginary part (ɛ″) it gives less accurate results. A root-searching process is used in [9] to find the dielectric constant and the loss tangent based on both the time difference of arrival (TDOA) and the measured transmission coefficient. However, in both [8] and [9] the dielectric constant of the material is studied by using the wall transfer function. In our project we used the wall transfer function to design the inverse transfer function. The same technique of measuring the wall transfer function is used in our project, together with the timed domain measurements.
In [10], a new approach to locate a target behind unknown wall is suggested to use the dielectric constant and wall thickness to compensate for the target location shifting, by using transmitter and receiver arrays in two different arrays. The change of the target’s position after each structure will draw a path. Then by using the intersection of the paths, the correct target position was possible to be detected. M. Amin in [11] investigates in increasing the effectiveness and accuracy of the measurements system, using a cost effective aperture synthesis scheme. Even though the method in [10] could compensate for the position error, but still the signal to noise ratio and the signal to clutter ratio had no improvement.
A wall compensation technique is introduced in [12], where the wall transfer function is estimated using frequency measurements on the free space, and then with the wall existence, the transfer function contains both magnitude and phase information which give more correct compensation method using the inverse filtering. This method has been used in the project, by modifying the measuring setup to use both the through and the radar set, with both frequency and time domain measurements to compare the results.
Three compensation methods tested in [13], first by taking constant amplitude compensation and delay compensation depending on a reference measurement, where it assumes that there is no frequency dependence. Another method is to remove the wall frequency effects by dividing the total transfer function to the transfer function of the wall. Finally, a data fitting method is applied as a tradeoff between the two methods, a constant time delay is applied, the amplitude and phase correction is applied from the insertion function of the wall.
1.5 Structure of the project:
In Chapter 2, theory behind the m-sequence UWB radar is explained; the type of transmitted signal and its advantage of other types of signals are described, a simplified explanation for the radar component is presented, all the preprocessing required steps are shown, furthermore the state of the art of wall compensation methods is described, and the figure of merit to validate the results are presented. Chapter 3 describes the obtained methods for the filter design, and shows the designed measurements setup done for the filter design and the target measurements. In Chapter 4 the results are presented and a comparison table between the methods is done. Finally, a conclusion and possible extension of the project is proposed in Chapter 5.
2 Theory:
2.1 M-sequence Ultra-Wideband Radar:
The ultra-wideband radar covers a wide bandwidth, because the large bandwidth random noise source will affects the UWB systems, and error handling is a critical task on these systems. The transmitted signal plays a main role regarding the error handling. Two main types of signal were used before, the sine wave technique and the impulse technique [14].
The sine wave technique is to use a sine wave and change the frequency of the wave to sweep the frequency band. This technique is approached using vector network analyzer (VNA) and stepped frequency radar. The advantages of this way are; high noise rejection, narrow band filter used to filter the intermodulation products, and low crest factor signal. The disadvantages are; high cost due to the use of VNA, very complex, and difficult to integrate. The impulse technique transmits a short pulse, undersampling is used for data gathering. The advantage using this approach is; low coast. The disadvantages are; high voltage signal and the controller of the sampling time [14].
M-sequence technique is similar to the impulse technique, but by using a pseudo-random binary sequence, it is a periodic signal with a large bandwidth, low hardware cost, still using under sampling. Figure 3 is an example of the M-sequence generator where N=7. The number of the generator shift register ‘n’ is given by (1) [15].
𝑛 = 2𝑁− 1 (1)
Figure 3 M-sequence generator with 7 shift registers
The transmitter is transmitting periodically the m-sequence, where in the receiver side correlate the received signal with the ideal m-sequence. In the ideal case when the transmitter is directly connected to the receiver, the correlation is a one short pulse with t0 shift from the zero, where t0 is the time shift between the transmitter and the receiver. Figure 4 is an
example for a 511 chip ideal M-sequence, in 4b the received signal from a wideband antenna a delayed and noisy version of the m-sequence, 4c is the cross correlation between the ideal m-sequence and the received m-sequence. The autocorrelation maximum amplitude is 2𝑁−
1, so by increasing the chip’s number that will increase the correlation gain.
Figure 4 Ideal m-sequence, Received signal, and the cross correlation.
The block diagram of the basic M-sequence UWB radar in Figure 5. The master clock is feed to the binary sequence generator and the sampling block. Then n chips generated according to the number of shift registered, in this case 511 chips from 9 shift register. The M-sequence is then transmitted periodically through a wideband antenna. The reflected signals from the target is captured and undersampled using a track and hold circuit (T&H) or by using sampling and hold, then converted to digital signal by the ADC using the RF clock to synchronize the sampling [14].
Figure 5 The UWB radar block diagram [15]
M. Kmec in [16] presents an overview over the improvement on this design. Because some sensor applications need to specify operational band, extended M-sequence approach presented.
2.2 Wall Compensation Method:
In our case the target is located behind a wall, and that creates the need to filter the wall effects on the signal, to accomplish this object two approaches discussed and tested in this project. The inverse filtering and the FIR filter.
2.2.1
Inverse filtering:The reflected signal from the defined target 𝑓𝑟(𝑡) can be presented in (2), considering the wall
as a linear invertible system.
𝑓𝑟(𝑡) = 𝑑(𝑡) + 𝑆𝑟(𝑡) + 𝑐(𝑡) + 𝑛(𝑡) (2)
Where 𝑑(𝑡) is the signal reflected from the wall front and back surfaces, 𝑆𝑟(𝑡) is the signal reflected from the target, 𝑐(𝑡) is the clutter signal, 𝑛(𝑡) is the noise signal [12], the reflected signal from the wall and the reflected signal from the target illustrated in Figure 6.
Figure 6 Illustrative example for UWB signal model
A system model for 𝑆𝑟(𝑡) can presented in (3),
𝑆𝑟(𝑡) = 𝑆(𝑡) ∗ 𝑤(𝑡) ∗ 𝑝(𝑡) ∗ 𝑤(𝑡) (3) The incident wave 𝑆(𝑡) is from the transmitter, 𝑤(𝑡) is the wall impulse response, and 𝑝(𝑡) is the impulse response of the target. The target 𝑃 is located at, 𝑥⃗⃗⃗⃗ = (𝑥𝑝 𝑝, 𝑦𝑝), where 𝑥𝑝and 𝑦𝑝 are the target coordinate, so the impulse response of the target can be presented in (4),
ℎ(𝑡) = 𝑤(𝑡) ∗ 𝑤(𝑡) (4)
The propagation delay is 𝑡𝑝, and it is twice the distance between the target and the radar
divided by the speed of light. Here we assume that the wave travel in the wall with the same speed of light. The target signal equation is obtained by (3) and (4).
𝑆𝑟(𝑡) = 𝑎(𝑥⃗⃗⃗⃗ )𝛿(𝑡 − 𝑡𝑝 𝑝) ∗ ℎ(𝑡) (5)
In (5) the ℎ(𝑡) is the system function for the wall. The signal reflected from the target is a convolution between the system function and the echo signal without the wall effects. After applying the inverse system it will compensate for the wall effects, considering that the wall transfer function as a convertible system.
𝑆𝑛𝑦_𝑟(𝑡) = 𝑎(𝑥⃗⃗⃗⃗ )𝛿(𝑡 − 𝑡𝑝 𝑝) ∗ ℎ(𝑡) ∗ ℎ−1(𝑡) = 𝑎(𝑥⃗⃗⃗⃗ )𝛿(𝑡 − 𝑡𝑝 𝑝) (6) The final equation 𝑆𝑛𝑦_𝑟(𝑡) showed that by applying the inverse system function can mitigate
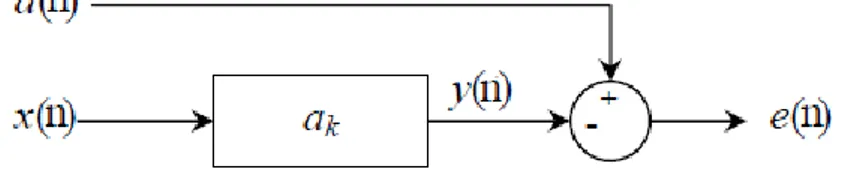
2.2.2
FIR Wiener Filter:The finite impulse response filter can be used for the wall compensation purpose, using the autocorrelations 𝑟𝑑(𝑘), 𝑟𝑑(𝑘),where 𝑥(𝑛) is the desired signal, the related signal 𝑥(𝑛), and the
cross correlation 𝑟𝑑𝑥(𝑘). The order of the filter P can be calculated using the Winner filter parameter [17], Figure 7 show a block diagram for the Wiener filter process which estimate the 𝑒(𝑛) in which the mean-square error is minimized.
Figure 7 Wiener Filter block diagram
𝑹𝑥𝒘 = 𝑟𝑑𝑥 (7)
Eq. (7) express the Wiener-Hopf equation in the vector form can be present in matrix form Eq. (8) [ 𝑟𝑥(0) 𝑟𝑥∗(1) 𝑟𝑥(1) 𝑟𝑥(0) 𝑟𝑥∗(2) ⋯ 𝑟𝑥∗(1) ⋯ 𝑟𝑥∗(𝑝 − 1) 𝑟𝑥∗(𝑝 − 2) 𝑟𝑥(2) 𝑟𝑥(1) ⋮ ⋮ 𝑟𝑥(0) ⋯ ⋮ ⋱ 𝑟𝑥∗(𝑝 − 3) ⋮ 𝑟𝑥(𝑝 − 1) 𝑟𝑥(𝑝 − 2) 𝑟𝑥(𝑝 − 3) ⋯ 𝑟𝑥(0) ][ 𝑤(0) 𝑤(1) 𝑤(2) ⋮ 𝑤(𝑝 − 1)] = [ 𝑟𝑑𝑥(0) 𝑟𝑥𝑑𝑥(1) 𝑟𝑑𝑥(2) ⋮ 𝑟𝑑𝑥(𝑝 − 1) ] (8)
The purpose is to assign the filter parameter values in order for the output error is minimized where 𝑒(𝑛) = 𝑑(𝑛) − 𝑦(𝑛), the 𝑦(𝑛)is the output of the filter.
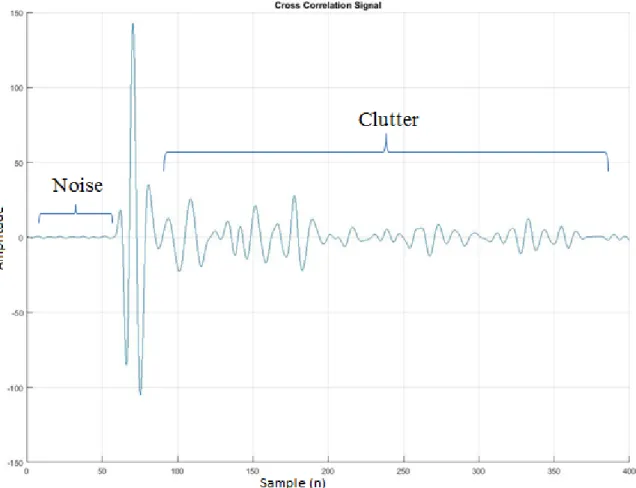
2.3 Figure of Merit:
Three main parameters introduced to measure and compare the filtering methods applied to the received signal: the signal to noise ratio (SNR) is the energy ratio between the signal region showed in Figure 8, i.e. the main pulse of the target, and the noise region is the region between the target and the radar, i.e. the noise occurs before the main pulse. The signal to clutter ratio (SCR), is the energy ration between the main target pulse, and the clutter that occursafter the main pulse, the SCR can be calculated by two ways, either by calculating the average power of the clutter region and divided by the power concentrated on the main pulse, or by using the radar equation. To use the radar equation the clutter have to be random for each pulse, and has Gaussian probability distribution, For this project the first technique will be used.
Figure 8 The cross correlation pulse
The relative position error (RPE) is to measure the position shift for each measured target before and after the wall existence [15]. A small amount of RPE and a large amount on the SNR and the SCR is desired in the filter verification process.
3 Method
This chapter will give an insight into the method used through the measurement process, and the filtering process aimed to increase the efficacy of the radar. A good understating of the medium disruption needed, furthermore if a channel model can be generated before the actual measurements that can help with the filter design, which can overcome the channel effects and decrease those effects.
The methodology in this project has three main components: setup the measurement instruments in both time domain and frequency domain measurement, design the proper filter using those measurements, and evaluate each filter design model according to the specific figure of merit.
3.1 Experimental Process Steps:
The wall transfer function is measured using two frequency domain signals, dividing the signal measured with the wall presence by the free space signal will result the transfer function.
The measurements can be performed in either the frequency domain using the vector network analyzer, or in time domain using the oscilloscope. The radar setup or the through setup can be used to estimate the wall transfer function, in Figure 9-a and 9-b explain the radar setup with and without the wall presence, Figure 10-a and 10-b illustrates the through setup. The wall width in 10-b is double the wall width in 9-d, because the signal in the radar setup will pass the same wall twice because of the reflection from the metal plate.
chosen to locate the wall in the far filed effect of each antenna. The wall under the test is in the form of a slab of bricks with 𝑑1= 7.5 𝑐𝑚 thickness.
3.2 Data Collection:
This section will explain the steps of collecting the necessary measurements for the filter design, both time domain and frequency domain setup, Figure 11 shows a flow chart for the process of data collecting and signal preprocess to evaluate the new signal after the filtering. Free space measurements and the wall measurements must be done in an identical environment condition. All the measurements are done using the same instrument in the same environment to ensure the accuracy. In the ideal situation the free space and through-the-wall measurements has to be done in an anechoic chamber in order to prevent any reflection and multipath signal from the ceiling and the floor. In addition, the sample under study must be as large as possible to avoid edge effects. However, applying those requirements is difficult to follow while the wall under test dimensions is quite large, in this case, using time gating can overcome those effects.
The antenna used is ultra-wide band horn antenna PowerLOG-70180. The frequency range is between 700 MHz to 18 GHz. This type of antenna can be used for very accurate Electromagnetic compatibility (EMC) measurements, where the gain is up to 17 dBi. Following the antenna ultra-broadband amplifier PSPL5828A placed to increase the gain of the signal in both the transmitter and the receiver side, the gain is 10 dB in a wide frequency range from 50kHz to 14 GHz.
Figure 11 Project method flow chart
3.2.1
Time Domain Measurements:In the time domain setup, an M-sequence generator which generates a continuous pulse sequence of pulses repeated periodically. The duration of the pulse is very short. The M-sequence generator is connected to the wideband amplifier to increase the transmitted signal power through a fiber cable to insure low loss in the cable side, then to the wideband antenna. In the receiver side an Agilent oscilloscope is used to connect the receiver antenna after the amplification stage. A trigger is used from the M-sequence generator to the oscilloscope to synchronize the pulses. Figure 12 illustrates the connection of the time domain measurements.
Figure 12 Time domain measurement setup
The calibration process is important for these measurements. In the time domain measurements the receiver can suffer from wideband noise, also the thermal noise can accrue from the measurements instrument. This appears in the form of random pulse. In order to overcome this effect multiple signals averaging is done in the oscilloscope.
3.2.2
Frequency Domain Measurements:This setup is similar to the time domain setup, but instead of the oscilloscope we used Rohde & Schwarz ZNB 8 Vector network analysis, and the transmitter is sending continues sine wave using frequency stepping to sweep over the frequency range 500 MHz to 4 GHz. The sweep time is 1.75 s. The means delay is 800 µs. 1000 point is measured in the frequency band. The advantage of using the frequency domain measurements is the larger dynamic range. Each measured point results on both magnitude and phase information. The same transmitter and receiver are used for this setup to have an accurate compression between the models.
Figure 13 illustrates the actual connection for this setup. The cables connecting the antennas are quit long 2m, which can cause phase distortion, and a high attenuation. The error in the phase is caused also because the long propagation path. By using the frequency stepping instead of the frequency sweep this problem can be overcome. It is also important to calculate the time delay needed for the signal to travel from the transmitter to the receiver side, so each step will be separated from the next step by this time constant to avoid the phase error, and a precise calibration to the VNA have to be done to avoid signal loss due to the long cable used.
Figure 13 A wall for reference frequency measurements
3.3 Filter Design:
The signals preprocess steps, and the filter design techniques will be discussed in this section. Some of the unwanted effects can be removed by calibration. Time zero estimation, and crosstalk removing are two main methods used to remove unwanted effects.
3.3.1
Time Zero Estimation:After the cross correlation between the ideal m-sequence and the received signal, the correlation need to be corrected and shifted by a specific amount of sample 𝜏(𝑘). The time zero is the specific time where the transmitter begins to transmit the first chip of the m-sequence [15] Figure 14. 𝜏(𝑘) is depending on the cable length and the propagation path mostly. To find the time zero there are many methods, the method used here is by identify the cross talk, and because we know the geometric distance between the antennas 𝑑𝑇𝑋 𝑅𝑋, the time is calculated using (9), where c is the speed of light in air.
𝑡𝑇𝑋 𝑅𝑋 = 𝑑𝑇𝑋 𝑅𝑋/𝑐
Figure 14 Time zero estimation
3.3.2
Crosstalk Removing:After finding the time zero, the antenna cross talk pulse can be removed, which accrue because the coupling between the transmitter and the receiver in the radar mode only. The cross talk is the first large peak in the correlation signal. The cross talk can be measured before the radar setup by placing the transmitter and the receiver in an anechoic chamber room, given that we need to follow the same setup in all the measurements, the cross talk is measured using a reference signal by placing the radar setup facing no obstacle, and then subtracting the correlation with the correction in the actual measurements.
3.3.3
Filtering:This section will explain the five filter models generated from the reference measurements, using both time and frequency domain, as well as in the radar setup and through-the-wall setup, finally the FIR filter.
The inverse filtering method as it was mentioned in Section 2.2.1, that estimates the wall transfer function 𝐻𝑤𝑎𝑙𝑙(𝑗𝑤) is given in (10), from the frequency response when the wall exist
𝐻𝑤𝑎𝑙𝑙(𝑗𝑤) =𝐻𝑤𝑎𝑙𝑙−𝑎𝑖𝑟(𝑗𝑤) 𝐻𝑎𝑖𝑟(𝑗𝑤)
(10)
The inverse system is simply multiplying the 𝐻𝑤𝑎𝑙𝑙−1 (𝑗𝑤) to the measured target signal to mitigate the wall effects. This method can be approached by using the time domain measurements equation 11
𝐻𝑤𝑎𝑙𝑙(𝑗𝑤) =𝐹𝐹𝑇(𝑣𝑤𝑎𝑙𝑙−𝑎𝑖𝑟(𝑡)) 𝐹𝐹𝑇(𝑣𝑎𝑖𝑟(𝑡))
(11)
Where 𝑣𝑎𝑖𝑟(𝑡), is the time domain m-sequence received using fast Fourier transformation that converts the time domain signal to the frequency domain. Caution must be taken when doing those measurements, because it is important to keep the same experiment setup when doing the wall-air and air setup, for both the radar and the through setup.
3.4 Design Verification
Each filter will be implemented to multiple target measurements, next the results will be compared to evaluate the designs and compare the target signal after filtering. The targets are placed in three different positions 50, 80, and 120 cm from the wall interface. The distance between the wall and the radar is set to 100 cm. The distance between the transmitter and the receiver antenna is 53 cm. in Figure 15 is the actual measurement setup.
4 Results and Discussion:
In this chapter the results for the filter design and the evaluation process is presented, but before that, the signals used for the filter design are explained below:
The ideal M-sequence
This signal is the M-sequence generated from the radar unit. The transmitter connected to the receiver directly, no propagation path between. The purposes of this signal is for the FIR filter reference, because this can consider as the desired signal in the filter equation, and this signal is used for the cross correlation with the received signals.
Through-Free Space
This is the signal measured when setting the transmitter and the receiver in front of each other with no wall between them. This signal is used to create the inverse filter in the through setup Figure 16.1.
Through-Wall
This is the signal measured when using the through setup and the double wall thickness is between the receiver and the transmitter. This signal is used to create the inverse filter in the through setup Figure 16.2.
Figure 16 The thought setup
Radar-Free Space
This is the signal measured when setting the antennas in the radar setup, and no wall is facing the radar. This will return the cross talk signal and the unwanted reflection from the ceiling and the floor. Figure 17.1 illustrate this setup.
Radar-Wall
Applying the same setting the radar-free space setup, but now placing the wall facing the radar antennas, to use it when subtracting the cross talk effect and other unwanted reflection, Figure 17.2
Figure 17 The radar setup
Radar-Free Space-Plate
This setup is done by using the radar setup and placing a metal plate in front of the radar. To reflect the transmitted signal, this signal is used when designing the inverse filter. Considering it as a reference signal, the signal travels in the free space and reaches the metal plate, and approximately it is totally reflected when hitting the metal plate, and the reflection will be absorbed by the receiver. Figure 18.1.
Radar-Wall-Plate
Placing the wall between the radar and the plate, the signal will travel through the free space hitting the wall, penetrates the wall to hit the metal plate and reflect to the receiver. The purpose from measuring this signal is for the inverse filter design, Figure 18.2.
all four must have the same effects. The received signal is always cross correlated to the ideal m-sequence. The cross correlation shows the similarity between the two signals. Each pulse in the cross correlation is indicated a possible target, or a reflection from unwanted object.
The first step of processing the measured data is the signal preprocessing; time zero estimation, cross talk removing, and subtracting the reference signal to remove the unwanted reflections. Using the technique explained in the theory Section 3.2.1 to detect the signal starting point. Figure 19 shows the signal before shifting to the time zero point.
Figure 19 The cross talk after time adjustment
The cross talk is removed by subtracting the reference signal (Radar-Free Space, Radar-Wall) from the target measurements. After the subtraction the signal is ready for the filtering. Figure 20 shows the three targets signal after removing the cross talk. The red, blue and black signal is the target located at 92, 110, and 127 cm from radar antennas. The dotted line is the reflection from the plate.
Figure 20 Target after removing the cross talk
The target signal in Figure 20 is showing a clear pulse with low level of noise, because no obstacles is placed between the radar and the target itself, after placing the wall between. The target is shifted in place and the amplitude of the reflected signal from the target is attenuated, Figure 21 compares each target signal before and after placing the wall.
Figure 21 Target position error
The inverse filter is designed using the radar-wall and radar-free space measurements. The system function of the wall is given by the division of the frequency response function for the wall over the free space. Figure 22.1 shows the magnitude-frequency transfer function of the wall. Figure 22.2 is the phase of the frequency function. Both magnitude and phase information are used in the invers filtering.
Figure 22 The system function of the wall 1) Magnitude, 2) Phase
It was noted that the wall transfer function is similar for the four models, which follows the theoretical concept, because the same steps are used in the measurements, the radar and the through measurements were taken in the same set and the same experimental instrument.
After implanting the filter model to the target signal, and testing the four models generated from the different setup combination, Figure 23 show the target signal after and before the filtering. The signal plotted here is after the Hilbert transformation, the red line is presenting the signal output of the filter, the blue line is the reference signal measured without the wall present, and the green line is the input of the filter. The signal after filtering contains less noise and less clutter comparing to the signal before, each of the three targets shows the same behavior.
In Table 1 a comparison between the proposed methods is presented, for each model the improvement percentage of the SNR, SCR, and PRE is calculated considering the free space signal as a references signal and the improvement is the difference between the input and the output, the values are calculated by averaging the improvements on the three targets. Model 1 is generated from the radar setup by using the time domain filter estimation, model 2 used the radar setup with the frequency domain filter estimation, in model 3 we used the through-the-wall setup and the time domain measurements, model 4 the through setup with the frequency
domain filter estimation, and model 5 is by using the FIR filter design method, the order of the filter P=50 result on the minimum error is the optimal order for the filter. The table below shows that model 2 has the largest amount of improvement in all the figure of merits, the models generated by the inverse filtering (model 1, 2, 3, and 4) provide approximately 6 dB improvement in the signal to noise ratio, moreover 7.5 dB in the signal to clutter ratio. The inverse filtering has better improvement from the FIR filter, as shown in the table, where in model 5 the SNR difference is +3 dB, and the SCR is 2.5 dB.
The results in the table below shows that by using the inverse filter technique we can have better SNR, SCR, and RPE for this type of wall. The inverse filter can be used for the calibration method to enhance the output signal and overcome the wall effects on the concrete wall.
Figure 23 Target 2 after filtering comparisons time domain inverse filtering
Table 1 Model Comparison
Model 1 Model 2 Model 3 Model 4 Model 5
SNR (dB) 6.2 6.9 5.7 6.3 3 SCR (dB) 8.1 7.5 8.6 7.1 2.5 RPE (%) 3.5 2.1 4.1 3.3 1.2
5 Conclusion and Future work:
UWB signal suffers from phase and amplitude attenuation when penetrating an obstacle. This project aimed to improve the performance of through the wall radar imaging, by designing a calibration method to overcome the effects of a wall using real reference measurements for the wall.
In order to enhance the received signal quality by the radar system, first the radar system effect has been removed i.e. the cross talk, the transmitter, the receiver antenna effect, then a set of reference measurements are achieved to design five filters models. The model has been tested on a multiple known target, and finally we did a comparison between the target signal before and after the filtering to compare the enhancement level for each model.
A set of frequency and time domain measurements were carried out to estimate the wall transfer function by considering the wall a linear invertible system. The measurements aimed to measure the wall frequency response by two different setup, the radar setup and the TWI setup, that produces four frequency responses to the wall. The frequency responses are used for designing the inverse filter to compensate the phase distortion and the magnitude attenuation. The fifth model is designed using the FIR wiener filter method.
The result shows that the filter can compensate the wall effects and also the position error caused by the wall, i.e. the image after applying the filtering process appear with a higher focus comparing the image without the compensation method. The filter that is generated from the wall transfer function inverse filtering has a higher SCR improvement, and also a lower relative position error than the other filters.
Although this project covered the use of inverse filtering to compensate the wall effects in UWB radar, it could be further developed by testing other wall material and in different temperature or moisture. For the purpose of testing the possibility of using this method in all
References
[1] W. Lai and C. Poon, “Applications of Nondestructive Evaluation Techniques in Concrete Inspection”, HKIE Transactions, vol. 19, no. 4, 2012, pp. 34--41.
[2] F. Thiel, M. A. Hein, U. Schwarz, J. Sachs, T. Lindel, and F. Seifert, "Exploring the benefits of ultra-wideband radar for high- and ultra-high field magnetic resonance imaging," in the 39th European Microwave, Italy: EuMA, 2009, pp. 866–870. [3] E. Zaikov , J. Sachs , M. Aftanas and J. Rovnakova, "Detection of trapped people by
UWB radar",German Microw. Conf., pp. 240-243, 2008
[4] L. Carrer and A. G. Yarovoy, "Concealed weapon detection using UWB 3-D radar imaging and automatic target recognition," in The 8th European Conference on
Antennas and Propagation, The Hague: IEEE, 2011, pp. 2786–2790.
[5] R. Zetik, J. Sachs, and R. S. Thoma, "UWB short-range radar sensing - The
architecture of a baseband, pseudo-noise UWB radar sensor," IEEE Instrumentation &
Measurement Magazine, vol. 10, no. 2, pp. 39–45, May 2007.
[6] A. M. Attiya, A. Bayram, A. Safaai-Jazi, and S. M. Riad, "UWB applications for through-wall detection," in Antennas and Propagation Society International
Symposium, IEEE, 2004, vol. 3, pp. 3079–3082.
[7] C. Gentile and A. Kik, "A Comprehensive Evaluation of Indoor Ranging Using Ultra-Wideband Technology," Wireless Communications and Networking, pp. 1–10, Apr. 2007.
[8] A. Muqaibel, S. M. Riad, A. M. Attiya, A. Bayram, and A. Safaai-Jazi,
"Ultrawideband through-the-wall propagation," IEE Proceedings - Microwaves,
Antennas and Propagation, vol. 152, no. 6, pp. 581–588, Sep. 2005.
[9] O. Büyüköztürk, T.-Y. Yu, and J. Alberto Ortega, "A methodology for determining complex permittivity of construction materials based on transmission-only coherent, wide-bandwidth free-space measurements," Cement and Concrete Composites, vol. 28, no. 4, pp. 349–359, Apr. 2006.
[10] G. Wang, M. G. Amin, and Y. Zhang, "New approach for target locations in the presence of wall ambiguities," IEEE Transactions on Aerospace and Electronic
Systems, vol. 42, no. 1, pp. 301–315, Jan. 2006.
[11] F. Ahmad, M. G. Amin, and S. A. Kassam, "Synthetic aperture beamformer for imaging through a dielectric wall," IEEE Transactions on Aerospace and Electronic
Systems, vol. 41, no. 1, pp. 271–283, Jan. 2005.
[12] L. Kong, G. Cui, J. Yang, and X. Wang, "A new wall compensation algorithm for through-the-wall radar imaging," 2008 IEEE Radar Conference, May 2008.
[13] N. M. Iya, A. H. Muqaibel, and U. M. Johar, "Ultra wideband wall compensation for through-wall tracking and imaging," 2011 IEEE International Conference on
Ultra-Wideband (ICUWB), Sep. 2011.
[14] J. Sachs, "M-sequence ultra-wideband-radar: State of development and
applications,"Proceedings of the International Conference on Radar, pp. 224–229, Sep. 2003.
[15] M. Aftanas, “Through Wall Imaging Using M-sequence UWB Radar System,” Thesis to the dissertation examination, Technical University of Kosice, Department of Electronics and Multimedia Communications, Slovak Republic, Feb. 2008. [16] M. Kmec, R. Herrmann, J. Sachs, and P. Peyerl, "A familly of M-Sequence based
UWB sensors,"Internationales Wissenschaftliches Kolloquium, vol. 51, Sep. 2006. [17] M. H. Hayes, Statistical digital signal processing and modeling. United States: John


![Figure 5 The UWB radar block diagram [15]](https://thumb-eu.123doks.com/thumbv2/5dokorg/4279417.95172/15.892.157.717.109.360/figure-uwb-radar-block-diagram.webp)