FACULTY OF ENGINEERING AND SUSTAINABLE DEVELOPMENT
Department of Building Engineering, Energy Systems and Sustainability ScienceSaman Abolghasemi Moghaddam
2019
Student thesis, Master degree (one year), 15 HE Energy Systems
Master Programme in Energy Systems Master’s Thesis
Supervisor: Arman Ameen
The effects of low-emissivity window films on thermal
comfort and energy performance of a historic stone building
in cold climate: computer simulations with “IDA ICE”
Preface
I would like to thank my parents for their unlimited support, specially my mother who has always encouraged me to continue studying towards higher education. I would also like to thank my supportive supervisors Mr. Arman Ameen and Mr. Magnus Mattsson who have really helped me to accomplish this project. Finally, I would like to thank all the members of University of Gävle who have given me the opportunity to study here.
Abstract
Low-emissivity (low-E) window films are designed to improve the energy performance of windows and prevent indoor overheating by solar radiation. These films can be applied to different types of glazing units without the need for changing the whole window. This characteristic offers the possibility to improve the energy performance of the window of old and historic buildings for which preservation regulations say windows should remain more or less unchanged. This research aims to figure out to what extent a low-E window film can improve thermal comfort and energy performance of an old three-storey historic stone building in the cold climate of Mid-Sweden. In this research, first, with help of the simulation software “IDA ICE”, the entire building was modelled without window films in a one-year simulation. Second step was to add the low-E window films (3M Thinsulate Climate Control 75 (CC75)) to all the windows and repeat the simulation. Comparison between the results of the two cases revealed an improvement in energy use reduction as well as the thermal comfort when applying the films. For the application of the window films, a cost analysis using payback method was carried out which showed a long- time payback period. Although an investment with a long-time payback period is considered as a disadvantage, for historic buildings with very strict retrofit regulations specially when it comes to the building’s facades, application of the low-emissivity window films for better energy performance and thermal comfort is among the recommendable measures, but not necessarily the best.
Keywords: Low-E window films, low-emissivity film, thermal comfort, low-E materials, solar heat gain, IDA ICE, building energy saving measures, heating demand, cooling demand.
NOMENCLATURE
The symbols that were used in this study are presented here.
Symbol Description Unit
T Temperature K
U- value Value of the thermal
transmittance
W/𝑚2K
G-value Fraction of solar
radiation entering the building
_
VT Visible transmittance _
Table of contents
Contents
1 Introduction ... 7 1.1 Background ... 7 1.2 Literature review ... 7 1.3 Aim ... 11 1.4 Approach ... 11 2 Theory... 122.1 Building Energy Balance ... 12
2.2 Heat Transfer ... 13 2.2.1 Conduction ... 13 2.2.2 Convection ... 13 2.2.3 Radiation ... 13 2.3 U-value ... 14 2.4 G-value... 14 2.5 Visible transmittance ... 14 2.6 Thermal comfort ... 14 2.7 PMV/PPD Model ... 15 2.8 Standard (EN-15251)... 15 2.9 IDA ICE ... 16
2.10 Payback Period Method ... 16
2.11 Discounted payback period (DPP) ... 16
3 Method ... 17
3.1 Study object ... 17
3.2 Procedure ... 17
3.2.1 The building’s model creation on IDA ICE ... 18
3.2.2 Validation of the model of the building ... 22
3.2.3 Application of the window films ... 22
3.2.4 Comparison of the results of case A (without films) and case B (with films) ... 23
3.2.5 Cost analysis using payback period and discounted payback period (DPP) method ... 23
3.3 Problems and limitations of the adopted method ... 24
4 Results ... 25
4.1 Base model simulation results (case A (without window films)) ... 25
4.1.1 Energy Performance... 25
4.1.2 Thermal comfort ... 27
4.2 Base model (case A (without window films)) validation ... 29
4.3 Results of the simulation in the presence of low-E films (case B) ... 29
4.3.1 Energy performance ... 30
4.3.2 Thermal comfort ... 31
4.5 Cost analysis... 37 5 Discussion ... 39 5.1 Energy saving ... 39 5.2 Thermal comfort ... 39 5.3 cost saving ... 40 6 Conclusion ... 41 6.1 Study results ... 41 6.2 Outlook ... 41 6.3 Perspectives ... 42 1 References ... 43 Appendix A ... 1 Appendix B ... 4 Appendix C ... 7 Appendix D ... 11 Appendix E ... 13 Appendix F... 21
1 Introduction
1.1 Background
Nowadays one of the big issues of the world is global warming caused by fossil fuels which are known as the largest energy supply of the globe, hence there is an urgent need for a switch from fossil fuels to renewable sources of energy. Besides this transformation, different energy saving measures should be developed, because the world energy demand can be reduced to a great extent by these measures. “A significant portion of the total primary energy is consumed by today's buildings in developed countries” (Suresh B.Sadineni, 2011)”. “Energy usage in buildings represents about 40% of the total energy usage in Europe” (Bjørn Petter Jelle, 2015). It is reasonable to say that there is a big potential for reducing the energy use of the buildings sector which can lead to less consumption of fossil fuels thereby protecting the environment.
1.2 Literature review
This chapter reviews the collected peer-reviewed journal articles and some other sources. Transparent areas such as windows and skylight glazing in buildings have always attracted designers’ attention since they provide building with natural light, ventilation and beauty. Nowadays, there is a trend in increasing the window areas in buildings due to the fact that modern architecture has embraced transparent areas enlargement as well as the use of glass as curtain wall. Along with the above-mentioned reasons, there is another important reason that has increased the importance of windows in building, and that is the significant role which they play in the energy use of buildings. As it is mentioned before, the amount of energy needed for lighting, cooling and ventilation can be reduced using windows, but at the same time there are some important disadvantages associated with windows that should be taken into consideration.
Larger window areas provide the building with more natural light and natural ventilation resulting in some reduction in the buildings energy usage. It should also be taken into account that sometimes the benefits from sunlight can be penalized by the excessive solar gain through windows (Rongxin Yin, 2012).
Bjørn Petter Jelle (2015) says a large portion of energy in buildings is used to meet the heating and cooling demand. The transparent areas of buildings including windows and skylight glazing are responsible for a substantial part of the energy loss resulting in an increase in buildings’ energy usage.
It can be said that in the summer, high level of heat radiation transferred into the buildings through windows can cause overheating which can lead to an increase in cooling demand. On the other hand, in the winter the radiative heat transferred to the outside of buildings through windows, can increase the heating demand. In both situations the energy consumption of buildings rises which will result in the energy cost growth of buildings and environmental implications.
The reason why windows with typical clear glasses are considered as important sources of heat loss in the winter and heat gain in the summer is that they usually have high U values and SHGC (solar heat gain coefficient). Jong Jun Park (2017) mentions that Although windows provide buildings with light, views and fresh air, they are responsible for about 20 % - 40 % of energy losses in buildings due to their high U-value compared to the other parts of buildings.
A building’s energy usage can be affected by façade-related properties of a glazing system including U-value, G-value, shading, daylight factor and light control (J.W. Lee, 2013). To reduce the heat loss and excessive heat gain through windows, a wide range of methods and techniques have been developed by researchers and companies and it is likely to see even more advanced technologies and methods in near future.
Reducing heat loss through windows is not as easy as reducing heat loss through walls. In order to reduce heat loss through windows, a wide range of methods can be adopted such as the air layer thickness of double-pane windows optimization, evacuating the cavity, coating pane surface with low-emissivity materials, increasing the number of the windows’ panes, filling the cavity between panes with an inert gas or adopting some these methods simultaneously (Müslüm Arıcı, 2014).
In addition to the above-mentioned methods, installation of blinds can also improve energy performance of buildings.
Application of blinds can contribute to the building’s energy usage reduction in two different ways. Firstly, the blinds reduce the window’s G-value resulting in less solar gain, thereby decreasing the cooling demand. Secondly, the blinds decrease the heat loss through the window resulting in some reduction in U-value of the window, although the effect depends on the slat angle (Karjalainen, 2019).
Sudip Kumar Pal (2015) also mentions some attractive advanced glazing systems including electrochromic (EC) glazing, photovoltaic (PV) integrated glazing, self-cleaning glazing, and vacuum glazing. Many of the above-mentioned methods seem complex and costly, since majority of them cannot be applied to the existing windows or old windows and they require window replacements.
The following paragraphs will focus more on one of the simplest methods of window energy performance improvement which is the application of low-E (low emissivity) materials to the windows. Low-E window films can contribute to the reduction of solar heat gain by reflecting the near-infrared radiation of the sun, thereby reducing the cooling demand in the summer. They can also help to keep the indoor climate warm by blocking and sending back the heat radiation from objects and other sources of heat in the buildings, thereby decreasing the heating demand in the winter.
Figure 1 indicates the Solar energy distribution with respect to wavelength which is drawn form (Bjørn Petter Jelle, 2015).
Bjørn Petter Jelle (2015) has discussed different methods of applying low-e coating to glazing units including hard coatings, soft coatings, self-applicable films and suspended films. The first two of the above-mentioned methods should be adopted and implemented by manufacturers before the installation, but the third method which is self-applicable film can even be implemented after the installation of the windows. It means that this method does not require windows replacement, thereby giving the opportunity to equip windows of old buildings with low-E films that can improve the energy performance of the buildings.
Figure 2 shows an ordinary double-pane window drawn from (Windows, 2015). It is suggested that for a cold climate it is better to apply the low-E coating to the outward-facing surface of the inner pane (surface c), so it can reflect the heat back to the room, thereby reducing the heat loss.
Figure 1. Solar energy distribution with respect to wavelength
There are some factors that can affect the benefits of the use of window films, including the climate in which the building is located which itself decides whether the main focus should be on excessive solar heat prevention or indoor heat loss prevention, seasonal variations, aging of the films and shading caused by outdoor objects, e.g. trees.
Applying a low-E window film without considering the above-mentioned factors may minimize the benefits of low-E films, for instance the value of the energy that is saved by using a low-E window film in the summer, can be less than the value of the heating load that could have been received from the sun in the winter in the absence of low-E films.
There are other important factors that should be taken into account including visible transmittance (VT) and UV radiation. Although the window films protect the building from UV radiation, the amount of sunlight transmitted into the building can be affected by Low-emissivity window films(Penny, 2012).
However low-E films do not transmit visible light as well as a clear glass, they still provide occupants with the desired light.
The same as any other methods, low-E window films can have some drawbacks that should be taken into account, including creation of bubbles on the film in case that film is not installed correctly, reduction in transmission of visible light which results in using more artificial light which rises the electricity demand of the building.
To be able to identify the positive effects of low-E window films on the entire building, one way is to conduct experiments to compare the energy performance of some of the windows in both situations, in the presence and in the absence of window films and then using a building energy simulation software to estimate the impact of the low-E window films on the energy performance of the entire building.
There have been several studies regarding the effects of low-E window films on the energy performance of buildings located in different climates, for instance Rongxin Yin (2012), explains a research regarding the effects of a solar control film (applied to a double-glazing unit) on reducing the annual energy consumption and peak demand load in the summer. It is mentioned that the heat gain through windows can drop by 55% by applying window films to the outward-facing surface of the inner pane comparing to the glazing unit without the films.
The results of a field test carried out to investigate the energy performance of a building’s windows equipped with solar films revealed that the solar heat rejection of the window was 30 % for diffused radiation and 50 % for beam radiation. Finally, it was concluded that solar films under the Hong Kong climate can contribute to a AC energy reduction (Chunying Li, 2015).
It can be concluded that windows are among important contributors to the building heat loss in the winter, because windows usually have higher U values than other parts of a building. Although glazing units provide natural light, ventilation and beauty for the building, they can cause overheating in the summer by transmitting solar heat radiation into the building. In order to develop the energy performance of windows, a wide range of methods from using
because they can be applied to the existing windows without a need to replace them. The effects of some of the low-E window films on the energy performance of the entire building in some locations have been tested by conducting experiments and using simulation software and the results have made researches optimistic about the application of low-E window films.
1.3 Aim
This research has tried to figure out to what extent low-E window films can reduce the heating demand of a building in the winter and to what extend they can prevent overheating in the summer. The main purpose is to estimate the effects of one specific low-E window film named “3M Thinsulate Climate Control 75” on the energy performance and thermal comfort of an old three-storey stone building named “Rådhuset” (the old city hall) located in Gävle. In addition to the energy performance and comfort analysis, a cost analysis has been conducted to evaluate the cost-effectiveness of the window film application to this building.
1.4 Approach
The window films of the above-mentioned type were already applied to some double-pane windows of the studied building and some data regarding the U values and visual light transmittance of the windows in the absence and presence of the window films collected by researchers at University of Gävle. Now the main purpose of this research is to estimate the effects of this type of window film on the energy performance and thermal comfort of the entire building with the help of the simulation software “IDA ICE”.
2 Theory
2.1 Building Energy Balance
Energy is supplied to buildings in different forms to provide them with electricity, space heating, space cooling, hot water etc.
“A building’s energy balance is the relationship between the energy that is supplied to the building and the energy that is lost” (Åberg, 2014).
Figure 3. Energy balance of a building component
Figure 3 derived from Åberg (2014) illustrates the energy supply and energy losses constituting the energy balance of the building. Solar heat gains along with internal heat gains generated by the occupants and appliances contribute to heating the building. Heat can be lost as a result of heat transmission, infiltration and ventilation. Heat transmission losses occur through windows, doors, walls and roof.
2.2 Heat Transfer
Heat can transfer through conduction, convection and radiation. The following sections elaborate on each of them.
2.2.1 Conduction
Conduction is the flow of heat through a material by direct molecular contact. This contact occurs within a material or through two materials in contact (Taghi Karimpanah, 2018).
Eq. 1 Where 𝑞̇ = heat transfer rate (W)
K = thermal conductivity of the material (W/m.K) A = heat transferring area (𝑚2)
ⅆ𝑇ⅆ𝑥 = temperature gradient in the direction of heat flow (K/m)
2.2.2 Convection
Convection is the transfer of heat by the movement or flow of molecules (liquid or gas) with a change in their heat content. This is an important heat transfer mode between fluids and solids, or within fluids (Taghi Karimpanah, 2018).
Eq.2 Where q̇ = heat-transfer rate (W)
𝐴 = heat transferring area (𝑚2)
ℎ𝑐 = convective heat transfer coefficient (W/m2 K) 𝑇𝑤 = temperature of the solid surface (K)
𝑇∝ = temperature of the fluid (K)
2.2.3 Radiation
Radiation is the transfer of heat by electromagnetic waves through a gas or vacuum. Heat transfer by this mode therefore requires a line of sight connection between the surfaces involved (Taghi Karimpanah, 2018).
𝑞̇𝑒𝑚𝑖𝑡𝑡𝑒𝑑 = 𝜎 ×𝐴 × 𝑇4 Eq.3 Where 𝑞̇𝑒𝑚𝑖𝑡𝑡𝑒𝑑 = blackbody emitted radiation (W)
𝐴 = heat transfer area (𝑚2)
σ = 5.6703 10-8 (W/𝑚2𝑘4) - The Stefan-Boltzmann Constant
2.3 U-value
The U-value of a material indicates the amount of heat that can be transferred through one square meter of the material when there is a one degree Celsius difference in temperature across the structure (W/𝑚^2 𝐾)” (WIKIPEDIA, 2019).
2.4 G-value
The G-value which is mostly used in Europe, is the coefficient indicating the fraction of solar radiation passing through the window. Despite having minor differences in modeling standards compared to the SHGC, the two values are effectively the same. The maximum amount of G-value is 1 representing full transmittance of all solar radiation while the minimum G-value is 0.0 representing a window with no solar energy transmittance (WIKIPEDIA, 2019).
2.5 Visible transmittance
Visible transmittance is the fraction of visible light transmitted through a window (Windows, 2015).
Figure 4. Solar visible transmittance
2.6 Thermal comfort
“‘Thermal comfort’ is the term used to describe a satisfactory, stress-free thermal environment in buildings and, therefore, is a socially determined notion defined by norms and expectations” (J. Fergus Nicol, 2017). According to ASHRAE Standard 55-2013, thermal comfort is that condition of mind which expresses satisfaction with the thermal environment and is assessed by subjective evaluation.
2.7 PMV/PPD Model
PMV/PPD model is one the accepted models for determining thermal comfort.
Predicted Mean Vote (PMV):
The PMV model developed by Fanger (1970), is widely accepted and used in standards (ASHRAE 55, 2013; ISO 7730, 2005) and by practitioners to evaluate thermal comfort. It is an index that predicts the value of the mean votes of a large group of persons on the ASHRAE thermal sensation scale (Kabanshi, 2018)
Figure 5 shows ASHRAE thermal sensation scale.
Figure 5. ASHRAE thermal sensation scale
Predicted Percentage Dissatisfied (PPD):
It is an index that predicts the percentage of thermally dissatisfied people (Kabanshi, 2018). The standard ranges for PMV and PPD are as follows:
Comfortable range: -0.5 < PMV < +0.5 Acceptable: PPD < 10%
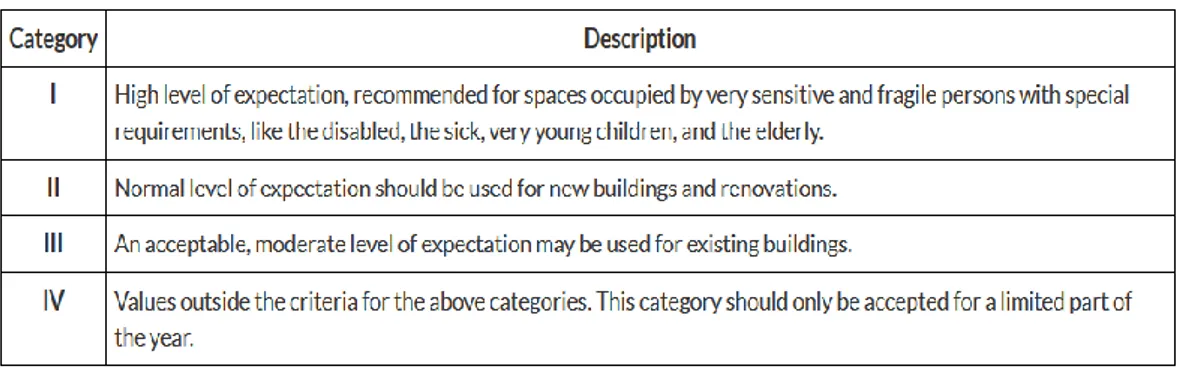
2.8 Standard (EN-15251)
In the area of thermal comfort, the international standards commonly used to evaluate the thermal environments are (ISO7730-2005), (ASHRAE55 2013) and (EN-15251-2007). The EN 15251 standard is used to structure thermal comfort guidelines. This standard uses special quantities including PMV and PPD, which can be computed as a field and visualized in post-processing (Anon., u.d.). The EN-15251 standard gives the opportunity to conduct building energy usage calculations in a way that comfortable and healthy indoor environment is achieved (J. Fergus Nicol, 2011).
More detailed information regarding the EN-15251 standard can be found in Appendix A.
2.9 IDA ICE
Nowadays simulation software is widely used to estimate the energy performance of buildings and HVAC systems. IDA ICE is among the reliable simulation tools which with the help of mathematical models giving the users the opportunity to be aware of the heating and cooling load, thermal comfort and indoor air quality in a building (Arefeh Hesaraki, 2013). IDA ICE 4 was first developed at KTH Royal Institute of Technology and the Swedish Institute of Applied Mathematics, ITM. Validation of this programme was conducted by some studies.
According to the set indoor temperature, the energy balance of the building is calculated using finite difference method, timesteps simulation and transient calculations (Ahmed, 2017)
The main disadvantages of this programme include the risk of unexpected program crashes and errors in mathematical model creation during simulation (Arefeh Hesaraki, 2013).
2.10 Payback Period Method
The payback period is the period of the time that an investor waits for the initial investment to completely return (Kagan, 2019 ). It can be said that the shorter payback period, the more willingness to invest. One limitation of this method is that it does not take the interest rate into consideration.
The following formula shows the calculation of the payback period without considering the interest rate (Robert Kasprowicz, 2015).
Eq. 4
2.11 Discounted payback period (DPP)
The discounted payback period (DPP), which is the period of time required to reach the break-even point based on a net present value (NPV) of the cash flow, considers the time value of money (Calculator.net, 2019).
3 Method
3.1 Study object
In this research the effects of a specific low emissivity window film on the energy performance of a historic building in Gävle called “Rådhuset” has been analysed. The window film that was selected for this building is named “3M Thinsulate Climate Control (CC75)” manufactured by “3M company”. The entire building was modelled with the help of the simulation software IDA ICE 4.8 licensed by “EQUA Simulation company” located in Sweden. This programme offers the possibility to create a 3D model of the building and divide it into different thermodynamic zones and input all the data regarding the construction and energy performance of the building. By using this software there is a possibility to run simulations for different periods of the year. After creation of the model of the building known as the basic model, it is time to validate the model, then the intended changes to the basic model can be made and its results should be compared with the base model. This software offers an option to compare the results of two models, so a simulation preferably for the whole year should be carried out and its results must be compared with the energy bills of the building. For the results of the simulation to be valid, they are usually expected to be maximum 5% deviant from the energy bills. After the validation of the model, the window films can be added to all the glazing units of the building to run a new simulation. Finally, the software offers an option to compare the results from the new simulation with the basic model in order to evaluate the effects of the window films on the energy performance of the building.
3.2 Procedure
Previously a research group at Gävle university (Magnus Mattsson, 2018) sponsored by Swedish Energy Agency, conducted a field test in Rådhuset to measure the U-value and light transmission of his type of window film attached to the outward-facing surface of the inner pane (surface c) of the window of the building (see Figure2). To measure those values, a hot box was created around the window and then all the measurements were carried out and recorded (see Appendix B). In this research study, the input data regarding the window film is based on the results of the above-mentioned field test. To evaluate how the energy performance of the building could be affected due to applying the window films to all the glazing units of the building, first the building in the absence of the window films was modelled with the help of the simulation software IDA ICE 4.8 and called case A. The input data needed to make the model of the building were collected from a group at Gävle university studying this building. To get a more accurate model, during the model creation process, the input data and other parts of the model were compared with an existing model of this building previously created by another group at Gävle university.
The following paragraphs will discuss the most important building’s data imported to the software. The illustrations were captured while the creation of the model was being done.
3.2.1 The building’s model creation on IDA ICE
• Location and climate data
As mentioned before, the building is located in Gävle, therefore, Gävle climate file was chosen for this building.
• Building layout
The following figures depict the floors’ plan together with the orientation of the building. Regarding the opening units in the following figures, the yellow rectangular shows the door and the blue one shows the window.
Figure 6. First floor’s plan and orientation
Figure 8. Third floor’s plan and orientation
• Building’s construction data
Table 1 shows the building’s construction data previously collected by another group at University of Gävle.
Construction Material Thickness
(mm) Thermal conductivity
(W/m.K)
U-value
(W/𝑚2. 𝐾) External walls Render
Brick Render 10 600 10 0.8 0.58 0.8 0.81 Internal walls Render
Brick Render 2 400 2 0.8 0.58 0.8 1.16 Internal floors Wood
Sand Chip board Floor coating 45 250 50 20 0.14 0.33 0.037 0.18 0.37 External floors Floor coating
Concrete 5 250 0.18 1.7 2.9 Roof Wood Sand Chip board Floor coating Brick Light insulation 45 250 50 20 100 50 0.14 0.33 0.037 0.18 0.58 0.036 0.23 Basement wall
towards ground Render Concrete 10 200 0.8 1.7 3.3
• Thermal bridges
The first four rows in Figure 9 was measured by a group at University of Gävle, but for the rest, it was tried to estimate the values and no measurements were conducted.
Figure 9. All the thermal bridges
• Description of the HVAC system
The HVAC system was modelled by a standard air handling unit. The air handling unit is a constant air volume system (CAV) for which the supply air and return air is 1.3 L/𝑠. 𝑚2.
• Internal temperatures and infiltration rate
According to the data collected from the report of a group at university of Gävle, the indoor temperature was adjusted between 21°C and 23°C. Regarding the infiltration rate, the wind driven flow method on IDA ICE was chosen. The results of the measurements previously carried out with the help of a blower door, shows the air
• Internal heat gain and occupancy
All the detailed information regarding the lighting system, number of occupants in each zone, the equipment and radiators in each zone along with their operation schedule can be found in Appendix C. Totally 59 occupants with 59 units for equipment (each unit with the power of 125W) was considered. The activity level for each person was 1.2 metabolic equivalent (MET), and operation schedule was adjusted between 6:00 and 18:00 on weekdays.
• Heating and cooling system
There are certain number of radiators in each zone which are all supplied by district heating and the power of them was adjusted according to each zone characteristics (see Appendix C). The domestic hot water is also supplied by the district heating and there is a heat pump for cooling with the COP of 3.
• Glazing units input data
Regarding the glazing units of the building, it is a double-pane clear glazing with a wooden frame. The data regarding the U-value, G-value and visible transmittance of the window for both cases, without the window films and in the presence of the films are shown in the following table. As it is mentioned before, these values are collected from a field test carried out by (Magnus Mattsson, 2018) together with the technical catalogue of the window film provided by the manufacturer (see Appendix D).
• 3D model of the building
Figure 10 depicts the 3D model of the building. the building totally has 76 windows. The whole window without
low-E films
The window with low-E films on the third surface U-value (W/𝑚2 k) 2.30 1.59
G-value 0.76 0.51
Visible Transmittance 0.81 0.66
Figure 10. The 3D model of the building
3.2.2 Validation of the model of the building
After inputting all the data and completing the model, a simulation for the period “01.01.2018 to 31.12.2018” was run. The reason why the simulation was run for the entire year 2018 was that the field test by (Magnus Mattsson, 2018) was carried out in 2018. The results of the simulation were extracted and in order to validate the model, the energy use for district heating derived from the simulation was compared with the annual district heating bills of the building collected from Gavlefastigheter company. Since the inside areas of the building are heated by radiators and the air handling units supplied by the district heating network, only the energy usage from district heating was chosen for the validation purpose. Usually less than 5% deviation from the reference value (energy bills) is accepted.
3.2.3 Application of the window films
After the validation of the building’s model (case A (without the film)), by adding the window films to all the glazing units of the building, case B was created. It can be done by inputting U-values, G-values and visible transmittance value in the presence of the window films collected from the previous field test (see Table 2). The next step was to run a simulation for the same period as the basic model (case A (without films)) and collect the results.
3.2.4 Comparison of the results of case A (without films) and case B (with films)
The main areas for the comparison include energy usage of the building along with thermal comfort with the help of Fanger’s comfort indices and the EN-15251 standard.
To compare the results of the two cases regarding thermal comfort, for each case, totally four zones from all the three floors covering all the four facades of the building were chosen. In the selection process, the priority was given to the zones which have more occupants and windows. Then the data for the chosen zones for the both cases were compared against each other.
The following figures show the orientation of the chosen zones.
Figure 11. Zone 4 facing the north and west Figure 12. Zone 14 facing the west and south
Figure 13. Zone 44 facing the south Figure 14. Zone 56 facing the east and south
3.2.5 Cost analysis using payback period and discounted payback period (DPP) method
Finally, the cost analysis using payback period method and discounted payback period (DPP) (see the theory part) was conducted to evaluate the energy cost savings of the application of the low-E window films to the building.
3.3 Problems and limitations of the adopted method
One of the important issues associated with simulation of the building for the entire year, was its long duration, it was time consuming. This disadvantage hinders the project in case that redoing the simulation caused by wrong input data is needed.
It could be good to mention that the uncertainty about the energy price for the next years could be a problem. It is very difficult to predict the energy price because it depends on many factors. In this report the energy price for the whole 15 years chosen for the analysis, was considered constant.
Another weakness of the adopted method was that in the aforementioned field test, the low-E window films were tested only on limited number of the buildings’ glazing units and it means that the U-values and g-values of the other glazing units located in other parts of the building in the presence of the films might slightly differ from the collected values from the field test. Other factors including shading due to trees and outdoor objects and aging of the films could also affect the accuracy of the results.
4 Results
In this chapter the results of the simulation without the window film (case A) and with the window films (Case B) will be presented.
4.1 Base model simulation results (case A (without window films))
The simulation results regarding the energy performance and thermal comfort will be discussed separately in the following parts.
4.1.1 Energy Performance
The results of the base model simulation (case A (without films)) are illustrated in the following tables.
Table 3. Building information.
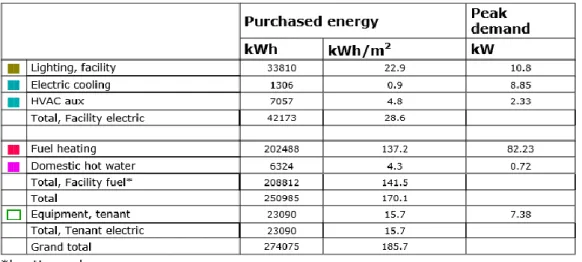
Table 4 shows the amount of energy delivered to the building. As illustrated, the total energy usage of the building for heating and domestic hot water is 221872 kWh for the whole year. The amount of electricity use for cooling is also 1314 kWh which is quite smaller than the amount of energy used for heating.
Table 5 illustrates that the envelope and thermal bridges along with the windows are responsible for the main heat losses during heating. During the cooling, the window & solar part together with lighting are responsible for the main heat gain.
Table 5. Heat losses and heat gain during heating and cooling for the entire building
Values shown in Table 6 and Table 5 indicate that during heating, the heat losses through the windows without considering the solar heat gain is -52576.7 kWh, while this value drops to -42687.3 kWh with taking the solar heat gain into consideration. This shows that in the winter, solar heat gain has compensated about 18% of the heat losses through the windows which proves that the solar heat gain plays an important role in heating demand reduction. During cooling, without considering the solar heat gain, about -17398.9 kWh heat is lost through the windows, while with considering the solar heat gain, the heat loss of -17398.9 kWh will be converted to the heat gain of 20134.5 kWh. This indicates that the solar heat gain in the summer can contribute to increasing the need for cooling, thereby raising the energy usage.
4.1.2 Thermal comfort
The following tables show the data regarding thermal comfort based on Fanger’s comfort indices and EN-15251 standard for the four selected zones.According to category II (normal level of thermal comfort expectation) defined in the EN-15251 standard, PPD should be less than 10 %, so the months in which PPD is more than 10% are considered as uncomfortable months. More detailed information regarding the EN-15251 standard and simulation results for thermal comfort can be found in Appendix A and Appendix E respectively.
Zone
Number of occupancy hours based on
comfort category Number
of
occupants
Number of equipment units Best Good Acceptable Unacceptable
4 1074 2756 2898 234 3 3 14 1007 2797 2925 207 2 2 44 1542 1745 1822 1310 8 8 56 961 2535 2667 465 2 2
Table 8. Fanger's comfort indices for uncomfortable months for the selected zones without films Table 7. Thermal comfort data based on EN-15251 standard for the selected zones without the window films (case A) zone Uncomfortable months Variables PPD, % (Predicted percentage dissatisfied) PMV (Predicted mean vote) Average operative temperature (°C) 4 July 11.46 0.42 27.15 14 July 11.12 0.40 26.80 44 June 15.02 0.49 27.87 July 26.51 0.73 29.82 August 20.13 0.61 28.46 56 July 15.88 0.51 27.96
Zone 4
According to Table 7, thermal comfort in zone 4, for most of the hours is ranked as acceptable and above the acceptable level. The number of unacceptable occupancy hours is 234 which mostly belongs to July. Table 8 indicates that the PPD in July is 11.46 % which is above the limit (10%) specified by the EN-15251 standard, and that is why July was considered as an uncomfortable month. The average operative temperature in July is 27.15 (°C) which is higher than the standard limit. (see Appendix E)
Zone 14
Table 7 shows that thermal comfort in zone 14 for most hours of the year is ranked as acceptable and above that. Table 8 indicates that in July, PPD is 11.12 % and the average operative temperature is 26.8°C which is slightly better than zone 4. For other months, thermal comfort is in compliance with the standard.
Zone 44
Data regarding thermal comfort shows that zone 44 has the worst situation compared to the other zones. The number of unacceptable occupancy hours is 1310 which is five times as large as zone 4 and zone 14. Table 8 shows that the PPD values in June, July and August are 15.02 %, 26.51%, 20.13 % respectively of which July represents the highest PPD. The average operative temperatures for these months are above 27°C which do not comply with the standard level.
Zone 56
According to Table 7, thermal comfort in zone 56, for most of the hours is ranked as acceptable and above that. The number of unacceptable occupancy hours is 465 which mostly belongs to July. Tables 8 also shows that the PPD in July is 15.88 % and the average operative temperature is about 28°C which are all above the standard level. The information regarding the standard level can be found in Appendix A.
Table 9 indicates, in worst zone of the building, for 42 % of the hours the operative temperature is above 27°C, and 13 % of the total occupant hours is ranked as thermally dissatisfied.
4.2 Base model (case A (without window films)) validation
According to Table 4, the delivered energy from district heating is 221872 kWh including the heating and domestic hot water for the whole year. To verify this amount, it should be compared with the energy usage bill of the building, specifically for district heating of course. Table 4-6 collected from “Gavlefastigheter Company” shows the energy usage of the building supplied by district heating. As it is shown in the table, the total amount of the energy usage is 228790 kWh for the whole year. By comparing the result of the simulation and the energy bill, a small difference of 6918 kWh is achieved.
Eq. 6
Eq. 6 shows that the error percent is about 3%, and this means that the simulation result is 3% deviant from the amount shown in the energy bill taken as reference. This small deviation is acceptable and it can be concluded that the simulation results are valid.
4.3 Results of the simulation in the presence of low-E films (case B)
The simulation results regarding the energy performance and thermal comfort in the presence of the window films will be discussed separately in the following parts.
Table 10. Energy bill for district heating, collected from Gavlefastigheter Company.
4.3.1 Energy performance
The following tables depict the results of the simulation in which the window films were added.
Table 11. Simulated energy use of the building with window films (case B).
According to Table 11, the total energy usage of the building for heating and domestic hot water is 208812 KWh for the whole year. Table 12 shows that during heating, the heat loss through windows excluding the solar heat gain is -35226.6 kWh, while this amount by considering the solar heat gain will drop to -27403.5 kWh according to Table 13. This means that to some extent the solar heat gain has compensated for the heat losses through the windows. During cooling the heat which is lost through the windows without considering the solar heat gain is -10552.7 kWh, while by taking the solar heat gain into consideration, this amount will be converted to a heat gain of 12994.5 kWh. The heat gain during cooling means undermining the natural ventilation and more cooling demand, thereby increasing the energy usage.
4.3.2 Thermal comfort
The following tables show the data regarding thermal comfort for the same four zones as selected in section 4.1.2 with the help of Fanger’s comfort indices and EN-15251 standard. To make the comparison of the results of case A (without films) and case B (with films) easier, the same uncomfortable months picked for case A, were chosen for case B.
More detailed information regarding the building thermal comfort in the presence of the window films can be found in Appendix E.
Zone
Number of occupancy hours based on
comfort category Number
of
occupants
Number of equipment units Best Good Acceptable Unacceptable
4 1164 2848 2974 158 3 3 14 1074 2822 2947 185 2 2 44 1728 1916 2086 1046 8 8 56 1070 2693 2847 285 2 2
Table 14. Thermal comfort data based on EN-15251 standard for the selected zones with the window films (case B)
Table 15. Fanger's comfort indices for uncomfortable months for the selected zones with films (case B)
zone Uncomfortable Months Variables PPD, % PMV Average operative temperature (°C) 4 July 8.56 0.35 26.48 14 July 10.07 0.38 26.61 44 June July 10.50 21.35 0.39 0.63 26.90 28.94 August 16.35 0.54 27.82 56 July 11.46 0.42 27.23
Zone 4
Table 14 shows that the number of unacceptable occupancy hours is 158 and for the rest of the hours, thermal comfort is ranked as acceptable and better than that. Table 15 represents that although the average operative temperature in July is about 26.5°C which is a little high, the PPD still stands in the accepted range (less than 10%).
Zone 14
According to Table 14, the number of the unacceptable occupancy hours is 185 which mostly belongs to July (for more information see appendix E). table 15 indicates that the PPD is very close to 10 % which is the highest allowed percentage according to EN-15251 standard. The average operative temperature is 26.61°C which is a little high.
Zone 44
The number of unacceptable occupancy hours shown in Table 14 is 1046 which is quite larger than the other selected zones. Table 15 also shows that the unacceptable occupancy hours are mostly related to June, July and August having PPD of 10.5 %, 21.35 % and 16.35 % respectively. The average operative temperature in July is very close to 29°C which represents the most uncomfortable month of the year.
Zone 56
As it is shown in table 14, the number of the unacceptable occupancy hours is 285 mostly related to July, and for the rest of the hours, thermal comfort is ranked as acceptable and even better than that. The PPD in July is 11.46 % exceeding the largest allowed percentage (10 %) and the average operative temperature in July is 27.23°C which is relatively high.
Table 16 shows that, in worst zone of the building, for 35 % of the hours the operative temperature is above 27°C and 11 % of the total occupant hours is ranked as thermally dissatisfied.
4.4 Comparison of the results
In this section the results of the simulation for case A (without films) and case B (with films) will be compared with each other.
4.4.1 Energy performance
Table 17 shows that the total energy use of the building for heating purpose and domestic hot water without window films is 221872 kWh, while this amount in the presence of the window films has decreased to 208812 kWh. It means that the window films have contributed to a 13060 kWh (almost 6%) reduction in the building’s annual energy usage for heating and domestic hot water. The amount of energy savings due to the application of the window films regarding electric cooling, lighting, HVAC system and equipment is quite negligible.
Table 17. Energy usage comparison between base model (case A without films) and case B (with window films)
Table 18. Comparison of heat losses for case A (without films) and case B (with films) during heating
Table 19. Comparison of heat losses and heat gains for case A (without films) and case B (with films) during cooling
Table 18 indicates that during heating, the application of the window films has helped to reduce the amount of heat losses through the windows (including solar gain) by almost 36%. Table 18 also shows that during heating, the heat gain through internal walls and masses in case B (with the window films) is smaller than case A (without films) which could be due to the fact that in the presence of the window films less solar heat is gained by the building (see Tables 5 and 6 for case A and also Tables 12 and 13 for case B).
As it is shown in Table 19, during cooling, with the help of window films, the amount of heat gains through the windows (including solar gain) has dropped by almost 35%.
It can also be seen that during cooling, in case B (with window films) less heat is absorbed by internal walls and masses than case A (without window films) and it could be due to the fact that in case A (without window films), inside of the building is warmer than case B (with films), therefore more heat is absorbed by internal walls and masses in order to cool the building (see Tables 5 and 6 for case A, and also Tables 12 and 13 for case B). More information about each category shown in Tables 18 and 19 can be found in appendix F.
4.4.2 Thermal comfort
In this section the results of thermal comfort for case A (without films) and case B (with films) will be compared with each other.
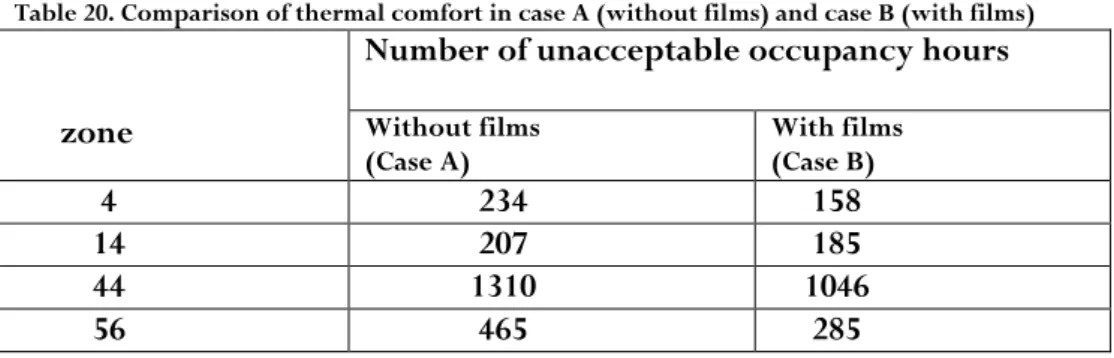
Table 20. Comparison of thermal comfort in case A (without films) and case B (with films)
zone
Number of unacceptable occupancy hours
Without films
(Case A) With films (Case B)
4 234 158
14 207 185
44 1310 1046
Table 21. comparison of Fanger's comfort indices in case A (without films) and case B (with films)
Table 20 shows that the application of the window films has improved the thermal comfort in all of the selected zones. Zone 56 has experienced a 39 % reduction in the number of unacceptable occupancy hours which is the largest among the selected zones, while the number of unacceptable occupancy hours in zone 14 has only dropped by 9 % which is the lowest among the zones.
As it is shown in Table 21, the predicted percentage dissatisfied (PPD), with the help of window films in all the zones has decreased which indicates an improvement in thermal comfort.
The largest reduction in PPD belongs to zone 44 in July which about 5.1 %, and the lowest reduction in PPD is for zone 14 in July. It can be seen that the window films have contributed to some reduction in the average operative temperatures of all the zones. The largest reduction in the operative temperature belongs to zone 44 specifically in June and July, while the lowest reduction belongs to zone 14 in July. It can be said that zone 14 has received the lowest benefit from window films compared to the other zones.
According to Table 22, the percentage of total occupant hours with thermal dissatisfaction has dropped from 14 to 11 with the help of window films.
Zone Uncomfortable Months PPD, % (Predicted percentage dissatisfied) Average operative temperature (°C) Without films (Case A) With films (Case B) Without films (Case A) With films (Case B) 4 July 11.46 8.56 27.15 26.48 14 July 11.12 10.07 26.80 26.61 44 June 15.02 10.50 27.87 26.90 July 26.51 21.35 29.82 28.94 August 20.13 16.35 28.46 27.82 56 July 15.88 11.46 27.96 27.23
4.5 Cost analysis
As it is mentioned in part 4.4, the amount of energy saving related to district heating by application of the low-E window films is about 13060 kWh. It is good to repeat that, to focus on the district heating part, the very small difference in the amount of electricity usage between case A (without films) and case B (with films) is excluded from the calculation. To be able to accomplish the cost analysis, the data regarding the window film price, installation cost and district heating price are collected from different sources.
The cost of the tested films calculated by the Swedish installers, “Sunstop”, is 2000 SEK/m2
+ 150 SEK for each window. The district heating price according to (Ahmed, 2017) is considered 0.65 SEK/kWh. The calculation of the maximum payback period is as follows:
Total number of windows: 76 Area for each window: 2.934 m2
Total window area:
76 * 2.934 = 222.984 m2 Eq. 7
Total investment:
222.984 * 2000 SEK + (76 * 150) = 457368 SEK Eq. 8
Saving in district heating energy use:
215548 – 202488 = 13060 kWh/year Eq. 9 Domestic hot water is excluded because it was the same for the both cases.
Saving cost per year:
13060 * 0.65 = 8489 SEK/year Eq. 10
Payback period without any interest:
(457368)/(8489) = 53.9 years Eq. 11 According to Eq. 10, the payback period is very long.
Discounted Payback Period (DPP):
Assuming the discount rate of 1.8 %, the discounted payback period exceeds 100 years which usually does not attract the investors when it comes to profitability.
5 Discussion
In this chapter the results of case A (without window films) and case B (with window films) will be compared against each other from three different perspectives including “energy saving”, “thermal comfort” and “cost saving”.
5.1 Energy saving
The results in chapter 4 have shown an improvement in the annual energy efficiency of the building. Table 17 shows that with the help of the window films, the building’s annual energy usage for heating and domestic hot water, has decreased by almost 6%.
In the literature review chapter, it was mentioned that low-E window films, in the winter can reduce the heat losses through windows by blocking the inside radiative heat from leaving the building. The results of Table 18 have also confirmed this claim. It can be seen that during heating, the application of the low-E window films caused the amount of heat losses through the windows including (solar gain) to reduce by 36 % resulting in energy usage reduction. It was also discussed that in the summer the low-E window films could send back some part of the solar radiation to the outside of the building and prevent it from getting into the room, thereby avoiding excessive heat gain in the building. The results of Table 19 approve this explanation. According to the results, during cooling, with the help of the window films, the amount of heat gain through windows (including solar gain) has dropped by almost 35 % resulting in better thermal comfort and a slight reduction in cooling demand.
The above-mentioned paragraphs explained how the low-E window films contributed to the reduction in the building’s energy usage, but it should be emphasized that to calculate the total energy savings due to the application of the window films, the results shown in Table 17 should be taken into consideration, because this table shows the results of the one-year simulation based on the climate file, while the results of the cooling and heating simulation shown in Table 18 and 19 are based on synthetic temperatures.
5.2 Thermal comfort
The comparison between the results of case A (without films) and case B (with films) shows that, in the presence of the low-E window films, the thermal comfort in all the selected zones (zones 4, 14, 44 and 56) has improved. According to Table 20, among the selected zones, zone 56 experienced a 39 % reduction in the number of unacceptable occupancy hours which was the largest and zone 14 experienced the lowest reduction in the number of unacceptable occupancy hours which was around 9 %. As far as the predicted percentage dissatisfied (PPD) for uncomfortable moths is concerned, zone 56 and zone 44 have benefited from the window films application the most, in a way that on average their PPDs dropped by 4.5 %. Zone 14
has experienced the lowest reduction in PPD during July which was about 1 % (see Table 21).
As it is shown in Table 21, the window films have helped to reduce the operative temperatures during the uncomfortable months in all the zones. The largest reduction belongs to zone 44 which is close to 1 °C.
It should be taken into consideration that in both cases (without films and with film), the thermal comfort in July, was the weakest that is why it was considered as the uncomfortable month. Among the selected zones, zone 44 showed the weakest thermal comfort which could be due to having more occupants, equipment and windows.
One thing that could be considered in the simulation is that in Sweden, occupants are usually on holidays in July. This means that in July, the number of occupants of the building could be considered less than the other months which would result in better thermal comfort. In this report due to a lack of information about the number of people working in July, it was assumed that in July, the number of the occupants is the same as the other months, that is why the operative temperature in July is relatively high.
To conclude, in the summer, for all the selected zones even in case B (with window films), during some hours the operative temperatures are relatively higher than the comfort range, and this fact indicates that the solar heat gain control in the summer still needs improving.
5.3 cost saving
The results of section 4.5 show a long-time payback period which is a disadvantage. As it is mentioned before, the price of this window film is relatively high which can lead to a large initial investment cost. In fact, the amount of money saved by the energy use reduction does not match the huge investment cost. As far as the cost-effectiveness is concerned, the application of the window film is questionable, but it should be taken into consideration that for cases similar to this historic building with strict retrofit regulations, finding an alternative for energy efficiency and thermal comfort improvement is not a simple task.
6 Conclusion
6.1 Study results
This research tried to figure out to what extent the application of the low-emissivity window films contributes to the energy usage reduction of a historic stone building. As discussed in the previous chapters, application of the tested low-emissivity window films to some extent has helped to prevent the inside radiative heat from escaping the building which resulted in a 36 % heat loss reduction in the winter. Also, in the summer, the window films participated in a 35% solar gain reduction resulting in better thermal comfort. In addition to the energy savings, the window films contributed to thermal comfort improvement which could be beneficial to all the building’s occupants. The percentage of total occupant hours with thermal dissatisfaction has dropped from 14 % (without films) to 11% (with films).
From the cost analysis, it was discovered that the payback period for investing in the window films was very long which was considered as a disadvantage. Other possible problems associated with the window films include bubbles emergence on the films and a reduction in sunlight gains.
By considering the above-mentioned advantages and disadvantages of the window film, this research concludes that for this historic commercial building and other similar buildings in cold climate with strict retrofit regulations, if cost-effectiveness is not prior than thermal comfort and energy efficiency, application of the window films is among the recommendable measures, but not necessarily the best.
6.2 Outlook
The results of this research could be further improved by application of other types of window films and high-tech windows to different types of buildings including both residential and commercial in different climates. Investigation of the effects of outdoor shading on performance of window films, running energy simulation with other programs than IDA ICE, prolongation of the simulated period to several years are some of the for further studies.
6.3 Perspectives
Nowadays, the term “sustainability” has attracted the highest attention than ever. The three pillars of this term include environment, social and economic which all of them play important roles in our life. Currently, environmental degradation is one of the big global issues which has concerned many people around the world. Many contributors to environmental issues have been introduced so far, but fossil fuels consumption stands out from them. Thanks to the growing awareness of fossil fuels’ environmental consequences, the efforts into transformation to renewable and greener sources of energy have accelerated.
In addition to this crucial transformation, other energy saving measures including industrial and buildings’ energy usage reduction, adoption of the latest energy technology, improving the energy behavior, etc. should be carried out. This research has tried to participate in the buildings’ sector energy performance improvement, to have a small role in the environment preservation.
1 References
Åberg, M., 2014. System Effects of Improved Energy Efficiency in Swedish District-Heated Buildings (Dissertation), Uppsala: Uppsala University.
Ahmed, F. A. M., 2017. Energy Audit in Educational Buildings, u.o.: Gävle university. Anon., u.d. Thermal Comfort Assessment for EN 15251 and EPBD, u.o.: u.n.
Arefeh Hesaraki, S. H., 2013. Energy performance of low temperature heating systems in five new-built Swedish dwellings: A case study using simulations and on-site measurements. Building and Environment, Volume 64, pp. 85-93.
Bjørn Petter Jelle, S. E. K., 2015. Low-emissivity materials for building applications: A state-of-the-artreview and future research perspectives. Energy and Buildings, Volume 96, p. 329–356.
Chunying Li, J. T. T.-T. C. Z. Q., 2015. Experimental and theoretical study on the effect of window films on building energy consumption. Energy and Buildings.
Europe, I. E., u.d. Comfort monitoring for CEN Standard EN15251 linked to EPBD, u.o.: u.n. J. Fergus Nicol, M. W., 2011. A critique of European Standard EN15251: strengths,weaknesses and lessons for future standards. BUILDING RESEARCH & INFORMATION , Volume 39, p. 183–193.
J. Fergus Nicol, S. R., 2017. Rethinking thermal comfort. BUILDING RESEARCH & INFORMATION, 45(7), pp. 711-716.
J.W. Lee, H. J. J. P. J. L. Y. Y., 2013. Optimization of building window system in Asian regions by analyzing solar heat gain and daylighting elements. Renewable Energy, Volume 50, pp. 522-531.
Jong Jun Park, Y. I. K. P. P., 2017. Infiltration and Heating Load Analysis of an apartment with respect to window type, window location and lock operation. ASHRAE Transactions, Volume 123(1), p. 201(14).
Kabanshi, A., 2018. Thermal comfort, Lecture notes part 2, u.o.: Gävle University. Kagan, J., 2019 . Payback Period , u.o.: Investopedia.
Karjalainen, S., 2019. Be active and consume less—the effect of venetian blind use patterns on energy consumption in single-family houses. Energy Efficiency, 12(3), p. 787–801. Magnus Mattsson, J. A. B. K. A. A., 2018. energieffektivisering av äldre fönster- fältprovning av beläggning med lågemissivitetsfilmer, gävle: gävle university.
Müslüm Arıcı, H. K. M. K., 2014. Flow and heat transfer in double, triple and quadruple pane windows. Energy and Buildings, Volume 86, pp. 394-402.
Nakorchevskii, A. I., 2015. On the Minimization of Heat Losses Through the Exterior Wall of a Building with a Window Opening. Journal of Engineering Physics and Thermophysics, 88(3), p. 706–715.
Penny, J., 2012. Low-E Film or Window Replacement?. Buildings, 106(3), p. 30.
Robert Kasprowicz, C. S., 2015. Availability-based Payback Method for Energy Efficiency Measures. Procedia CIRP, Volume 29, pp. 710-715.
Rongxin Yin, P. X. P. S., 2012. Case study: Energy savings from solar window film in two commercial buildings in Shanghai. Energy and Buildings, Volume 45, pp. 132-140.
Sudip Kumar Pal, K. A. J. J. K. S., 2015. Energy performance and economic viability of advanced window technologies for a new Finnish townhouse concept. Applied Energy, Volume 162.
Suresh B.Sadineni, S. M. R. F., 2011. Passive building energy savings: A review of building envelope components. Renewable and Sustainable Energy Reviews, 15(8), pp. 3617-3631. Taghi Karimpanah, A. H., 2018. Energy Balance of Buildings. Notes from lecture 4, p. lecture 4.
WIKIPEDIA, o., 2019. Solar gain, u.o.: WIKIPEDIA.
Windows, A. b. g. t. l.-E., 2015. A basic guide to low-E windows, u.o.:
Appendix A
Standard (EN15251) important tables regarding thermal comfort
Table 23. Examples of recommended categories for design of mechanical heated and cooled buildings.
Table 25. Temperature ranges for hourly calculation of cooling and heating energy in three categories of indoor environment
Table 26. Examples of recommended design values of the indoor temperature for design of buildings and HVAC systems
Appendix B
Field Test at Rådhust “Photos by Magnus Mattsson”
Figure 15. Field test at Rådhuset. Photo by Magnus Mattsson
Figure 16. Instrument installation in Rådhuset. Photo by Magnus Mattsson
Figure 17. Hotbox creation, photo by Magnus Mattsson
Figure 18. Window film installation, photo by Magnus Mattsson
Appendix C
Data regarding occupancy, lighting, equipment and radiators for all the zones
Appendix D
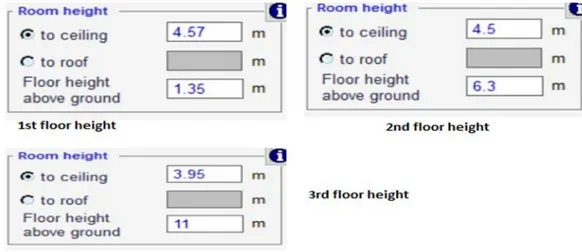
Figure 20. Building’s floors’ height
Figure 21. Occupant configuration
Pressure coefficient
Appendix E
Figure 23. Thermal comfort data based on EN-15251 standard for zone 4 without films
Table 32. Fanger comfort indices for zone 4 without films
Figure 24. Thermal comfort data based on EN-15251 standard for zone 14 without films
Table 34. Fanger comfort indices for zone 14 without films
Figure 25. Thermal comfort data based on EN-15251 standard for zone 44 without films
Table 36. Fanger comfort indices for zone 44 without films
Figure 26. Thermal comfort data based on EN-15251 standard for zone 56 without films
Table 38. Fanger comfort indices for zone 56 without films
Case B (with window films)
Figure 27. Thermal comfort data based on EN-15251 standard for zone 4 with films.
Table 40. Fanger comfort indices for zone 4 with films
Figure 28. Thermal comfort data based on EN-15251 standard for zone 14 with films.
Table 42. Fanger comfort indices for zone 14 with films
Figure 29. Thermal comfort data based on EN-15251 standard for zone 44 with films.
Table 44. Fanger comfort indices for zone 44 with films
Figure 30. Thermal comfort data based on EN-15251 standard for zone 56 with films.
Table 46. Fanger comfort indices for zone 56 with films
Appendix F