Techno-economic analysis of energy storage integration
for solar PV in Burkina Faso
Hamza Abid
Master of Science Thesis
KTH School of Industrial Engineering and Management Energy Technology TRITA-ITM-EX 2019: 665
Division of Energy and Climate Studies SE-100 44 STOCKHOLM
Master of Science Thesis EGI 2019: TRITA-ITM-EX 2019:665
Techno-economic analysis of energy storage
integration for solar PV in Burkina Faso
Hamza Abid
Approved Examiner
Dilip Khatiwada, PhD
Supervisor
Jagruti R. Thakur, PhD (KTH) David Bauner (Renetech AB)
Commissioner Contact person
Table of Contents
1 Introduction ... 3 2 Research Objective ... 7 2.1 Scope of Study ... 7 3 Literature Review ... 9 4 Methodology ... 114.1 Load Profile Assessment ... 12
4.1.1 Urban Load Profile... 13
4.1.2 Rural Load Profile ... 17
4.2 System Configuration ... 18
4.3 Component Specifications ... 20
4.3.1 PV System ... 20
4.3.2 Solar Energy Resource ... 21
4.3.3 AC DC Converter... 21
4.3.4 Pumped Hydro Storage ... 22
4.3.5 Electric Battery Storage ... 23
4.4 Assessment Criteria ... 23
4.4.1 Net Present Cost ... 23
4.4.2 Levelized Cost of Energy ... 25
4.4.3 Grid Extension ... 26
5 Results and Discussion ... 28
5.1 Off Grid ... 28
5.1.1 Optimization of System Architecture for Rural Consumers ... 28
5.1.2 Grid Extension Breakeven Distance ... 31
5.1.3 Sensitivity Results ... 33
5.2 Grid Connected ... 36
5.2.1 Optimization of System Architecture for Urban Consumers ... 36
5.2.2 Sensitivity Results ... 37
5.3 Policy Implications ... 40
5.4 Limitations and Future Work ... 40
6 Conclusion ... 41
7 References ... 42
8 Appendix ... 46
8.1 Appendix A ... 46
1
Abstract
Electrification in rural areas of West African countries remain to be a challenge for the growth of the region. The Economic Community of West African States (ECOWAS) has set a target of 2030 to achieve 100% electrification in all member countries. Burkina Faso is one of the least electrified countries in the world, where only 9 % of the rural population has access to electricity. This study presents a conceptualization of techno-economic feasibility of pumped hydro storage (PHS) and electric batteries with solar photovoltaics (PV) in the context of Burkina Faso. The results are explored for an off grid standalone PV plus storage system for a rural setting and a grid connected PV system for an urban setup. The least cost configurations for both the cases are determined using HOMER (Hybrid Optimization Model for Electric Renewables). The results indicate the need of extended solar penetration in Burkina Faso in response to the challenges of low electrification rates in the country. Adding more PV to the present electricity mix of Burkina Faso could drive down the cost of energy by 50 % compared to the present grid electricity prices by making cheap electricity available to the local population. Adding PHS to grid connected PV leads to a cost reduction of 8% over a lifetime of 25 years which does not provide enough motivation for the high investments in storage at present. Policy interventions that allow stacking up of revenues and benefits of storage are needed to make it more competitive. PV plus pumped hydro storage remains the optimal system architecture as compared to PV plus electric batteries for off grid standalone systems provided the geographic availability of lower and upper reservoirs. The capital cost of PV remains to be the most dominating factor in the cost of optimal system for both the urban and the rural cases, and driving down the costs of PV would have the most positive effect for increased electricity access in the country.
Keywords
2
Sammanfattning
Elektrifiering i landsbygdsområden i västafrikanska länder är fortfarande en utmaning för tillväxten i regionen. Ekonomiska gemenskapen i Västafrikanska stater (ECOWAS) har satt upp ett mål 2030 att uppnå 100% elektrifiering i alla medlemsländer. Burkina Faso är ett av de minst elektrifierade länderna i världen där bara 9% av landsbygdsbefolkningen har tillgång till el. Denna studie presenterar en konceptualisering av teknisk ekonomisk genomförbarhet för pumpad vattenkraftlagring (PHS) och elektriska batterier med PV (photovoltaics) paneler i samband med Burkina Faso. Resultaten undersöks med avseende på ett fristående fristående PV plus lagringssystem för landsbygden och ett nätanslutet PV-system för en stadsinstallation. De lägsta kostnadskonfigurationerna för båda fallen bestäms med hjälp av HOMER (Hybrid Optimization Model for Electric Renewables). Resultaten visar på behovet av utökad solpenetrering i Burkina Faso som svar på utmaningarna med låga elektrifieringshastigheter i landet. Att lägga till mer PV till den nuvarande elmixen av Burkina Faso skulle kunna sänka energikostnaderna med 50% jämfört med de nuvarande elpriserna för nätet genom att göra billig el tillgänglig för lokalbefolkningen. Att lägga till PHS till nätansluten PV leder till en kostnadsminskning på 8% under en livslängd på 25 år som inte ger tillräcklig motivation för de stora investeringarna i lagring för närvarande. Politikåtgärder som möjliggör stapling av intäkter och fördelar med lagring behövs för att göra det mer konkurrenskraftigt. PV plus pumpad hydro förblir den optimala systemarkitekturen jämfört med PV plus elektriska batterier för fristående nät utanför nätet förutsatt geografisk tillgänglighet av nedre och övre reservoarer. Kapitalkostnaden för PV är fortfarande den mest dominerande faktorn i det lägsta kostnadssystemet för både stads- och landsbygdsfall och att köra ner PV-kostnaderna skulle ha den mest positiva effekten för ökad elåtkomst i landet.
Nyckelord
3
1 Introduction
While the global access to electricity has increased over the past two decades, there are some parts of the world that still lack the access to electrical energy. This greatly limits growth opportunities and severely affects all aspects of the society. The situation seems to be critical in some West African countries but is changing quite rapidly [1]. By 2030, the ECOWAS (Economic Community of West African States) aims to achieve 100 % electrification in all of its 15 member states [2].
Burkina Faso is one of the least electrified countries in the world with 25 % overall electrification in 2017, wherein 65% of the urban and only 9% of the rural population is connected to the grid [3]. The energy mix for Burkina Faso consists of 67.2% thermal, 10 % hydro and 17 % from imports for the nation [4]. The lack of grid infrastructure only makes the situation worse. Despite the fact that Burkina Faso belongs to one of the sunniest areas on planet, the solar contribution to national electricity consumption in 2014 was only 0.8 % [5] which rose to 5 % with the addition of 33 MW Zagtouli Solar power plant to the grid in 2017 [4]. According to SE4all, “Strategy for Accelerated Growth and Sustainable Development” [6], Burkina Faso’s existing reference framework in the field of energy policy, the government of Burkina Faso has set a target of 50 % of total primary energy supply from renewable energy in the electricity mix by 2030 (without biomass). The objectives envisioned by the government are to reach an overall national electrification rate of 65% with an urban electrification rate of 95 % and 50 % for the rural case by 2030 [7].
To achieve these goals, a study by the Joint Research Center (JRC) by the European Commission suggests that smaller local electrification projects based on indigenous renewable source like standalone PV in the long term, are expected to be more feasible than centralized ones based on fossil fuels. The study also suggests that 65% of the non-electrified settlements are to be served by decentralized power plants [5]. However, since Burkina Faso depends on electricity imports from its neighboring countries, the backbone of current national policy is grid extension the 225kV interconnection [8], between Bolgatana (Ghana) – Ouagadougou (Burkina Faso) which is 210 km long, with a capital cost of 156 million USD. At present, there are only two 225 kV existing grid connections in the country as shown in Figure 1, indicating the lack of grid infrastructure.
As per 2017 JRC recommendations for Burkina Faso, the costs associated with national grid extension projects are expected to be quite high and not necessarily the least cost option due to lack of proper grid infrastructure in the country. The marginal cost of electrification could be reduced through the deployment of 374 MW of decentralized PV systems with an estimate cost to reach universal access to electricity by 2030 to be around 1.7 billion euros. [5]
4
Figure 1. Grid Connections in West Africa [9]
Burkina Faso depends heavily on thermal fossil production for its energy needs. In response to the 2008 global oil shock, the energy prices increased substantially. The government in turn has been subsidizing fossil fuel for energy production. In 2013, the government provided 260 million euros in implicit and explicit fuel subsidies to SONABEL and SONABHY, the national electricity company and the national fuel importer respectively. This is equivalent to the government expenditure of 2.9 percent of GDP. [10] Along with the grid extension, utilizing the massive solar potential in the country and directing fossil fuel subsidies as investments towards PV mini grids, promoting solar rooftop PVs and biomass cogeneration units need to be considered [5]. The ministry of energy has planned in January 2018 to build eight solar parks with a total capacity target of 100 MW [11]. The country receives a total of 3000 hours of direct sunshine throughout the year, this is a quite significant amount when compared with Germany that receives on average of 16000 hours of direct sunshine a year and has the fourth largest solar PV capacity in the world [12].
Several projects have been proposed by Economic Community of West African States (ECOWAS) to make use of this solar potential for electrification of the region. ECOWAS in 2006 started an initiative called the West African Power Pool (WAPP) to promote cooperation and integration of national power systems of fourteen inland countries in West Africa into a unified electricity market. ECOWAS and WAPP in 2012 approved a list of 59 priority projects for the region adopted from the Master Plan for the Generation and Transmission of Electrical Energy prepared by Tractebel [8]. Burkina Faso is one of the 15 member states
5
of the West African Power Pool. WAPP has proposed many solar projects in the country. One of the project is an installation of three 50 MW solar PV plants in three different locations in the country by 2022 [9]. Decentralized energy projects could play a huge role in the rapid electrification of the nation [5]. One of the key components of decentralized systems is storage. The role of energy storage, in enabling the penetration of renewables is increasingly becoming paramount, given the continuous decreasing trend in the capital prices of ion batteries [13]. Figure 2 shows the projected decrease in the capital cost of Li-ion batteries from 600 $/kWh in 2016 to about 200 $/kWh in 2030 through improvements in the value chain processes.
Figure 2. Decreasing Cost of Li-ion Batteries [13]
Pumped hydro storage (PHS) is undoubtedly the most mature kind of storage technology with a large lifetime of 25-100 years [14], [15]. In Europe, PHS represent 99 % of the grid connected storage that are employed for a wide range of operations like load shifting, regulation reserve voltage support etc. [16]. Overall, as per IEA projections [17], the global PHS capacity is to increase almost by around 20 % (29 GW) in the next five years whereas a total of 1.3 GW of PHS was added in 2016-2017 for the sub Saharan African region [17].
6
Burkina Faso is dependent at present mostly on thermal fossil-based production [4], but there is a potential of other sources like hydro and solar that can be exploited to cater to the energy needs. According to “UNIDO World Small Hydropower Development Report 2016” [18], pumped hydro represents around 10% of the country’s electricity needs with two dams (Kompienga and Bagre) totaling to about 32 MW. In addition, there also small-scale hydro plants as well (Tourni 0.6 MW) and Niofila (1.68 MW) in Burkina Faso. There are three major rivers in the country (Black Volta Red Volta and White Volta) with an estimated potential hydro capacity of 138 MW. The longest one is the Black Volta (1,352 km), located in the south-west. Two other principal rivers, the White Volta and Red Volta, run north to south in the central plateau region. Planned future hydro projects are mostly located on the black Volta with a capacity of around 80 MW [18].
This study aims to explore the techno-economic feasibility of using different storage options (pumped hydro storage and electric batteries) with solar PV in the Burkina Faso. The consideration of PHS as a storage options is a conceptual study as the data for the potential of PHS for Burkina Faso is not available. This is one of the limitations of the study. With the availability of geographic data, the actual potential of PHS can be studied and it would impact the amount of PHS that could be integrated with PV. Hence, the cost of construction of PHS is considered for the study. The decentralized PV system is considered for the electrification in the rural areas whereas utility scale PV is considered for the grid connected urban areas. The research is carried out in collaboration with Renetech AB. The firm develops projects in collaboration with the technology providers, contractors, equity partners and local stakeholders. The findings from this thesis project shall serve to aid the future development of the projects of West African Power Pool.
7
2 Research Objective
The objective of the study is to determine the techno-economic feasibility of combining pumped hydro storage (PHS) and electric batteries with solar PV for electricity access in Burkina Faso. It aims to identify the optimal configuration of solar PV with storage for rural and urban cases. The system configuration is optimized based on least cost. The Net Present Cost (NPC)1 and Cost of Electricity (COE)2 are analyzed
for selecting the optimal system configuration. A cost comparison in terms of investments in grid extension (the network expansion from the national power transmission system to new communities) vs standalone systems (self-sufficient decentralized solar PV with storage systems) is performed. The study investigates the following two cases:
a) Urban population (Grid connected PV with storage) b) Rural population (Off grid PV with storage)
The research question addressed in the grid connected urban case is:
i) What is the techno economic feasibility of the integration of storage with grid connected utility scale PV evaluated in terms of NPC and COE?
The research questions addressed in the off grid rural case are:
i) Which of the two options (PHS or electric batteries) is more suited for decentralized PV configuration?
ii) What is the breakeven point of grid extension in terms of cost for off grid (PV+ storage) rural configuration in remote villages?
2.1 Scope of Study
The scope of the thesis is limited to only two storage options (PHS and Li-ion electric batteries), other kinds of electric or chemical storage options are not considered. The actual geographical potential of pumped hydro storage and site-specific parameters such as the availability of water bodies are not considered in the
1 The Net Present Cost is the present value of all the costs of installing and operating the components over the project lifetime, minus the present value of all the revenues that it earns over the project lifetime.
2 Cost of energy (COE) is the average cost per kWh of useful electrical energy produced by the system. Both NPC and COE are explained in detail in section 4.4
8
analysis due to unavailability of data. The two storage options are considered for the purpose of comparison for sustainable PV usage. The study is only meant to conceptualize hypothetically the techno-economic feasibility of PHS with solar PV for the considered country. The simulation cases for grid connected and off grid consider the energy and demographic context of Burkina Faso only. The main economic indicators used for comparison are Net Present Cost (NPC) and Cost of Electricity (COE). The software for simulation and optimization is HOMER as discussed further in the section 4.
9
3 Literature Review
The literature on energy storage integration is dominated by optimal design studies with the purpose to identify the optimal size of storage. Cost is a primary concern when it comes to the deployment of storage especially in the developing countries. The World Bank group has recently committed 1 billion dollars to accelerate investments up to 4 billion dollars in the low-middle income countries under its program for “Accelerating Battery Storage for Development” and PV + storage is one of the key areas. [19].
Several studies have been performed to model energy storage systems for optimal cost benefits. In [20], G. Shrestha and L. Goel, have performed simulations for solar panel size and battery size to optimize the operation of a stand-alone PV system measures in terms of loss of load hours, the energy loss and the total cost. A study about battery storage in the developing countries [21] highlights the issues for investment. It states that for battery storage to be price competitive in the developing world, provide utility and drive private investments, “stacking of benefits and revenue streams” is needed. These can include mechanisms such as energy arbitrage and frequency containment reserves. These storage assets can be owned by market players that provide services that are procured by network operators. However, sizing is an important aspect when it comes to deploying these energy storage solutions. A study was performed by Nfah and Ngundam [22] on a hybrid configuration of pumped hydro, biogas, PV and a battery system for a village in Cameroon. The optimal configurations were determined and a cost of energy of 0.352 $/kWh was proposed using HOMER for optimization. Similarly, another study for a hybrid system design for remote areas in Ghana was performed by Adaramola et al. [23] to determine the techno-economic feasibility of wind – diesel generator and a solar hybrid system.
Sigarchian et al. [23] used HOMER to model the domestic sector of Kenya using a generation mix of PV/wind and biomass generation by using electric batteries as a storage. Most of the other literature on hybrid renewable energy systems (HRES) in developing countries focus on electric batteries and several studies have been performed considering pumped hydro storage (PHS). Ma et al. [24] has used PHS for a commercial load with the objective of finding a feasible configuration using mathematical models. In the context of Burkina Faso Daniel et al. [25] have performed an experimental and economical study of PV/diesel hybrid systems without storage for off grid areas. From the literature we can see that for optimization of hybrid systems, HOMER is a preferred choice. Also, the literature review shows that electric batteries have been considered extensively for standalone off grid applications but not much modelling has been done with PHS. There are some clear advantages of PHS such as lower life cycle cost as compared to batteries [24]. Also, there does not seem to be a study in literature on storage with PV in the context of Burkina Faso. Hence, identifying the research gaps, for this study an analysis of PV + storage
10
system for grid connected and off grid applications in Burkina Faso is performed. In this study the COE and NPC of different combinations of PV, batteries and pumped hydro shall be determined using HOMER to compare these two storage options for techno-economic feasibility for grid connected and off grid operations in the context of Burkina Faso.
11
4 Methodology
This section describes the methodology for a comparison of pumped hydro storage and electric batteries for the optimization of the solar PV plus storage systems. HOMER (Hybrid Optimization Model for Electric Renewable) was used for the techno-economic optimization of the system. HOMER is designed by National Renewable Energy Laboratory (NREL) for designing renewable hybrid systems and to assist in the comparison of different generation sources in terms of cost and technical parameters in a poly-generation system. It also provides a cost comparison of grid extension and off grid standalone systems, which is one of the requirements of the study.
The software has been extensively used in many studies for cost comparison for investment decisions in Africa some of which have been mentioned in detail in the literature review section [22]–[24], [26]. Unlike most time-series simulation software it reduces complexity by providing access to worldwide database for solar PV irradiation, the ability to design and choose industrially available components and the option to model pumped hydro as a storage along with other technologies [27].
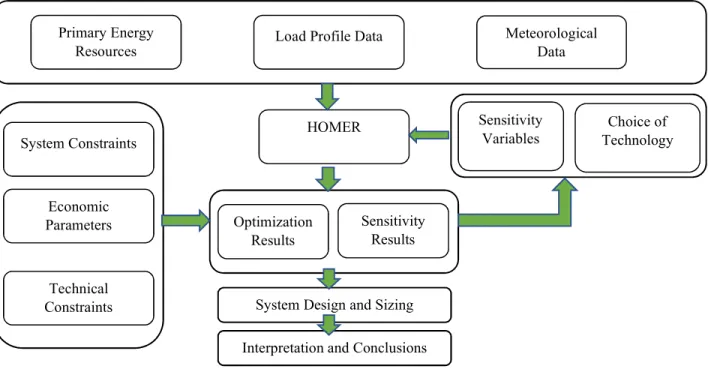
Figure 3 shows the input and flow of data for analysis adopted in this study. Initially, the primary energy resources (in this study solar energy, electric batteries and pumped hydro storage) are modelled based on their technical and economic parameters listed in Table 3. The meteorological data such as the geographic solar irradiation is exported from the NREL database and a time series input of load profile is fed into the system. After which optimization of the system architecture in terms of least cost and technical viability is performed. A number of sensitivity variables are identified based on the optimal configuration that have the most impact on the output. The system is then checked for robustness by varying these sensitivity parameters to assess the change in optimal configuration, after which a final system architecture is obtained. The results of are presented in section 5.1 and section 5.2.
The grid connected PV system with storage is studied for analyzing the feasibility of energy storage integration (either pumped hydro storage or electric batteries) for the urban case
Following configurations are modelled for grid connected case: i) Grid connected PV
ii) Grid connected PV + pumped hydro storage (PHS) iii) Grid connected PV + electric batteries
12
The off-grid PV system with storage mainly addresses the use of storage technologies with PV for rural applications such as remote villages. Since, in this case the PV arrays are not grid connected, this part of the study also deals with the economic comparison of grid extension break even points and explores the following configurations:
i) Solar PV + pumped hydro storage (PHS) ii) Solar PV + electric batteries
The steps followed in the methodology are explained in detail in section 4.1– 4.4.
For performing the analysis, load profile of the different consumers (rural and urban) as well as load profile for other energy usage was determined.
4.1 Load Profile Assessment
The load profile analysis was performed for the following two cases: 1. Urban Population (Grid Connected)
2. Rural Population (Off Grid)
Meteorological Data Primary Energy
Resources Load Profile Data
HOMER System Constraints Economic Parameters Technical Constraints Sensitivity
Variables Technology Choice of
System Design and Sizing Optimization
Results
Sensitivity Results
Interpretation and Conclusions
13
The urban and rural population load profile was further divided into residential and non-residential loads as shown in Figure 4.
Figure 4. Load Profile Components
4.1.1 Urban Load Profile
The urban profile in this study was modelled for the city of Ouagadougou, the capital of Burkina Faso which has a population of around 2.2 million and is the country’s largest city. The city receives an annual rainfall of about 800 mm which is spread over from May to October. The minimum average temperature in the cold season (December to January) is 16 degree Celsius. The maximum average temperature during the hot season (March to May) is about 43 degree Celsius. [28]
4.1.1.1 Residential Load Profile
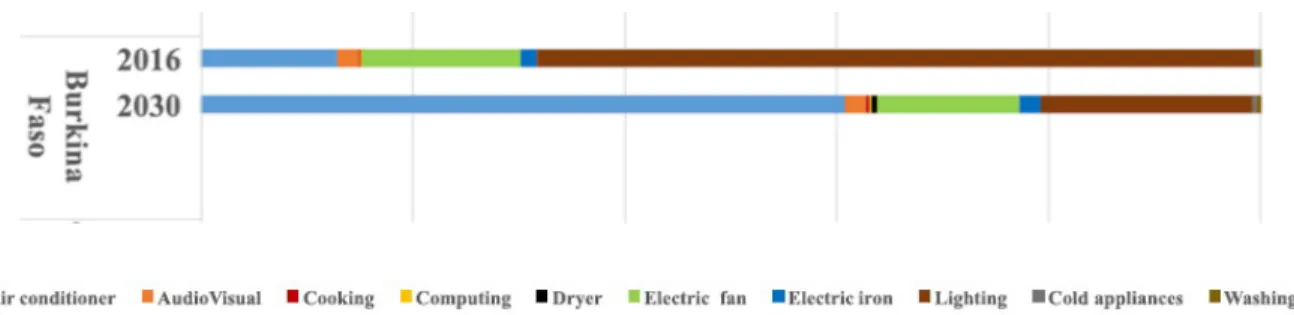
The electricity consumption for residential consumers is mostly dominated by lighting (60 %) with electric fans (20 %) and air conditioner (10%), the other miscellaneous consumptions are from washing and ironing for 2016 [2] as shown in Figure 5.
Figure 5. Residential Consumption in Burkina Faso [2]
The major challenge in estimating the load profile in developing countries is the lack of quality data as extensively discussed by Girona et al, [4]. However, studies such as done by Adeoye et al [2] that provide modelling and forecasting guidelines for hourly residential demand profile in West African countries provide realistic assumptions that can be used to model the residential urban and rural load demand profile.
14
Several studies have been performed to model hourly electricity demand for both developing and developed countries [15-17]. The relative error for the for the actual and forecasted electricity demand for 2013-2015 performed by Adeoye et al [2] ranges from (- 7% to 2 %).
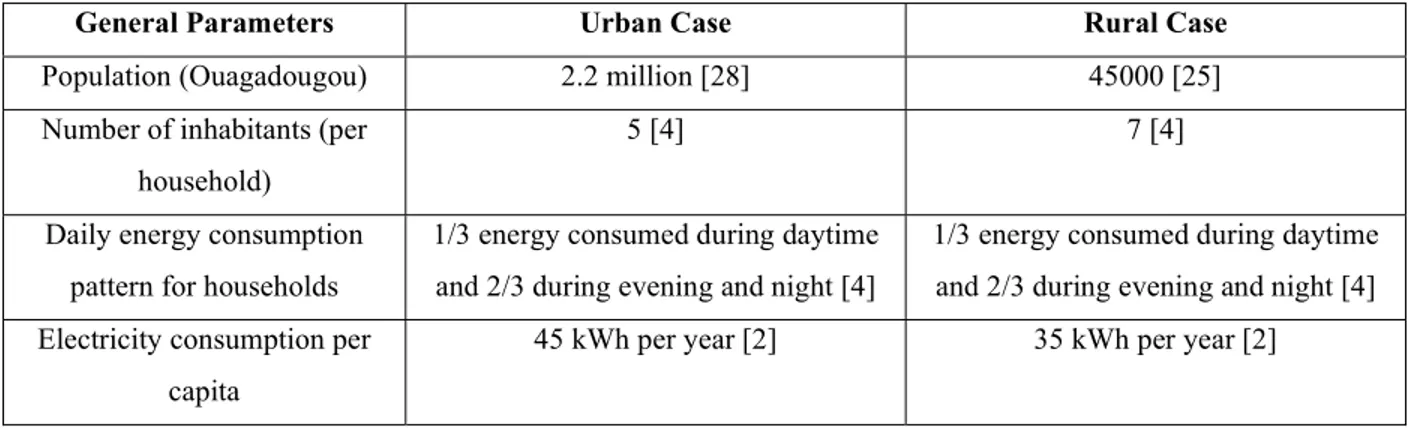
These models are typically based on behavioral, economic, social and weather data to model the electricity demand for households. In this study, to model the hourly electricity demand, the results from the bottom up analysis presented by [2] and the general parameters for social and economic factors listed in Table 1 were mainly used.
Table 1. Assumptions-Values for Load Profile Modelling
General Parameters Urban Case Rural Case Population (Ouagadougou) 2.2 million [28] 45000 [25] Number of inhabitants (per
household)
5 [4] 7 [4]
Daily energy consumption pattern for households
1/3 energy consumed during daytime and 2/3 during evening and night [4]
1/3 energy consumed during daytime and 2/3 during evening and night [4] Electricity consumption per
capita
45 kWh per year [2] 35 kWh per year [2]
There are mainly two seasons in the West African countries dry season and wet season. The seasonal variability analysis performed by Adeoye et al [2] for 2016 suggest little difference in the demand profile of both the seasons as shown in Figure 6.
Figure 6. Seasonal Variation of Electricity Consumption in Burkina Faso (2016) [2] This is mainly due to the low temperature variability during the two seasons as shown in Figure 7.
15
Figure 7. Yearly Temperature Variations in Ouagadougou [29]
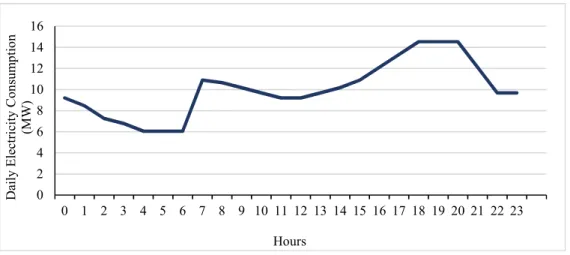
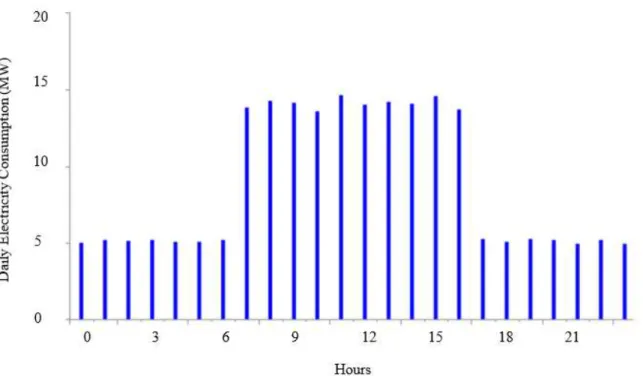
Hence, based on the general parameters mentioned in Table 1 and limited variability of seasonal effects the hourly residential urban residential load profile was modelled as displayed in Figure 8.
Figure 8. Urban Hourly Residential Electricity Load Profile (Author’s analysis, based on assumptions in Table 1, see Appendix A1)
0 2 4 6 8 10 12 14 16 0 1 2 3 4 5 6 7 8 9 10 11 12 13 14 15 16 17 18 19 20 21 22 23 D ai ly E le ct ri ci ty C on su m pt io n (M W ) Hours
16
4.1.1.2 Non-Residential Load Profile
The non-residential load in the urban profile consist of industrial, commercial and services demand sector as modelled by [2]. The overall non-residential load demand in the urban setting was synthesized using typical non-residential load profiles in the West African countries and the overall energy consumption [2]. The overall non-residential consumption in 2016 was found to be 720 GWh with a relative error of 1.1 % [2]. The per capita nonresidential demand was found to be 35 kWh per capita, and it is assumed that 2/3 of the energy is consumed during daytime and 1/3 is consumed during evening and night.
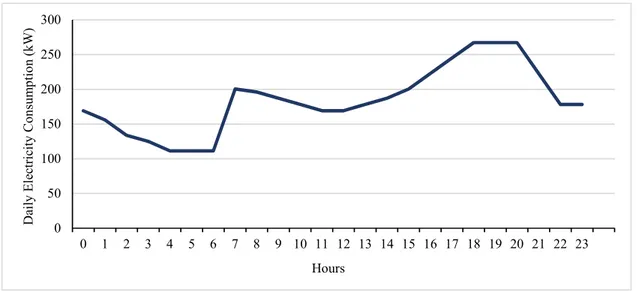
The synthesized residential profile for Ouagadougou is as shown in Figure 9, the average non-residential consumption is 210 MWh/day for a population of 2.2 million people with a peak demand of 24 MW.
Figure 9. Urban Non-Residential Daily Load Demand (Author’s analysis, based on assumptions in section 4.1.1.2)
17
4.1.2 Rural Load Profile
To model the rural load profile in the country, a village (Sabou) located at the South West of the country (21 12.0601° N, 2.2261° W) in the Boulkiemdé Province is considered.
4.1.2.1 Residential Load Profile
The village has 45,000 inhabitants and 6429 houses [25] assuming seven inhabitants per household [4]. The per capita electricity consumption in the rural household was found to be 35 kWh per capita per year [2]. The same consumption pattern as used in Table 1 for the residential load profile of urban areas was used and the residential rural load profile was modelled which is shown in Figure 10.
Figure 10. Rural Hourly Residential Electricity Load Profile (Author’s Analysis, see Appendix A1) The peak hours are in the morning and evening suggested due to a higher occupancy which is simply the probability of having more occupants at the same time during those times and the use of lighting, electric fans and water pumps [2]. The demand during the day remains relatively flat due to a lower occupancy. 4.1.2.2 Social Load Profile
Social load consumption here is regarded as the load for societal use such as health centers, public lighting etc. The parameters and assumptions considered for the social loads for a typical village in West Africa [4] are listed in Table 2.
0 50 100 150 200 250 300 0 1 2 3 4 5 6 7 8 9 10 11 12 13 14 15 16 17 18 19 20 21 22 23 D ai ly E le ct ri ci ty C on su m pt io n (k W ) Hours
18
Table 2. Social Load Assumptions [4]
Social Loads/Assumptions Values
Social Center 2 kW
Health Center 5 kW
Hospital 15 kW
Electricity consumption pattern for social loads
2/3 energy consumed during daytime and 1/3 during evening and night
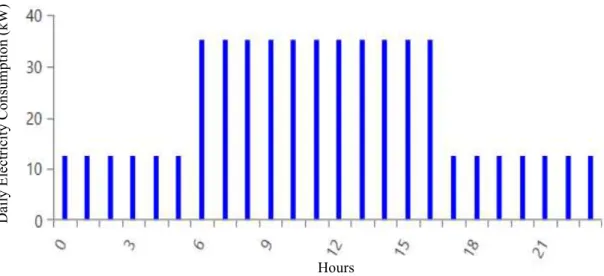
Figure 11 shows the daily values for a typical social load profile for the village, the average consumption is 550 kWh/day and the peak load is 62.55 kW.
Figure 11. Social Load Profile for Rural Village(Author’s Analysis based on Assumptions from Table 2)
4.2 System Configuration
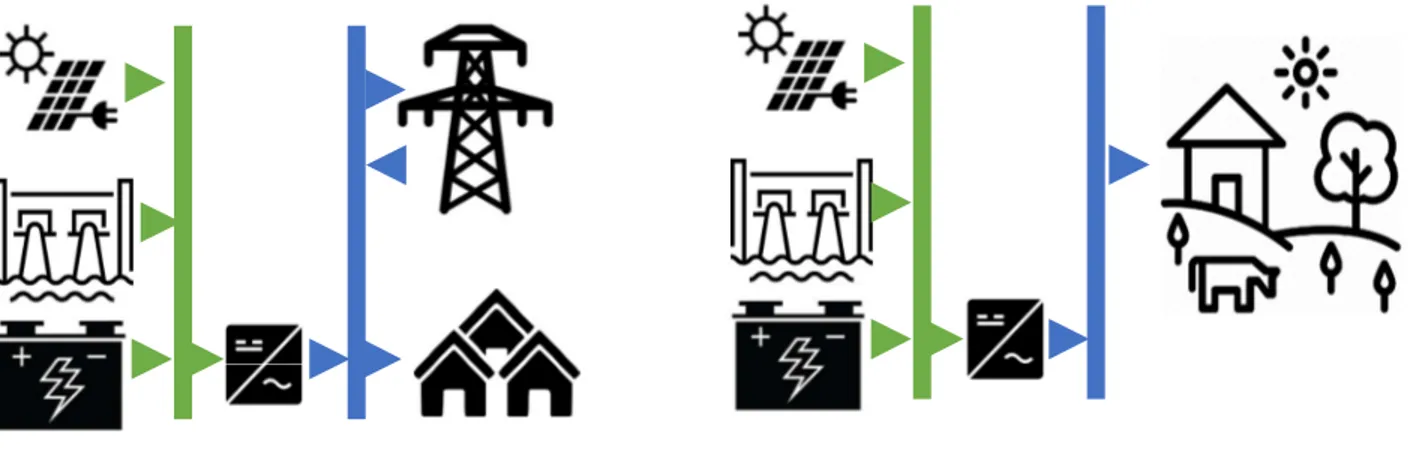
The system consists of a residential load and a non-residential load (social load in case of rural off grid architecture) connected to the PV array, storage devices (pumped hydro storage and electric batteries) and a converter system. The individual components are explained in detail in section 4.3. Figure 12 (a) shows the grid connected urban system architecture where the DC components (electric batteries, PHS and solar PV) are connected on the left whereas the AC grid and the AC residential and non-residential load is shown
Hours D ai ly E le ct ri ci ty C on su m pt io n (k W )
19
connected on the right side. Similarly, Figure 12 (b) shows the off grid rural system architecture, since the system is not grid connected, a grid connection is not shown. Both storages are shown connected to the DC grid however, in practice only one of them will be used based on the optimal design configuration.
Based on the system architecture in Figure 12, the system architecture for the all the scenarios of urban and rural cased are designed in HOMER. As mentioned in the scenarios, to analyze the feasibility of grid extension, the off grid rural system is shown connected with the grid. Figure 13 (a) shows the off-grid system architecture as modelled in the software and Figure 13 (b) shows the grid connected system architecture. These specifications are listed in Table 3 for the cost parameters and load values are taken based on the analysis performed in section 4.1.
Figure 13 (a). Off Grid System Architecture (HOMER) (b). Grid Connected System Architecture (HOMER) Figure 12 (a). Grid Connected Urban System Architecture (b). Off Grid Rural System Architecture
20
4.3 Component Specifications
This section provides information about the renewable energy resources modelled in the system. The individual components are expanded in their respective subsections (section 4.3.1 to section 4.3.5), whereas Table 3 provides a summary of some of the parameters used as inputs.
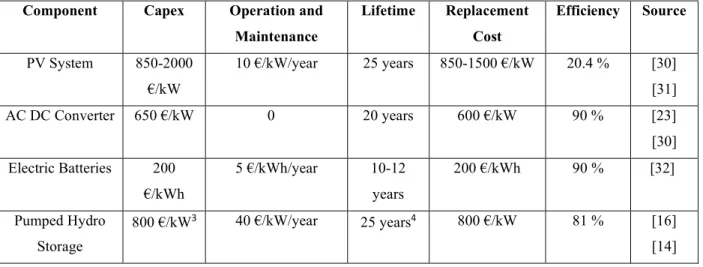
Table 3. Summary of Input Costs Parameters
Component Capex Operation and Maintenance Lifetime Replacement Cost Efficiency Source PV System 850-2000 €/kW 10 €/kW/year 25 years 850-1500 €/kW 20.4 % [30] [31] AC DC Converter 650 €/kW 0 20 years 600 €/kW 90 % [23] [30] Electric Batteries 200 €/kWh 5 €/kWh/year 10-12 years 200 €/kWh 90 % [32] Pumped Hydro Storage 800 €/kW3 40 €/kW/year 25 years4 800 €/kW 81 % [16] [14] 4.3.1 PV System
The PV system considered for modelling off grid studies was SPR-E20-327-C-AC mono-crystalline module manufactured by Sun-power [27]. The technical specifications of the system are listed in appendix B1. The cost range listed in Table 3, indicates the difference in capital costs of PV for community scale and utility scale PV. The lower value is for the utility scale classified by Lazard’s [30] for the capacity of (>5 MW) which was used in the modelling for the urban case grid connected utility scale PV in this analysis. The upper value is for the community scale classified by Lazard’s within the capacity of (1-5 MW) which was used for modelling the rural off grid case in the analysis. Understanding that the price of PVs change frequently, the report was used as a reference and a sensitivity analysis was also performed to see the change in the optimal configuration for both urban and rural cases. To reduce uncertainty a similar approach is used in the literature such as adopted by [23].
There is a significant capital cost difference between the utility scale grid connected system and the off-grid system, The capital cost considered for the utility scale PV is 850 €/kW whereas for a community scale
3 The capital cost here does not include excavation and construction costs for two new reservoirs which is discussed in detail in section 4.3.4
21
PV it is taken as 2000 €/kW as listed in Table 3. This difference is mainly due to the differences in the EPC (Engineering, Procurement and Construction) costs, developer overhead and net developer profit- all of which are termed as “soft costs” that are much lower for utility scale PV as compared to commercial scale PV as given by NREL cost benchmark Q1, 2018 report [33].
To account for real operating conditions as compared to the conditions under which the panel is originally rated, a derating factor of 0.95 was considered for the study and is used while evaluating operational efficiency of the panels in the analysis. The site-specific parameters such as the cost of land acquisition is not taken into account for this study.
4.3.2 Solar Energy Resource
The data values for solar radiation were downloaded from NREL National Solar Radiation Database at the coordinates of 12.3714° N, 1.5197° W (Ouagadougou, Burkina Faso). The annual solar radiation found to be 5.64 kWh/ while the average clearness index was found 0.6 indicating a high potential of solar energy generation through PVs. Figure 14 displays the average clearness index and solar radiation for different months.
Figure 14. Monthly Daily Average Solar Radiation and Clearness Index for Ouagadougou [34]
4.3.3 AC DC Converter
To ensure continuity of flow of energy between the DC components (solar PV, electric batteries, pumped hydro storage) and the AC components (grid, AC loads, a bi directional AC-DC converter is used. The capital cost, replacement cost, replacement cost and lifetime for 1 kW system are 650 €/kW, 600 €/kW and 20 years respectively [23], [30].
22
4.3.4 Pumped Hydro Storage
Pumped hydro storage is used to store excess electricity from the PV arrays at times of off- peak generation to meet the demand for the electric load, during periods of excess generation, the surplus PV power is used to pump water from a lower reservoir to an upper reservoir similarly energy is stored in the electric batteries at the time of excess generation. At times of a supply demand imbalance, water is allowed to run through a turbine producing electricity or alternatively energy is supplied through a battery. There are three major rivers in the country (Black Volta Red Volta and White Volta) with an estimated potential capacity of 138 MW. The longest one is the Black Volta (1,352 km), located in the south-west. Two other principal rivers, the White Volta and Red Volta, run north to south in the central plateau region. Planned future hydro projects are mostly located on the black Volta with a capacity of around 80 MW [18]. The city of Ouagadougou used in this study is located at a distance of 250 km from the Kompienga dam and gets most of its electricity from this hydro-electric power plant.
Where pumped hydro is a mature technology with a very long lifetime low self-discharge and a large storage capability [14], [15], it does have its own potential limitations. One of the major ones being the difficulty in identification of geographically suitable locations. Several propositions have been proposed in the literature to tackle this; like the use of old coal mines as reservoirs or the use of FLES (Flat Land Large Scale Electricity Storage) [35], [36]. FLES does not rely on natural relief and elevation to store gravitational energy but creates two artificial storage reservoirs. The proposition of PHS with no existing reservoirs is also proposed in the literature and cost estimates for excavation and civil works have been suggested. For example; one study by the “Oak Ridge National Laboratory, Sep 2016”[36], developed costs models for three test cases:
Test Case 1: New upper and lower reservoirs
Test Case 2: Refurbishment of upper and lower reservoirs Test Case 3: Existing upper and lower reservoirs
According to [36], the costs associated with developing new reservoirs come out to be (30 €/m3 ). This
includes costs of leveling and grading, drainage, erosion control, soil excavation, rock excavation and geomembrane. As mentioned in Table 3 the capital costs associated with PHS provided that there exists two storage reservoirs with an elevation of 100 meters and a storage capacity of 1000 cubic meters is 800 €/kW with a turbine efficiency of 81 %. When additional costs of constructing new reservoirs (upper and lower) are included, the capital costs increase massively by more than 400 % and the civil construction costs as a component of capital costs turn out to be almost 80 %. The results are formulated considering
23
that new reservoirs need to be constructed and based on the parameters listed in Table 3. The following parameters are not taken into account into this study that could potentially have an impact of the final costs. 1. Costs for construction of pipelines for the transportation of water from the available water bodies to the point of construction of PHS system in the case when two new reservoirs need to be constructed which could vary considerably based on the settlement taken for electrification. 2. Costs for land acquisition for the construction of PHS system.
4.3.5 Electric Battery Storage
Given the recent decline in the battery prices it is worthwhile to study the feasibility of comparison of batteries and pumped hydro as a storage. For this study, the economic parameters for “Infront of the Meter” battery applications for utility scale were considered and mainly based on the latest version of Lazard’s levelized cost of storage [32]. A single unit of 100-kWh of a Li-ion battery was used in the model whose capacity scales up as per the demand input of the model. Based on the least cost principle in combination with solar PV, the number of batteries and the quantity of storage that satisfies the load demand without capacity shortages was determined. The capital cost, replacement cost, operation and maintenance cost, lifetime and efficiency are 200 €/kWh, 200 €/kWh, 5 €/kWh/year 10 years, 90 % respectively [32].
4.4 Assessment Criteria
This section describes the main parameters on which different optimal configurations were compared for their feasibility.
4.4.1 Net Present Cost
The objective function is the minimization of cost of the whole system [37]. The model optimizes feasible system architectures for the given scenarios of rural and urban cases. The feasible configurations are ranked in terms of Total Net Present Cost (NPC). The NPC is the present cost of all the system costs incurred over its lifetime and is measured in euros. These costs include all capital costs, O&M costs, fuel costs, replacement costs and costs associated with buying electricity from the grid. The revenues include the salvage value and grid sales revenue [38]. The objective function is mathematically expressed in equation (1). The function is constrained by the inequalities (2) – (5):
𝑚𝑖𝑛(𝐶 , ) = −𝑅 , +
𝑅,
24
Subjected to the following constraints:
𝑃 ≤ 0.05 . 𝑃 (2)
𝑓 ≥ 0.15 . 𝐸 (3)
𝑟 , ≥ 0.10 . 𝑃 , (4)
𝑟 ≥ 0.10 . 𝑃 (5)
Where
R0 is the initial investment [€]
N is the project lifetime
Rt is the net cash flow for each component (i.e., revenues minus costs incurred) [€]
d is the discount rate [%]
i represents individual components Pshedding is the load not served [kWh]
fPV is the PV fraction [%]
Egen is the electricity generation [kWh/year]
rload,t is the input operating reserve as a percentage of load in the timestep t [%]
Pload,t is the load in timestep t [kWh]
rpeak load is the input operating reserve as a percentage of annual peak load [%]
The objective function focuses on the minimization of total net present cost which is the present value of all the costs the system incurs over its lifetime and is mathematically shown in equation (6) as follows:
𝑁𝑃𝐶 = 𝐶 _
𝐶𝑅𝐹(𝑑, 𝑁) (6)
Where
Cann_tot is the total annualized cost of the system. The annualized cost of a component is the cost that, if it
were to occur equally in every year of the project lifetime, would give the same net present cost as the actual cash flow sequence associated with that component.
CRF(d,N) is the Capital Recovery Factor
The total annualized cost of the system is as given in (7):
25
where
C
ann_cap,C
ann_rep, andC
ann_OandM are the annualized capital, replacement costs, and operationand maintenance costs of all components of the system respectively.
C
ann_fuel (the cost of fuels for thegenerators is considered zero in our case).
R
ann,salv represents the annualized total salvage value, that is the value remaining in a component of thepower system at the end of the project lifetime [38]. The salvage value is calculated as follows:
𝑅 _ = 𝐶 _ .
𝑁
𝑁 (8)
Where Nrem is the remaining life of the component in years at the end of the project which is given as:
𝑁 = 𝑁 − 𝑁 − 𝑁 (9)
Where N is the project lifetime [years] Ncomp is the component lifetime [years]
Nrep which is the replacement cost duration in years is given as:
𝑁 = 𝑁 . 𝐼𝑁𝑇 𝑁
𝑁 (10)
Where INT represents a function that returns the integer of a real number.
A Capital Recovery Factor (CRF) used in (6) converts a present value into a uniform annual cash flow series over the project lifetime (N) specified at discount rate (d) given in (11).
𝐶𝑅𝐹 = 𝑑(1 + 𝑑)
(1 + 𝑑) − 1 (11)
The discount rate in this project was taken as 5 % and a lifetime of 25 years was taken for this project in accordance with the West African Power Pool recommendations [4].
4.4.2 Levelized Cost of Energy
Levelized cost of energy which is one of the output decision variables with units in €/kWh is defined as the average cost per kWh of useful electrical energy produced by the system [38]. Cost of energy is also an important assessment criterion for the study given the very high cost of production of electricity in Burkina
26
Faso. However, the objective function is based on the minimization of NPC and COE is one of the outputs of the model which can be used in combination with NPC to decide the most optimal configuration. To calculate the COE, the annualized cost of producing electricity is divided by the useful energy that the system produces per year.
𝐶𝑂𝐸 = 𝐶 _
𝐸 + 𝐸 _ (12)
Where
Cann_tot is the total annualized cost of the system [€/year]
Eload is the total electrical load served [kWh/year]
Egrid_sales is the amount of energy sold to the grid per year [kwh/year]
4.4.3 Grid Extension
Due to very low electrification rate in the rural areas of Burkina Faso, grid extension break even distance is an important assessment criterion for the feasibility of a standalone system for a rural population [5], [39]. The breakeven grid extension distance (BGED) is the distance from the system to the grid at which the Net present cost of extending a grid from the nearest available distribution line and the standalone operation of the PV + storage are the same. The breakeven grid extension distance is calculated using equation (13).
𝐷 =𝐶 . 𝐶𝑅𝐹(𝑑, 𝑁) − 𝐶 . 𝐸
𝐶 . 𝐶𝑅𝐹(𝑑, 𝑁) + 𝐶 (13)
where:
CNPC is the total net present cost of the stand-alone power system [€]
CRF(d,N) is the capital recovery factor provided in equation (11) Edemand is total annual electrical demand [kWh/year]
Cpower is the cost of power from the grid [€/kWh]
Ccap is the capital cost of grid extension [€/km]
COandM is the operation and maintenance cost of grid extension [€/year/km]
If the settlement is located beyond this distance from the grid, then it makes economic sense to have the standalone system for the electricity needs of that settlement. The required input parameters for calculating the breakeven grid extension distance are the capital cost, O and M cost for the grid per km and the grid electricity price. The existing distribution grid network of Burkina Faso has a length of 3550 kms for 33
27
kV Medium voltage lines. There are plans to add another 6000 km of 33 kV lines to the existing network. [4]. The Economics of Renewable energy Expansion in Rural Sub Saharan Africa [40] gives an estimate of the capital cost for 33kV medium voltage line to be around 30,000 €/km or more. Also, since Burkina Faso faces constant capacity shortages, grid extension may trigger additional investments in the centralized system that would further increase the price of grid extension per km [5]. Considering this situation, the grid extension capital cost and operation and maintenance cost are considered as 40,000 €/km and 300 €/km. The grid electricity price is provided by the Power Africa Burkina Faso Fact Sheet [41] and is assumed as 0.1-0.3 €/kWh.
28
5 Results and Discussion
The results presented in this section are mainly divided in two parts, first the off-grid results for rural electrification are presented that include the optimization results, grid extension analysis and sensitivity analysis. The optimization results showcase all the system configurations that are technically feasible and give the lowest NPC as per the objective function in equation (1) subjected to constraints (2)-(5).
Later, the optimization results for grid connected urban load are discussed followed by the sensitivity analysis for the same.
5.1 Off Grid
This section describes the results for the off grid rural load with standalone PV and energy storage systems (pumped hydro or electric batteries).
First the optimization results are analyzed.
5.1.1 Optimization of System Architecture for Rural Consumers
After performing the simulation, a total of 1548 cases were simulated and 736 of them were found to be feasible, 812 were infeasible due to capacity shortage constraints and 360 were omitted for no sources of power generation. Ultimately, the two categories with the least Net Present Cost were found as listed in Table 4.
Table 4. Results of Off Grid Scenario Simulations5
Result Specification Parameter Unit Category 1 (PV+PH) Category 2 (PV+ Electric Batteries) System Architecture PV PHS Electric Battery Storage Converter MW MW MWh kW 1.7 1.4 0 665 2.2 0 14.9 906
29 Economic Specifications NPC Capital Cost COE € € €/kWh 10.1 Million 9.53 Million 0.4 12.3 Million 9.29 Million 0.4
The two categories are (PV+ PHS) and (PV + electric batteries) listed as category 1 and category 2 respectively. The optimized PV capacity to meet an AC load of 1.81 GWh/year for category 1 is 1.6 MW with a pumped hydro nominal storage capacity of 16 MWh and an AC-DC converter capacity of 665 kW. The net present cost breakdown by component for category 1 is shown in Figure 15 (a). The major portion of the cost is the capital cost of pumped hydro since these calculations were obtained considering the civil construction costs of lower and upper reservoirs. The capital cost of PV also adds 4.2 million euros of costs to the project NPC of 10 million euros over a lifetime of 25 years.
Figure 15 (b) shows the net present cost breakdown of category 2 (PV + electric batteries). Here the major component is the capital cost of PV of around 2.9 million euros. It is interesting to note that the cost of energy in both the cases is almost comparable.
Figure 15 (a). Net Present Cost Breakdown of Category 1 (1.7 MW Flat Plate PV and 1.4 MW PHS) by Component with additional costs of excavation
(b). Net Present Cost Breakdown of Category 2 (2.2 MW Flat Plate PV and 14.9 MWh Electric Battery Storage) by Component with additional costs of excavation
(a)
30
An analysis was also performed to analyze the change in optimal configurations provided geographical availability of upper and lower reservoir without considering the cost of artificially developing it. The summary of the results is given in Table 5.
Table 5. Results of Off Grid Scenario Simulations6
Result Specification Parameter Unit Category 1 (PV+PHS) Category 2 (PV+ Electric Batteries) System Architecture PV PHS Electric Battery Storage Converter MW MW MWh kW 1.6 1.4 0 523 2.2 0 14.9 906 Economic Specifications NPC Capital Cost COE € € €/kWh 6.15 Million 5.54 Million 0.25 12.3 Million 9.29 Million 0.4
The net present cost in case of category 1 drops by 4 million euros and category 1 comes out to be the optimal system configuration. Hence, making PV + PHS an obvious choice provided the geographical suitability of pumped hydro reservoirs. The major contribution in this case comes from the capital cost of PV in both the categories as shown in Figure 16 (a) and Figure 16 (b).
6 The results are calculated considering geographical availability of both reservoirs without additional costs of excavation
31
Figure 16 (a). Net Present Cost Breakdown of Category 1 (1.6 MW Flat Plate PV and 1.4 MW PHS) by Component without additional Costs of Excavation
(b). Net Present Cost Breakdown of Category 2 (2.2 MW Flat Plate PV and 14.9 MWh Electric Battery Storage) by Component without Additional Costs of Excavation
5.1.2 Grid Extension Breakeven Distance
As discussed earlier, grid extension breakeven distance is an important criterion to assess the feasibility of an autonomous system. For the standalone PV+PH system (category 1) for a village population of 45,000 the breakeven grid extension distance comes out to be around 115 km as shown in Figure 17 (a).
(a)
32
Figure 17 (a). Breakeven Grid Extension Distance for Category 1 (1.7 MW Flat Plate PV and 1.4 MW PHS) with Additional Costs of Excavation
The breakeven grid distance for PV + electric batteries (category 2) is much higher i.e. 160 kms; Figure 17 (b).
Figure 17 (b). Breakeven Grid Extension Distance for Category 2 (2.2 MW Flat Plate PV and 14.9 MWh Electric Battery Storage) with Additional Costs of Excavation
33
Figure 17 (c). Breakeven Grid Extension Distance for Category 1 (1.6 MW Flat Plate PV and 1.4 MW PHS) without Additional Excavation Costs
These distances are calculated considering costs of excavation of both upper and lower reservoirs. If these costs are neglected considering geographic availability of upper and lower reservoirs the BGED is estimated to be 25 km as shown in Figure 17 (c).We can see from these results that it becomes increasingly more feasible to have a standalone system for remote areas that have geographical availability for a PHS system. In case both the reservoirs have to be constructed; the population needs to be a much greater distance (100 kms -160 kms) from the grid connection. The sensitivity analysis of the next section analyses how this distance varies with the local population of the settlement which provides a general framework to assess the economic feasibility of standalone systems.
5.1.3 Sensitivity Results
Sensitivity analysis provides a good understanding of the robustness of a model. Given the continuous trend of decrease in PV prices and considering that the capital cost of PV is the major component of NPC in all cases, a sensitivity analysis on the capital cost of PV prices was performed with cost multipliers of 0.25, 0.5, 0.75 and 1, and subsequently the effect was observed on the change in Net Present Cost and Cost of Energy as shown in Figure 18. It can be seen that the NPC of the project almost decreases by a half with the decrease in PV capex by 1/4th of the present price.
34
Figure 18. Sensitivity of COE and NPC with respect to PV Capital Cost
Figure 19 shows how the NPC evolve with the change in demand. Where Table 6 shows the residential load demand of a settlement with their corresponding population and BGED. It can be seen that the NPC and PV capacity decrease exponentially with the decrease in demand.
35
A sensitivity analysis for the breakeven grid extension distance was also performed with varying population sizes to analyze the feasibility of standalone system in terms of cost for different sizes of rural settlements. This would give us insights on how BGED can be used to asses grid extension feasibility for varying rural populations. The optimal system with varying population remains the same i.e. PV + PHS.
BGED is provided in Table 6 for the same.
Table 6. Average Load Demand with Corresponding Population and BGED Scaled Average Load Demand per
settlement(kWh/day)
Population Breakeven Grid Extension Distance (km) 4315 45000 115.29 2100 22500 67 1000 11250 41 500 5625 26.63 276.375 2812.5 19.44
The results are displayed in Figure 20. It is observed that it becomes more feasible to have a standalone system for a population of less than 6000 inhabitants that are at least 26 kms away from the nearest grid.
Figure 20. Sensitivity of BGED by Population Size
0 20 40 60 80 100 120 140 0 10000 20000 30000 40000 50000 B re ak ev en G ri d E xt en si on D is ta nc e (k m ) Population Size
36
5.2 Grid Connected
This section analyzes the results of the grid connected utility scale PV with storage options (PHS or electric batteries) for an urban load profile. First the optimization results for the system architecture for the least net present cost are presented followed by a sensitivity analysis of NPC and PV capacity demand with changing PV capital cost.
5.2.1 Optimization of System Architecture for Urban Consumers
The grid connected optimization results are compiled in Table 7. Here optimization refers to the system configurations that are objective function given by equation (1). The results optimized are mainly divided into three categories based on least net present cost comparison.
Category 1 (PV+ PH+ Grid) being the cheapest option of all. Category 3 (Grid Only) which has a high NPC because of very high cost of energy in Burkina Faso is also presented that justifies the need for PV production unit to drive down cost of energy. It is interesting to note that the NPC of the project decreases by a mere 8 % from 352 million euros to 323 million euros by the addition of storage over a lifetime of 25 years. Also, there is a higher renewable fraction7 of 88.3% as compared to 48.6% for category 2 since less
energy has to be purchased from the grid to meet the load demand, and most of the energy generated on grid in Burkina at present is through fossil fuels. Since for this model, the costs of land acquisition are not taken into account and there might be other costs associated with pumped hydro storage that are site specific, the high capital investment of 236 million euros for category 1 as compared to 80 million euros for category 2 might not be justified. However, given that the current COE in Burkina Faso is quite high, an addition of 71 MW of PV capacity (category 2) with an initial capital of 80 million euros, decreases the NPC by 25 % as compared to category 3 (grid only).
7 Renewable fraction is the fraction of the energy delivered to the load that originated from renewable power sources
37
Table 7. Optimization Results for Grid Connected Simulations
Result Specifications
Parameter Unit Category 1 (PV+PH + Grid) Category 2 (PV + Grid) Category 3 (Grid Only) System Architecture PV PH Batteries Li-Ion Converter MW MW MWh MW 136 26.9 0 29 71 0 0 29.4 0 0 0 0 Economic Specifications NPC Capital Cost COE Renewable Fraction Grid Purchases € € €/kWh % GWh 323 Million 236 Million 0.129 88.3 20 352 Million 80 Million 0.1 48.6 92 471 Million 0 0.2 0 167
Figure 21 shows the cost breakdown of category 1 system architecture which is the least net present cost system. Like the off-grid situation, the main component is the capital cost for generic flat plate PV and PHS.
Figure 21. Net Present Cost Breakdown of Category 1 (136 MW Flat Plate PV and 26.9 MW PHS) by component
5.2.2 Sensitivity Results
A sensitivity analysis of the price of the PV was performed to see the effect on NPC and PV capacity. Figure 22 shows the change in NPC and PV capacity demand with the change in capital price. It is seen that the least net present cost system architecture remains the same i.e. category 1 (PV + PH + Grid) and with the decrease in PV prices, more PV could be incorporated into the system that optimizes the cost and reduces the NPC of the system. This seems plausible as shown in Figure 22 that the main component of NPC is the capex price of PV system.
38
Figure 22. Sensitivity Analysis of PV Capital Cost on NPC and PV Capacity
Like the case for off grid, a sensitivity analysis was performed for varying the urban population to see the effects on change in system architecture with the least net present cost model. Table 8 below shows the varying residential and non-residential loads with their corresponding population.
Table 8. Varying Urban Loads with Population Residential Average Load Demand
(kWh/day)
Non-Residential Average Load Demand (kWh/day) Population 247565 210664 2.2 million 123782.5 105332 1.1 million 61891.25 52666 0.5 million 30945.625 26333 275000 15472.8125 13166.5 137500 7736.40625 6583.25 68750
For all the cases, the least net present cost system architecture comes out to (PV+PH). The total NPC and PV capacity increase exponentially with the increase in load demand as shown in Figure 23.
39
Figure 23. Varying PV Capacity and NPC with Load Demand
The results presented above for both urban and rural case depend considerably on the input parameters like population, location, cost parameters, project lifetime, system architecture hence there are no similar studies in the literature that showcase exactly the same analysis. The present study is compared with other studies for observing the COE of different configurations of energy technologies performed for Burkina Faso and SSA. Ouedraogo et al (2015) [42] looks into PV/diesel hybrid model for a standalone system in Burkina Faso and found that the COE of the system was 0.45 €/kWh, whereas COE in the present study is for off grid standalone system for (PV plus electric batteries) is 0.4 €/kWh which is quite similar. Also, form table 9, it is observed that the range of COE is 0.25-0.69 €/kWh depending on the technologies considered for system configuration.
Table 9. COE comparison of different studies
Study System Architecture COE (€/kWh)
Our study Off grid solar PV + electric
batteries
0.4
Our study Off grid solar PV + PHS 0.25
Bachir I. Ouedraogo et al. 2014 [42]
Off grid solar PV + diesel generator
0.45 Bachir I. Ouedraogo et al. 2014
[42]
Standalone diesel generator 0.69 Sara Ghaem Sigarchian et al.
2015 [23]
Off grid solar PV + wind + biogas generator
0.25
Nasser Yimen et al. 2018 [27]
Off grid solar PV + bio-gas generator
40
5.3 Policy Implications
The present policy of rural electrification in Burkina Faso is mainly dominated by a potential increase in centralized generation capacity and grid extension [43]. This study suggests that along with strengthening the national grid, future policies should also focus more on decentralized standalone systems especially for far off rural areas. In doing so, the rate of electrification in the country could be increased at a lower investment cost. Storage is a key component for standalone systems[5], [42] and should be a part of the future policy design. The Joint Research Center (JRC) by the European Commission also suggests that smaller local electrification projects based on indigenous sources in the long term are expected to be more feasible than centralized ones based on fossil fuels [5]. The potential barriers for practical implementation are high investment costs associated with capital cost of PV and geographical constraints on part of pumped hydro for large storage demand in urban cases. It can be seen from the results for both the urban and the rural case that the capital cost of PV is the most dominating factor in terms of net present cost for the whole system. In house production of solar panels and directing fossil fuel subsidies as investments as also suggested by Ouedraogo et.al [44] in Burkina Faso could also potentially have a huge impact on costs of electrification as shown by the sensitivity analysis. Burkina Faso is currently setting up a regulatory framework for the purchase of electricity from the IPPs [45], rapid unbundling of the energy sector and effectively attracting private investments should also be prioritized along with subsidies favorable for financing PVs to reach the target of 95 % electrification by 2030.
5.4 Limitations and Future Work
Additional studies need to be performed to address the limitations in this study, one being the identification of potential sites for geographical availability of elevated reservoirs for pumped hydro storage due to unavailability of data. A GIS modelling of the country to locate prospective sites could be performed such as performed by Lu et.al [46] for south Australia. The results from GIS modelling in combination with the break-even grid extension distance simulations from this study could provide a much useful insights for deployment of off grid solar plus storage solutions. Additionally, the site-specific parameters such as costs for land acquisitions, costs of pipelines for water supply to off grid settlements are not included that might impact the results for individual settlements. The scope of this study was limited to only two storage technologies with solar PV, future studies that look into other renewable electricity systems like PV plus biomass generation in the context of Burkina Faso could prove to be of great value. Lack of accurate data for cost models for the specific context of Burkina Faso is another limitation of the study. Provided the data becomes available, the results could be further improved to better fit the local context in future. Accurate load profile estimation is of great value in sizing and designing a power supply system.
41
6 Conclusion
The study finds the need of extended solar penetration in Burkina Faso in response to the challenges of low electrification rates in the country. It is seen that for grid connected systems, adding storage reduces the net present cost of the system by 8 % as compared to grid connected PV. The mere decrease in 8 % reduction of NPC over a lifetime of 25 years does not provide enough motivation with the present conditions, as other factors like the costs of land acquisition still need to be considered. The costs of deploying storage could be further reduced if future policies allow mechanisms such as energy arbitrage that allow stacking of energy storage benefits and revenues. However, the study finds a definite need to add more solar energy to the present electricity mix of Burkina Faso. It is found that adding grid connected solar PV in an urban setting could reduce the cost of energy by half, making cheap electricity available for the local population and reducing the need of fossil fuel production. It would also increase the renewable fraction by more than 48%. The results for off grid scenarios indicate a grid extension breakeven distance of more than 26 kms for a population of less than 6,000 people using storage plus PV. Electric batteries remain quite expensive to be competitive with pumped hydro when new reservoirs need not be constructed, owing to high capital cost of batteries and a low lifetime. However, the costs increase drastically for PHS when excavation and civil construction costs are added for new reservoirs. The sensitivity analysis indicates that driving the capital costs of PV has the most positive effect on driving down the net present costs of both urban and rural cases. A support system that complements the capital cost of PV would prove to have the most effect on lowering the costs of electrification in Burkina Faso.
42
7 References
[1] World Bank, “World Bank Open Data,” ID:EG.ELC.ACCS.ZS, 2017. [Online]. Available: https://data.worldbank.org/indicator/EG.ELC.ACCS.ZS. [Accessed: 08-Nov-2019].
[2] O. Adeoye and C. Spataru, “Modelling and forecasting hourly electricity demand in West African countries,” Appl. Energy, vol. 242, pp. 311–333, 2019.
[3] World Bank, “World Bank Open Data,” ID: EG.ELC.ACCS.UR.ZS, 2017. [Online]. Available: https://data.worldbank.org/indicator/EG.ELC.ACCS.UR.ZS?locations=BF. [Accessed: 08-Nov-2019].
[4] M. Moner-Girona, K. Bódis, T. Huld, I. Kougias, and S. Szabó, “Universal access to electricity in Burkina Faso: Scaling-up renewable energy technologies,” Environ. Res. Lett., vol. 11, no. 8, pp. 1–15, 2016.
[5] M. Moner-girona, Mapping the least-cost option for rural electrification in Burkina Faso, no. June. 2017.
[6] SE4all, “SE4all Africa Hub.” [Online]. Available: https://www.se4all-africa.org/seforall-in-africa/country-data/burkina-faso/. [Accessed: 08-Nov-2019].
[7] SE4all, “ECOWAS SE4ALL Network.” [Online]. Available:
http://www.se4all.ecreee.org/content/burkina-faso. [Accessed: 08-Nov-2019].
[8] TRACTEBEL, “Update of the ECOWAS revised master plan for the development of power generation; Priority Investment Program and Implementation Strategy,” vol. 5.
[9] West African Power Pool, “ECOWAS Master Plan for the Development of Regional Power Generation and Transmission Infrastructure,” Africa Energy Forum, 2019.
[10] UNEP, “Green Fiscal Policy Network.” [Online]. Available:
http://www.greenfiscalpolicy.org/countries/burkina-faso-country-profile/. [Accessed: 08-Nov-2019].
[11] PV Magazine, “Burkina Faso announces plan to build eight solar parks,” 2018. [Online]. Available: https://www.pv-magazine.com/2018/01/26/burkina-faso-announces-plan-to-build-eight-solar-parks-totaling-100-mw/. [Accessed: 08-Nov-2019].
43
[12] Clean Energy Wire, “Journalism for Energy Transition,” 2019. [Online]. Available: https://www.cleanenergywire.org/news/germany-ranks-fourth-installed-solar-pv-capacity. [Accessed: 08-Nov-2019].
[13] “Electrochemical energy storage in energy storage.” [Online]. Available: Electrochemical energy storage in energy storage. [Accessed: 08-Nov-2019].
[14] P. Deane and B. Ó. Gallachóir, “Pumped Hydro Energy Storage,” Handb. Clean Energy Syst., pp. 1–16, 2015.
[15] IRENA, “Renewable Energy Technologies: Cost Analysis Series,” Green Energy Technol., vol. 20, no. 5, pp. 231–256, 2012.
[16] E. Barbour, I. A. G. Wilson, J. Radcliffe, Y. Ding, and Y. Li, “A review of pumped hydro energy storage development in significant international electricity markets,” Renew. Sustain. Energy Rev., vol. 61, pp. 421–432, 2016.
[17] IEA, “Analysis from Renewables 2018,” 2018. [Online]. Available:
https://www.iea.org/newsroom/news/2019/march/will-pumped-storage-hydropower-capacity-expand-more-quickly-than-stationary-b.html. [Accessed: 08-Nov-2019].
[18] United Nations Industrial Development Organization, “World Small Hydropower Development Report,” pp. 1–44, 2016.
[19] World Bank, “Accelerating Battery Storage for Development,” 2018. [Online]. Available: https://www.worldbank.org/en/topic/energy/brief/battery-storage-program-brief. [Accessed: 08-Nov-2019].
[20] G.B. Shrestha, “A study on optimal sizing of stand-alone photovoltaic stations,” IEEE Trans. Energy Convers.
[21] D. Chattopadhyay, N. Frydas, T. Kramskaya, and E. Tavoulareas, “Battery storage in developing countries: Key issues to consider,” Electr. J., vol. 32, no. 2, pp. 1–6, 2019.
[22] E. M. Nfah and J. M. Ngundam, “Feasibility of pico-hydro and photovoltaic hybrid power systems for remote villages in Cameroon,” Renew. Energy, vol. 34, no. 6, pp. 1445–1450, 2009.
![Figure 14. Monthly Daily Average Solar Radiation and Clearness Index for Ouagadougou [34]](https://thumb-eu.123doks.com/thumbv2/5dokorg/4274001.94912/24.918.203.716.595.840/figure-monthly-daily-average-solar-radiation-clearness-ouagadougou.webp)
