https://www.scirp.org/journal/ojg ISSN Online: 2161-7589
ISSN Print: 2161-7570
DOI: 10.4236/ojg.2021.113004 Mar. 1, 2021 49 Open Journal of Geology
Source Rock Evaluation and 1-D Basin
Modelling Approach for the Sargelu Formation,
Atrush-2 Well, Kurdistan Region-Iraq
Revan Akram1, Ayad N. F. Edilbi2, Wrya J. Mamaseni3, Govand H. Sherwani4, Nadhir Al-Ansari5* 1Department of Petroleum Technology, Erbil Polytechnic University, Kurdistan Region, Iraq
2Department of Petroleum Geosciences, Faculty of Science, Soran University, Kurdistan Region, Iraq 3Department of Geology, Salahaddin University, Erbil, Kurdistan Region, Iraq
4Department of Civil Engineering, Cihan University-Erbil, Erbil, Kurdistan Region, Iraq 5Lulea University of Technology, Lulea, Sweden
Abstract
The present study focuses on source rock evaluation of the Sargelu Formation by using core chips of rocks collected from well Atrush-2, Duhok, Kurdistan Region-Iraq. The Rock-Eval pyrolysis and vitrinite reflectance were executed. Subsequently, the selected parameters were used for source rock evaluation and 1-D Basin Modelling calibration. The upper part of the formation mainly comprises argillaceous limestone with low content of organic matter (0.64% - 1% TOC). By contrast, the lower part is dominated with shale interval and contains high amounts of TOC values (>4% for 1272 - 1278 m) reveling good to very good quality source rock. Accordingly, good to very good hydrocar-bon generation potential is suggested for this formation. Organic matter of the Sargelu Formation contains type II and mixed-type II-III kerogen. The values of Tmax and vitrinite reflectance (Ro%) demonstrate that the forma-tion is thermally mature and in the oil zone. In order to construct a thermal history of the formation and determine the timing of hydrocarbon matura-tion and generamatura-tion, the 1-D basin modelling PetroMod 2019.1 was used in this study. Based on the 1-D Basin modelling simulation and its outputs, about 3500 m of overburden have been eroded at the study area. The present-day heat flow was found to be 30 mW/m2. The organic matter of
Sargelu Formation entered the early oil zone in 64 Ma and reached the main oil zone ca. 5 Ma. The formation is still in the main oil zone at present-day. In well Atrush-2, the highest rate of oil generation for the Sargelu Formation was in the 8.5 Ma, the onset of oil expulsion from Sargelu Formation was in 50 Ma and the expulsion mass has been reached 0.5 Mtons at present-day.
How to cite this paper: Akram, R., Edilbi, A.N.F., Mamaseni, W.J., Sherwani, G.H. and Al-Ansari, N. (2021) Source Rock Eval-uation and 1-D Basin Modelling Approach for the Sargelu Formation, Atrush-2 Well, Kurdistan Region-Iraq. Open Journal of Ge-ology, 11, 49-60.
https://doi.org/10.4236/ojg.2021.113004
Received: January 21, 2021 Accepted: February 26, 2021 Published: March 1, 2021
Copyright © 2021 by author(s) and Scientific Research Publishing Inc. This work is licensed under the Creative Commons Attribution International License (CC BY 4.0).
http://creativecommons.org/licenses/by/4.0/ Open Access
DOI: 10.4236/ojg.2021.113004 50 Open Journal of Geology
Keywords
Sargelu Formation, Source Rock, Well Atrush-2, 1-D Basin Modelling, Iraq
1. Introduction
The Mid-Late Jurassic megasequence was deposited during a period of isolation of main intra-shelf basin of Mesopotamia, the base of this megasequence with deposition of the Sargelu and Muhawir formations in Rutbah subzone [1]. The oil fields of North Iraq are considered to be part of the Zagros Fold Belt [2]. The Atrush Oil Field is located northeast of Duhok City in Iraqi Kurdistan Region. Herein, this block is one of the biggest and challenging oil developments in the area. According to the Iraqi tectonic division, the study area (well Atrush-2) is located within the High Folded Zone (Figure 1). The Sargelu Formation was first recognized and described by Wetzel in 1948 [3] from Surdash Anticline of the High Folded Zone of NE Iraq. In its type section, this formation comprises 115 m of thin-bedded, black, bituminous and dolomitic limestone and black shale, and it was deposited in euxinic marine environment [4]. In well Atrush-2, the total thickness of the formation is 40 m (1250 - 1290 m), and it is mainly composed of dark grey argillaceous limestone interbedded with black shale in the lower part (Figure 1). Abdula et al. [5] defined three microfacies in this for-mation, namely; mudstone, wackestone and packstone. The first requirement of a play is a potential source rock, where a play is a model of how a petroleum charge system, reservoir, trap may contribute in producing petroleum. The Mid-dle-Upper Jurassic succession contains some of the world’s major hydrocarbon systems [6]. Moreover, Pitman et al. [7] and Sachsenhofer et al. [8] believe that
DOI: 10.4236/ojg.2021.113004 51 Open Journal of Geology
(b)
Figure 1. (a) Tectonic division of Iraq showing location of the study area (modified after [1]). (b) Lithological column of the Sargelu formation at well Atrush-2, based on well da-ta.
the most common and important source rocks in the Zagros Fold Belt can be the Sargelu and Naokelekan formations. The Type II-S, and mixture of II-III kero-gens were suggested for this formation by many authors [2] [9] [10] [11] [12] [13]. The goal of this study is new interpretations via geochemical screening method that leads to source rock evaluation and 1-D Basin modelling to estimate the time of onset of petroleum maturation, generation and expulsion in Atrush Oil Field.
DOI: 10.4236/ojg.2021.113004 52 Open Journal of Geology
2. Materials and Methods
2.1. Rock-Eval PyrolysisRock-Eval Pyrolysis is considered as a reliable geochemical screening method which provides information on the quality, quantity, and thermal maturity of the organic matter in a sample [14]. In this study, five core plugs of argillaceous limestone and shale intervals from well Atrush-2 (depth 1251 - 1278 m) were analyzed through Rock-Eval 6 Pyrolysis at GH Geochem Laboratory, Birken-head, United Kingdom. The sum of 100 mg from each sample was crushed and heated up to 850˚C in the absence of oxygen to obtain the analytical parameters. The S1, S2, S3, Tmax parameters were directly measured during pyrolysis, while other parameters, such as TOC, HI, OI, and PI, were calculated from the meas-ured parameters (Table 1).
2.2. Vitrinite Reflectance
Vitrinite reflectance stands as excellent method for characterization of the state of organic matter maturity [15]. The samples were taken from core chips and analyzed from depth 1251 - 1278 m, at GH Geochem Laboratory, Birkenhead, United Kingdom. The measurements of vitrinite are based on the amount of in-cident light reflected from the vitrinite group (Table 1). The whole-rock speci-men is compressed and embedded in resin and then polished while processing samples for the study of vitrinite reflectance. In this case, numerous microlitho-types and their relationship to the organic matter deposited within the matrix are more readily seen. The reflectance measuring equipment connected to the microscope (Leica DFC 350FX digital camera at Brock University) during the study tests, the percentage of white light reflected from polished vitrinite par-ticles, and the findings are recorded as Ro% for each sample over an average of around 50 measurements.
Results are plotted against other Rock-Eval parameters (e.g. HI), and were
Table 1. Results of Rock-Eval pyrolysis and Ro% of the Sargelu formation in well Atrush-2. Sample ID Depth (m) TOC % S1 S2 S3 T max (˚C) HI OI PI PP (%) Ro S-1 1251 1.00 0.08 1.92 0.27 435 192 27 0.04 2.0 0.55 S-2 1256 0.64 0.13 2.41 0.3 431 377 47 0.05 2.5 0.65 S-3 1272 4.08 0.45 33.99 0.35 443 833 9 0.01 34 0.66 S-4 1275 5.00 0.9 26.48 0.14 443 530 3 0.03 27 0.68 S-5 1278 4.98 1.01 25.56 0.31 441 513 6 0.04 27 0.88 Average 3.14 0.51 18.07 0.27 439 489 18 0.03 18 0.68 Abbreviations: S1: Volatile hydrocarbon (HC) content, mg HC/g rock; TOC: Total Organic Carbon, %. S2: Remaining HC generative potential, mg HC/g rock; PI: Production Index = S1/(S1 + S2). Tmax: Tempera-ture at maximum of S2 peak; P.P: Petroleum Potential Yield = S1 + S2 (mg HC/g rock). HI: Hydrogen In-dex = S2 × 100/TOC, mg HC/g TOC; Ro (%) = Vitrinite Reflectance.
DOI: 10.4236/ojg.2021.113004 53 Open Journal of Geology
used as maturity indicator for well AT-2. Besides, the values of vitrinite made a reliable calibration tool while constructing 1-D basin modelling.
2.3. 1-D Basin Modelling
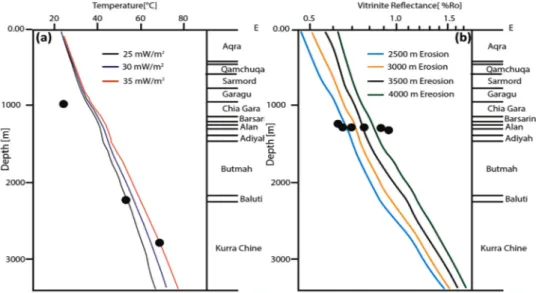
The burial and thermal history of Sargelu Formation was reconstructed and modelled using PetroMod 1-D version 2019.1 of Schlumberger. The stratigraph-ic succession in the studied well starts with the outcropping Upper Cretaceous Aqra Formation, on top, and down to the Upper Triassic Kurra Chine Forma-tion in the bottom. Moreover, fourteen deposiForma-tional events, two unconformities and one erosional event were inserted in the field of main inputs. The age and event of each formation were taken from Bellen et al. [3], Jassim and Goff [1], English et al. [16] Edilbi [17]. To obtain reasonable results, the mixed lithologies of each rock unit were edited in tool of Lithology Editor. Palaeo-water depth (PWD), temperature at the sediment water interface (SWIT) and Palaeoheat flow (PHF) are the three important boundary conditions that were used in mod-elling. In this procedure, Palaeo-water depths were set based on the nature of the lithologies of each formation and literature reviews, for example Aqrawi and Badics [18], and Edilbi [17]. The temperature at the sediment-water interface (SWIT) was set as paleo-latitude of Middle East, and latitude 38, using the available information on global mean temperature at sea level of Wygrala [19]. The Palaeoheat flow (PHF) were set based on the tectonic history of the study area through geological time [1] [4] and heat flows associated with different tec-tonic styles of basin formation of Allen and Allen [20]. To determine the present-day heat flow, three models were tried and a present-day HF of 30 mW/m2 (Figure 2(a)) was recognized as the best match to BHT. Due to erosion
Figure 2. (a) Model calibration by matching measured and modelled temperatures for Well Atrush-2. The best match is from present-day heat flow of 30 mW/m2. (b) Model calibration by
comparing measured and modelled Vitrinite Reflectance in well Atrush-2. In these scenarios, dif-ferent amounts of the eroded sediments were considered in which the best match was achieved by adding 3500 m sediments.
DOI: 10.4236/ojg.2021.113004 54 Open Journal of Geology
of huge overburden in the studied area, the eroded sediments should be restored before simulation the model. Thus, to estimate the amount of missing overbur-den, different amounts of eroded sediments were tested and modelled. Conse-quently, 3500 m of erosion were added to satisfy the best fit between calculated and measured values (Figure 2(b)). The conductivity of the rock units was ob-tained from lithological information available in PetroMod.
3. Results and Discussion
3.1. Source Rock AssessmentA potential petroleum source rock is referred as any rock that has the compe-tency to generate and expel sufficient amounts of hydrocarbons to form an ac-cumulation of oil and gas [21]. The source rock evaluation of sedimentary rocks is mainly based on the type and content of organic matter with its thermal ma-turity. The quantity of organic matter in sedimentary rocks can be defined as to-tal organic carbon (TOC%) that is widely used to evaluate petroleum potential of a source rock especially when plotted against other parameters [22]. The mini-mally acceptable TOC for a potential source rock is 0.5% - 1% [15] [22] [23] [24]. The upper part of the Sargelu Formation which is mainly comprised of ar-gillaceous limestone, contains less amount of organic carbon which ranges from 0.64% - 1%, while the lower part, which is shale dominant, comprises high TOC values (avg. > 4%). Based on the TOC (%) content, the formation has a good to very good organic matter richness. The plot of HI versus Tmax or Ro% can be used to determine the kerogen quality and maturity rather than Pseudo-Van Krevelen diagram (HI versus OI). This eliminates the effects of OI as an indica-tor of kerogen type [21]. The results of pyrolyzed samples and the plots of HI vs Tmax suggested a mixture of Type II and II-III kerogen except for the shale terval at 1272 m, which revealed Type I kerogen, as reflected by the high HI in-dex and low OI (Table 1). The high values of HI show that the formation is more likely an oil prone. Almost, the same types of kerogen have been reported by several authors such as [2] [10] [13] [25] [26]. As shown in Figure 3, the or-ganic matter of the formation is thermally mature and in the oil zone, except one sample which belongs to the early mature zone [23] [24]. The plot of Production Index and Tmax (Figure 4) also displays that almost all samples are in the oil zone. The Production Index shows the level of thermal maturation and the presence of migrated and contaminated hydrocarbons [15]. The values of PI less than 0.1, 0.1 to 0.15, 0.15 to 0.4 indicate immature, early mature and peak ture, respectively. The values greater than 0.4 indicate late stage of thermal ma-turity for oil [23]. The plot of Production Index versus Tmax can be used to de-termine levels of kerogen conversion and maturity. Accordingly, the analysed samples of the Sargelu Formation in Atrush-2 well are mainly in early mature with low level of conversion and are not contaminated (Figure 4).
3.2. Basin Modelling
DOI: 10.4236/ojg.2021.113004 55 Open Journal of Geology Figure 3. Cross-plots of HI vs Tmax including vitrinite reflectance (R%), showing kerogen
quality and thermal maturity stages of analysed samples.
Figure 4. Plot of PI vs Tmax showing maturation and hydrocarbon production of the Sargelu forma-tion [15].
the Aqra Formation (Upper Cretaceous) and the deepest formation encountered by drilling is the Upper Triassic Kurra Chine Formation. The total depth drilled
0 100 200 300 400 500 600 700 800 900 1000 400 425 450 475 500 H y d roge n I n d ex ( H I, mg H C /g TO C ) Tmax (oC) Type I Oil-prone usually lacustrine Type II Oil-prone usually marine Type II-III Oil-gas-prone Ro 1.35% Type III Gas-prone Type IV Inert Oil Window Ro 0.6%
Immature Mature Postmature
0.0 0.1 0.2 0.3 0.4 0.5 0.6 0.7 0.8 0.9 1.0 400 425 450 475 500 PRO DUCT IO N I NDEX (PI )
MATURITY (based on Tmax ,oC)
C onde ns a te -W et G as Z o n e Overmature Intensive Generation, Expulsion Stained or Contaminated
Low Level Conversion
Immature Oil Window Dry Gas Window
DOI: 10.4236/ojg.2021.113004 56 Open Journal of Geology
in this well is 3400 m. The total thickness of the overburden from ground surface to the top of the Sargelu Formation, in this well, is 1178 m. This amount of overburden is insufficient for thermal maturation of the underlying Middle Ju-rassic-aged Sargelu source rock. The study area was subjected to uplift in the Miocene [17] [27] [28] [29] [30] causing erosion of remarkable thickness of se-diments. Subsequently, older formations became exposed. In order to obtain the present-day heat flow, few plausible scenarios were modelled and the best fit to bottom hole temperature (BHT) was achieved by a present-day heat flow of 30 mW/m2. Then, the amount of the eroded sediments, 2500 m, 3000 m, 3500 m,
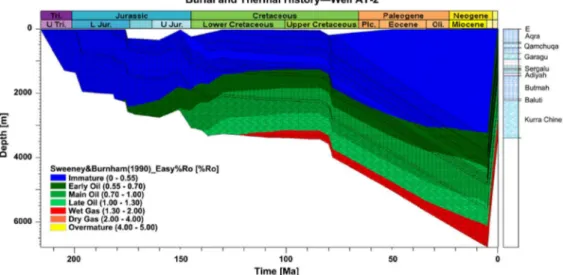
4000 m of the missing overburden were added on top of the Aqra Formation. The best fit between the measured and calculated vitrinite reflectance of Sweeney and Burnham [31] was achieved from erosion of 3500 m of sediments in the stu-died well. The stage of source rock maturation and oil and gas generation can be deduced by vitrinite reflectance (Ro%). The simulation of the modelled vitrinite reflectance (Easy %R) versus time shows that the Sargelu Formation entered the early oil zone in the 64 Ma and reached the main oil zone around 5 Ma. The formation is still in main oil zone at present-day (Figure 5 and Figure 6(a)).
The generation mass for the studied formation began in the 158 Ma (0.01 Mtons), then increased almost in 49 Ma, followed by outstanding increase to 0.52 Mtons at present-day. The highest rate of oil generation for the Sargelu Formation in well Atrush-2 was in the 8.5 Ma (Figure 6(b)). Transformation ra-tio (TR) is defined as the rara-tio of converted mass fracra-tion of source rock that has been thermally matured and generated hydrocarbons to the total generation po-tential of a source rock [32] [33]. Based on the modelling, the Sargelu Formation in Atrush-2 Well began to generate oil in 149 Ma prior to onset on oil genera-tion. The transformation was nearly low at 50 Ma, then started to increase and 26% conversion was reached in the 5 Ma. Influenced by Zagros orogeny and consequent uplifting and erosion, the transformation ratio has been ceased since
Figure 5. Thermal history modelled through geological time for whole stratigraphic succession in Well Atrush-2.
DOI: 10.4236/ojg.2021.113004 57 Open Journal of Geology
(a)
(b)
Figure 6. Time plot showing (a) vitrinite reflectance (Ro), generation rate [mgHC/gTOC/ Ma] and generation mass, and (b) trends of transformation ratio, expulsion onset and expulsion mass of the Sargelu formation through the geological time in well Atrush-2.
5 Ma. The petroleum expulsion is the ratio of the expelled petroleum to the amount of generated petroleum. The onset of oil expulsion from the Sargelu Formation was in 50 Ma, later the expulsion mass reached 0.5 Mtons at present-day. Several previous investigations related to the Sargelu Formation, has concluded different levels of thermal maturity at different tectonic zones in different locations in Iraqi Kurdistan [16] [17] [25] [34] [35]. These differences can also refer to variation of the overburden rocks, groundwater flow, and con-ductivity of the rock units. For instance, the study of Abdula [36] on the geo-thermal gradient in selected wells in the Iraqi Kurdistan, has displayed the dif-ferent geothermal gradients values. The Geothermal gradient for the studied area is around 17.83 - 19.74 C/km [36], which is relatively low compared to that of the Low Folded Zone.
Abdula [34] modelled hydrocarbon generation of the Sargelu Formation in Jabal Kand Oil Field, and stated that the Sargelu Formation has not started gen-eration oil and gas in that oil field. He argued that low maturity and oil genera-tion are due to low thickness of the overburden in that area. Hakimi et al. [10], in their study on hydrocarbon generation from the Sargelu Formation from six wells in Kurdistan Region, Northern Iraq, concluded that the formation is in the
DOI: 10.4236/ojg.2021.113004 58 Open Journal of Geology
peak oil zone and more than 50% of oil has been generated and expelled since the Late Eocene to present-day, and the formation has reached higher level of thermal maturity in the wells Aj-8, Taq-1 and Zab-1. Moreover, based on the model of Sachsenhofer et al. [8], for well Shoresh-1, the oil generation rate of the Sargelu Formation attained its peak at 55 Ma and then again at 5 Ma.
4. Conclusion
The results of Rock-Eval Pyrolysis showed that the Sargelu Formation in Well Atrush-2 can be characterized as fair source rock in the upper part, while consi-dered as good to very good source rock, in the lower part, in terms of organic matter richness. The Type II and mixed Type II-III kerogens are suggested for the formation. The values of Vitrinite Reflectance (R%) and Tmax revealed that the formation is thermally mature and has entered the oil window. From the ob-tained results of 1-D basin modelling, it was confirmed that the formation en-tered early oil zone at 64 Ma, then reached the main oil zone around 5 Ma. The formation commenced oil generation in 146 Ma and about 26% conversion was reached at present-day. The onset of oil expulsion from the Sargelu Formation was in 50 Ma and the expulsion mass has scored 0.5 Mtons at present day.
Conflicts of Interest
The authors declare no conflicts of interest regarding the publication of this pa-per.
References
[1] Jassim, S.Z. and Goff, J.C. (2006) Geology of Iraq. Dolin, Prague and Moravian Museum, Brno, Czech Republic, 341 p.
[2] Al-Ameri, T.K., Najaf, A.A., Al-Khafaji, A.S., Zumberge, J. and Pitman, J.K. (2013) Hydrocarbon potential of the Sargelu Formation, North Iraq. Arabian Journal of Geosciences, 7, 987-1000. https://doi.org/10.1007/s12517-013-0875-8
[3] Bellen Van, R.C., Dunnington, H.V., Wetzel, R. and Morton, D. (1959) Lexique Stratigraphique International, Asie, Iraq. International Commission on Stratigra-phy, Paris, 311 p.
[4] Buday, T. (1980) The Regional Geology of Iraq: Stratigraphy and Paleogeography. Vol. 1, State Organization for Minerals, Baghdad, 297 p.
[5] Abdula, R.A., Balaky, S.M., Nourmohamadi, M.S. and Piroui, M. (2015) Microfacies Analysis and Depositional Environment of the Sargelu Formation (Middle Jurassic) from Kurdistan Region, Northern Iraq. Donnish Journal of Geology and Mining Research, 1, 1-26.
[6] Aqrawi, A.A.M., Goff, J.C., Horbury, A.D. and Sadooni, F.N. (2010) The Petroleum Geology of Iraq. Scientific Press Ltd., London, 560 p.
[7] Pitman, J.K., Steinshouer, D. and Lewan, M.D. (2004) Petroleum Generation and Migration in the Mesopotamian Basin and Zagros Fold Belt of Iraq: Results from a Basin-Modelling Study. GeoArabia, 9, 41-72.
[8] Sachsenhofer, R.F., Bechtel, A., Gratzer, R., and Rainer, T.M. (2015) Source-Rock Maturity, Hydrocarbon Potential and Oil-Source-Rock Correlation in Well
Sho-DOI: 10.4236/ojg.2021.113004 59 Open Journal of Geology rish-1, Erbil Province, Kurdistan Region, Iraq. Journal of Petroleum Geology, 38, 357-381. https://doi.org/10.1111/jpg.12617
[9] Abdula, R.A. (2014) Hydrocarbon Potential of Sargelu Formation and Oil-Source Correlation, Iraqi Kurdistan. Arabian Journal of Geosciences, 8, 5845-5868. https://doi.org/10.1007/s12517-014-1651-0
[10] Hakimi, M.H., Najaf, A.A., Abdula, R.A. and Mohialdeen, I.M. (2017) Generation and Expulsion History of Oil-Source Rock (Middle Jurassic Sargelu Formation) in the Kurdistan of North Iraq, Zagros Folded Belt: Implications from 1D Basin Mod-eling Study. Journal of Petroleum Science and Engineering, 162, 852-872.
https://doi.org/10.1016/j.petrol.2017.11.013
[11] Edilbi, A.N., Ali, A.J., Abdullah, B.E., and Bowden, S.A. (2018) Source Rock Evalua-tion and Lateral Changes in Thermal Maturity of the Sargelu FormaEvalua-tion (Middle Jurassic) in Kurdistan Region-Northern Iraq. UKH Journal of Science Engineering, 2, 7-17. https://doi.org/10.25079/ukhjse.v2n1y2018.pp7-17
[12] Mamaseni, W.J. (2020) Petroleum Potentiality and Petrophysical Evaluation of the Middle-Jurassic Sargelu Formation, Northern Iraq. Iraqi Geological Journal, 53, 77-93. https://doi.org/10.46717/igj.53.2D.6MS-2020-10-28
[13] Fatah, S.S. and Mohialdeen, I.M. (2015) Hydrocarbon Generation Potential and Thermal Maturity of Middle Jurassic Sargelu Formation in Miran Field, Sulaimani Area, Kurdistan Region, NE Iraq. Journal of Zankoy Sulaimani, 11, 213-228. https://doi.org/10.17656/jzs.10481
[14] Espitalié, J., Laporte, J., Madec, M., Marquis, F., Leplat, P., Paulet, J. and Boutefeu, A. (1977) Rapid Method for Source Rock Characterization and for Determination of Petroleum Potential and Degree of Evolution. Oil & Gas Science and Technology, 32, 23-42.
[15] Tissot, B.P. and Welte, D.H. (1984) Petroleum Formation and Occurrence. Springer Science & Business Media, Berlin, Heidelberg, 699 p.
https://doi.org/10.1007/978-3-642-87813-8
[16] English, J.M., Lunn, G.A., Ferreira, L. and Yacu, G. (2015) Geologic Evolution of the Iraqi Zagros, and Its Influence on the Distribution of Hydrocarbons in the Kurdis-tan Region. AAPG Bulletin, 99, 231-272. https://doi.org/10.1306/06271413205 [17] Edilbi, A.N. (2016) The role of the Baluti Formation within Triassic Petroleum
Sys-tems in Kurdistan: Akre-Bijeel Block, Gara and Ora Anticlines: An Organic Geo-chemical and Basin Modelling Approach. PhD Thesis, University of Aberdeen, Ab-erdeen.
[18] Aqrawi, A.A. and Badics, B. (2015) Geochemical Characterisation, Volumetric As-sessment and Shale-Oil/Gas Potential of the Middle Jurassic-Lower Cretaceous Source Rocks of NE Arabian Plate. GeoArabia, 20, 99-140.
[19] Wygrala, B. (1989) Integrated Study of an Oil Field in the Southern Po Basin, Northern Italy. Publikationen vor, 2000, Jülich.
[20] Allen, P.A. and Allen, J.R. (2013) Basin Analysis: Principles and Application to Pe-troleum Play Assessment. John Wiley and Sons, Hoboken, 549 p.
[21] Hunt, J.M., (1996) Petroleum Geochemistry and Geology. 2nd Edition, W. H. Freeman, New York, 743 p.
[22] Peters, K.E. (1986) Guidelines for Evaluating Petroleum Source Rock Using Pro-grammed Pyrolysis. AAPG Bulletin, 70, 318-329.
https://doi.org/10.1306/94885688-1704-11D7-8645000102C1865D
DOI: 10.4236/ojg.2021.113004 60 Open Journal of Geology Special Volumes, 77, 93-120. https://doi.org/10.1306/M60585C5
[24] Peters, K.E., Walters, C.C. and Moldowan, J. (2005) The Biomarker Guide. Vol. 1. Cambridge University Press, Cambridge, 489 p.
[25] Abdula, R.A. (2010) Petroleum Source Rock Analysis of the Jurassic Sargelu Forma-tion, Northern Iraq. M.Sc. Thesis, Colorado School of Mines, Golden.
[26] Al-Atroshi, S.J., Sherwani, G.H., and S.F. Al-Naqshbandi, S.F. (2020) Assessment the Hydrocarbon Potentiality of the Middle Jurassic Sargelu Formation, Northern Iraq. Iraqi Geological Journal, 53, 1-15.
https://doi.org/10.46717/igj.53.1a.R1.2020.01.31
[27] Ameen, M. (1991) Possible forced folding in the Taurus-Zagros belt of Northern Iraq. Geological Magazine, 128, 561-584.
https://doi.org/10.1017/S0016756800019695
[28] Homke, S., Vergés, J., Van Der Beek, P., Fernàndez, M., Saura, E., Barbero, L., Bad-ics, B. and Labrin, E. (2010) Insights in the Exhumation History of the NW Zagros from Bedrock and Detrital Apatite Fission-Track Analysis: Evidence for a Long-Lived Orogeny. Basin Research, 22, 659-680.
https://doi.org/10.1111/j.1365-2117.2009.00431.x
[29] Csontos, L., Ágoston, S., Tamás, P., László, K., Salae, A.T. and Athar, A. (2012) Structural Evolution of the Northwestern Zagros, Kurdistan Region, Iraq: Implica-tions on Oil Migration. GeoArabia, 17, 81-116.
[30] Koshnaw, R.I., Horton, B.K., Stockli, D.F., Barber, D.E., Tamar-Agha, M.Y. and Kendall, J.J. (2017) Neogene Shortening and Exhumation of the Zagros Fold-Thrust Belt and Foreland Basin in the Kurdistan Region of Northern Iraq. Tectonophysics, 694, 332-355. https://doi.org/10.1016/j.tecto.2016.11.016
[31] Sweeney, J.J. and Burnham, A.K. (1990) Evaluation of a Simple Model of Vitrinite Reflectance Based on Chemical Kinetics (1). AAPG Bulletin, 74, 1559-1570. https://doi.org/10.1306/0C9B251F-1710-11D7-8645000102C1865D
[32] Chilingar, G.V., Buryakovsky, L.A., Eremenko, N.A. and Gorfunkel, M.V. (2005) Geology and Geochemistry of Oil and Gas. Elsevier, Amsterdam, 399 p.
[33] Shalaby, M.R., Hakimi, M.H. and Abdullah, W.H. (2011) Geochemical Characteris-tics and Hydrocarbon Generation Modeling of the Jurassic Source Rocks in the Shoushan Basin, Northwestern Desert, Egypt. Marine and Petroleum Geology, 28, 1611-1624. https://doi.org/10.1016/j.marpetgeo.2011.07.003
[34] Abdula, R.A. (2017) Petroleum System Modeling of Jabal Kand Oil Field, Northern Iraq. ZANKO Journal of Pure and Applied Sciences, 29, 88-95.
https://doi.org/10.21271/ZJPAS.29.2.9
[35] Al-Badry, A.M.S. (2012) Stratigraphy and Geochemistry of Jurassic Formations in Selected Sections North Iraq. Ph.D. Dissertation, College of Science, University of Baghdad, Baghdad.
[36] Abdula, R.A. (2017) Geothermal Gradients in Iraqi Kurdistan Deduced from Bot-tom Hole Temperatures. ZANKO Journal of Pure and Applied Sciences, 26, 601- 608. https://doi.org/10.1016/j.ejpe.2016.08.007
![Figure 1. (a) Tectonic division of Iraq showing location of the study area (modified after [1])](https://thumb-eu.123doks.com/thumbv2/5dokorg/5483120.142728/3.893.327.796.98.839/figure-tectonic-division-iraq-showing-location-study-modified.webp)
![Figure 4. Plot of PI vs Tmax showing maturation and hydrocarbon production of the Sargelu forma- forma-tion [15]](https://thumb-eu.123doks.com/thumbv2/5dokorg/5483120.142728/7.893.404.756.108.584/figure-plot-tmax-showing-maturation-hydrocarbon-production-sargelu.webp)