!
!
!
Halmstad University Post-Print
Processes and strategies of NPD: A
survey of Malaysian Industry
Ammar Al-Shalabi, Mohamed K. Omar and Jonas Rundquist
N.B.: When citing this work, cite the original article.
Original Publication:
Al Shalabi A, Omar M, Rundquist J. Processes and strategies of NPD : A survey of Malaysian Industry. Toledo, Ohio: Advance Manufacturing Solutions Co. Ltd.; International Journal of Manufacturing Science and Technology. 2008;10(1):91-95.
Copyright: Advance Manufacturing Solutions Co. Ltd.
http://www.ijmstjournal.com/
Post-Print available at: Halmstad University DiVA
---
† Corresponding Author: International Journal of Manufacturing Science and Technology
Tel: +60 6 252 3313; Fax: +60 6 23 16552 Vol. 10, No. 1, p. 91-95
PROCESSES AND STRATEGIES OF NPD: A SURVEY OF MALAYSIAN INDUSTRY
Ammar Al-Shalabi*
†, Mohamed K. Omar
**Centre of Computer Aided Design and Knowledge Manufacturing (CCADKM) Faculty of Engineering and Technology, Multimedia University, 75450 Melaka, Malaysia
Emails: *ammar.alshalabi@mmu.edu.my , **mohamed.k.omar@mmu.edu.my
Jonas Rundquist
School of Business and Engineering, University of Halmstad PO Box 823, S30118, Halmstad, Sweden
http://www.hh.se jonas.rundquist@set.hh.se
ABSTRACT
In recent years, there has been a considerable interest in Malaysian manufacturing firms in New Product Development (NPD) which is considered to be indirectly a booster for the success of a firm. The purpose of the study is to highlight the NPD processes and methods used in Malaysian industry. This paper focuses only on the formal NPD-processes and NPD-strategies. From the available database, it is found that there are 250 confirmed companies from automotive, chemical, and electrical industries, which have R&D facilities; out of which 36% have agreed to participate in the survey, and 29% questionnaires have been used. The results show that the best firms have their R&D and NPD departments either overseas or partially in Malaysia.
Keywords: NPD-process; NPD-strategy; survey study;
best practice; Malaysian industry
1. INTRODUCTION
This study was motivated by the fact that Malaysia was heavily dependant on agriculture which was gradually shifted to manufacturing. However, Malaysia has become an export-driven economy spurred on by high technology and knowledge-based industries. Malaysia, now, is changing its emphasis from purely manufacturing towards higher value-added products and activities including research and development (R&D), design and prototyping, logistics, and marketing. The present study was designed to be compared to two earlier studies; one was conducted by the Product Development Management Association (PDMA) on US firms in 1997 [1], and the other study was conducted by Rundquist and Chibba on Swedish firms in 2004 [2]. Both were to determine the status of NPD practices. Due to the uniqueness of this study on Malaysian firms as the first and only study, the obtained finding on the status of NPD in Malaysia can be used as reference to the managers in Malaysia. The best practices for the new product development (NPD) process, from idea generation phase through the product launch phase, have been investigated earlier by many researchers to create descriptive models [3, 4, 5, 6, and 7]. This study is confined to four areas of research. These are: formal NPD-processes, NPD Strategies, Outsourcing of NPD activities, and the Organizing of NPD. This study aims to identify the status of NPD-processes and NPD strategies used in Malaysian firms. This paper is organized as follows: literature review to explain the background of formal NPD-processes and NPD-strategies, then framework to elaborate on the selection and categorization of firms, after that discussion of results, and a conclusion.
2. LITERATURE REVIEW
The new product (NP) term, in general perception, has been defined and discussed earlier by Griffin [1]; Booz et al [3];
and Cooper [8]. One finding from their studies is that NP may vary depending on the degree of newness to the product. PDMA uses a categorization scheme as presented below to make it clear to what extent a product is radically new or rather a modification:
x New-to-the-world products or really new products x New-to-the-firm products or new product lines x Additions to existing product lines
x Improvements and revisions to existing products x Repositioning.
x Cost reductions
In the past few decades, in order to control the time, cost and quality of NPD, many other researchers have as well presented various frameworks, methods, and models for the new product activities.
From the vast available literature review, this section will explain the background of the two comparison issues that are targeted in this study. The issues will be presented in two sub-sections as follows: formal NPD-processes and NPD-strategies.
2.1. Formal NPD-processes
Mcdermott and Handfield [9] have defined new product development (NPD) process as a process from new product idea generation (by marketing and/or R&D) to the promotion and sale of the product. The whole NPD-process may include many sub-NPD-processes, sub-stages, or sub-phases. Booz et al [3] has described a model in 1968 which consists of six stages with the following stage-gates: Exploration, screening, business analysis, development, testing, and commercialization. In 1996, Wilson et al [10] have presented a model for the product development process, which is made up of nine distinct phases that deals with:
x Product ideas
x Customer future needs projection
x Product technology selection and development x Process technology selection and development x Final product definition and project targets x Product marketing and distribution preparation x Product design and evaluation
x Manufacturing system design
x Product manufacture, delivery and use
NPD-process that is documented in a recognized form can be considered as “formal NPD-process”. Cooper [6] has defined the formal process “a formal blue print, roadmap, template, or thought process for driving a new product project from the idea stage to market launch and beyond”, he has also described three types of NPD-processes:
Al-Shalabi, Omar, and Rundquist
92
x Process generation I: Technological; to reduce the technical risks through checklists and stage-gates. x Process generation II: Non-technological;
cross-functional approach to NPD.
x Process generation III: Fuzzy gates; overlapping of stages for flexibility.
The stage-gate is defined by Booz et al [3] as s decision point at which specific criteria must be fulfilled before the go-ahead can be given for the next stage of NPD-process.
2.2. NPD strategies
In a second study in 1982, Booz et al [4] defined new product strategy as a strategy for deciding which new products are to be developed. The purpose of having a strategy is also to “focus and integrate team effort and to permit delegation” according to Crawford and Benedetto [11]. In a PDMA success project by Griffin and Albert [12], it’s mentioned that the interactions between project strategies and its successes had been extensively researched and, in general, the interesting finding, by Cooper [13], was that different strategies generates different kind of success. According to Cooper and Kleinschmidt [14], a “clear and well communicated new product strategy” is the second most important compelling factor in driving the performance of a firm, separating the best performing firms from the rest
.
In recent years, new strategic issues have emerged in connection to the NPD-process, which suggested strategic outsourcing of innovation and product platform strategies. Quinn (2000) claims in a conceptual article that strategic outsourcing of innovation is a necessary action to gather sufficient knowledge and manage the insecurities of a rapidly changing world [15]. Meyer and Lehnerd (1997) defined a product platform as “development of a set of subsystems and interfaces that form a common structure from which a stream of derivative products can be efficiently developed and produced” [16].
A strategy for continuously improving the NPD-process is valuable for achieving a high quality process. This strategy is the most important difference between the leading firms and the rest [14].
3. FRAMEWORK
Companies were selected from four resources; Malaysian External Trade Development Corporation (MATRADE), Federation of Malaysian Manufacturers (FMM), Malaysian Industrial Development Authority (MIDA), and E-directory Kelana Saga Sdn. Bhd. The resources’ databases have 2846 companies registered in the automotive, chemical, and electrical and electronics industry. A mail survey was sent to only 915 companies those which, according to the resources, have research and development and/or NPD department in their companies. The response was almost negligible. A new strategy was implemented to communicate with the companies. The companies were called by phone to confirm whether they have R&D or not, and whether they were interested to participate in the survey or not. A list was further downsized to 250 companies and out of which 90 have agreed to participate in the study. Only 72 returned questionnaires were used in the study.
The respondents were from automotive industry (55%), chemical industry (36.1%), and Electrical and electronics industry (8.3%). The participating firms are categorized (Table 1) as large size companies (61%), medium size companies (24%), and small size companies (11%). According to the Malaysian Small and Medium Industries Development Corporation (SMIDEC), the definition of medium size firm in the manufacturing sector is “the firm
that has annual sales turnover between RM10 million and RM25 million OR full time employees between 51 and 150”.
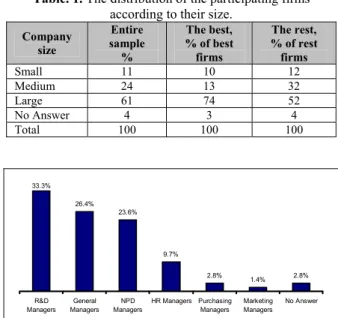
In order to ensure the accuracy of the collected data, the NPD managers and R&D managers were requested to respond to the questionnaire. Nevertheless, the returned questionnaires show that the R&D managers (33.3%), general managers (26.4%), and NPD managers (23.6%) are the most who answered the questions.
Table. 1. The distribution of the participating firms
according to their size.
Company size Entire sample % The best, % of best firms The rest, % of rest firms Small 11 10 12 Medium 24 13 32 Large 61 74 52 No Answer 4 3 4 Total 100 100 100 33.3% 26.4% 23.6% 9.7% 2.8% 1.4% 2.8% R&D Managers General Managers NPD Managers HR Managers Purchasing Managers Marketing Managers No Answer
Fig. 1. Job area of the respondents’ personnel those who
filled out the questionnaire.
A questionnaire was prepared by the PDMA to cover four research areas: formal NPD-processes, NPD Strategies, Outsourcing of NPD activities, and the Organizing of NPD. This paper focuses only on the issues that categorize the responding organization, the NPD-processes within the organization, and NPD-strategies. The first category of questions classifies the respondents according to industry (automotive, chemical, and electrical and electronics) and classifies the firms into the best firms and the rest firms. The best firms are those with high emphasis on NPD and the rest firms are those with low emphasis on NPD. The emphasis on NPD was identified by two variables: (A) Sales from products developed within the firms as a percent of turnover.
(B) Sales of products commercialized in the last five years as a percent of turnover.
The best firms indicated 50% on both variables. A total of 42% of the sample was identified as the best firms and 58% was identified as the rest. From the data collected from the questionnaire, the best firm group is identified as international firms that are based in Malaysia, Malaysian firms that have been in market for almost fifteen years, firms having their R&D departments partially in Malaysia, firms that reached a certain benchmark that make them stable, and/or Malaysian firms or international firm that produce products locally but cater for international demand and not for Malaysian market. Whereas the rest firm group is entirely Malaysian firms.
A second categorization was performed by asking the firms to rate eight competitive factors on how they win new customers. The factors were lower price, better after sale, broader product line, and frequency of new product launch. The rating was done on a scale of 5, where (1) was not important and (5) was very important. Furthermore, the firms were asked about if they had documented strategies
for different types of situations such as product lines, module thinking, outsourcing innovation, product platform, and continuous improvements of NPD-processes.
4. RESULTS AND DISCUSSION
The results of this study can serve as a benchmark, which will enable Malaysian managers and academicians to evaluate the current status of the NPD practices in Malaysia and to compare the results with industrialized countries. Adding to that, the findings from the rest firm group as solely Malaysian firms and the best firm group as a mixture of Malaysian and international firms can give an insight for the managers. This will also assist to benchmark the local firms with international firms in Malaysia.
4.1. Formal NPD-processes
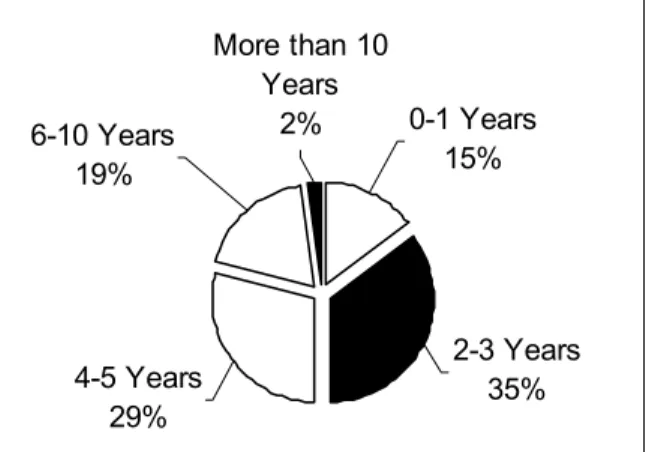
The use of NPD-process in Malaysian firms seems to be as young as ten years (Fig. 2). Out of the entire sample of this study, 41.67% of the firms do not use formal processes and 58.33% use formal processes (Table.2). However, the automotive firms are more likely to use formal NPD-processes with up to 70% compared to 46.15% of the chemical industries. More than 10 Years 2% 4-5 Years 29% 6-10 Years 19% 0-1 Years 15% 2-3 Years 35%
Fig. 2. The time when firms started using formal
NPD-processes.
Table. 2. The use of formal/informal NPD documentation
for respective industry
Formal/Informal Total Industry Don’t have
NPD documentation % Have formal NPD documentation % No. of firms % Automotive 30 70 40 100 Chemical 53.85 46.15 26 100 Electronics 66.67 33.33 6 100 Entire sample 41.67 58.33 72 100
Up to 62% of the rest firm group use formal NPD-process (functional sequential, cross-functional stage gate, and cross-functional 3rd generation) compared to 53% of the
best firm group; whereas the best group seems to use formal NPD-processes with sequential functions and third generation cross-functional teams using staged process at a higher level more than the rest group (Fig. 3). From the entire sample (best and rest), there are 22% use formal processes with sequential functions which mean no direct interaction between functions’ members, only 19% of firms use cross-functional stage gate, and only 17% of firms use cross-functional third generation process. In general, the work culture of a firm is an influential factor on the cross-functional arrangement.
The companies who are without formal NPD-processes have been asked to indicate their NPD originating sources
(Table 3).The consultants are top ranked as the idea initiators for NPD, in the best firms, then followed by internal marketing group and suppliers. But, for the rest firms, the internal R&D is top ranked then followed by customers and internal marketing group. The “consultants” and “university or research institutes” significantly distinguish the best from the rest. In comparison with a study conducted on Malaysian software designing firms by Igel and Islam (2001), they found that the firms sourced new software technology mainly from foreign companies and foreign universities and research institutes [17].
37% 10% 27% 3% 23% 19% 19% 19% 31% 12% 26% 15% 22% 19% 17%
None Informal Functional sequenial Cross-functional stage gate Cross-functional 3rd generation % of the best % of the rest Total sample
Fig. 3. NPD-Processes: The best versus the rest. The
categories “None” and “Informal” indicate no formal processes.
Table. 3. The sources that originate ideas for NPD.
Sources of NPD The Best The Rest
Coworkers in the firm 2.80 3.02
Users or Customers 3.40 3.45
Competitors 3.47 3.36
Internal R&D 3.27 3.62
Cooperation with other
companies 3.30 3.12
Suppliers 3.53 3.31
Internal marketing group 3.57 3.45
Consultants* 3.80 3.19 Internet 3.03 2.88 Top Management 3.17 3.21 University or Research institutes* 3.00 2.43 Internal manufacturing 3.07 3.14
Acquisition of new equipment 3.13 3.24
Professional journals 2.73 2.52
*Chi-square, p < 0.05
1= not at all important, 5= extremely important.
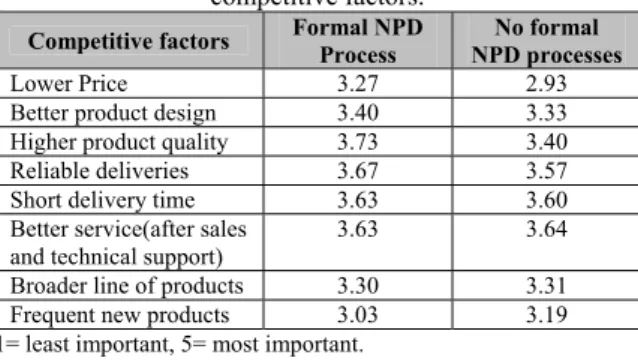
Eight competitive factors have been suggested as criteria for winning customers. The firms have been asked to rate the eight factors for winning their customers over other firms. The rating is analyzed in the context of formal/informal processes (Table 4), and also in the context of best/rest firms (Table 5). With respect to the formal NPD-processes the results show no significant difference between firms with formal and informal processes. By looking at each firm group separately, the firms with formal NPD-processes show that they compete with “Higher product quality” followed by “reliable deliveries”. While the firms without formal processes compete in “Better service after sales and technical support” then in “short delivery time”.
Table 5 shows that there is a clear significant difference between rest and best firms. The rest firm group, in general, seems to compete in the aforementioned competitive areas for winning their customer more that the best firm group. The best firm group competes in “Better service after sales and technical support” as top competitive criteria, and the rest firm group competes in “Higher product quality” and
Al-Shalabi, Omar, and Rundquist
94
in “Short delivery time”. The significant difference between the rest firm group and best firm group exists in “Higher product quality” and in “Lower Price”.
Table. 4. The use of formal NPD-process related to
competitive factors.
Competitive factors Formal NPD Process NPD processes No formal
Lower Price 3.27 2.93
Better product design 3.40 3.33
Higher product quality 3.73 3.40
Reliable deliveries 3.67 3.57
Short delivery time 3.63 3.60
Better service(after sales and technical support)
3.63 3.64
Broader line of products 3.30 3.31
Frequent new products 3.03 3.19
1= least important, 5= most important.
Table. 5. The best and the rest related to competitive
factors.
Competitive factors The best The rest
Lower Price* 2.70 3.33
Better product design 3.27 3.43
Higher product quality* 3.27 3.74
Reliable deliveries 3.50 3.69
Short delivery time 3.43 3.74
Better service(after sales and technical support)
3.63 3.64
Broader line of products 3.20 3.38
Frequent new products 3.07 3.17
*Chi-square, p < 0.1
1= least important, 5= most important.
4.2. NPD-strategies
A product platform, module thinking, and outsourcing innovation were defined to the participant in the questionnaire. The product platform was defined as a joint basic design or a number of joint key components, which can be combined to form many different products. The module thinking which was considered insignificant in the results was described as a small number of modular products that can be combined to form many different products. And the outsourcing innovation was defined as the main part or the most important parts of the product development process are conducted outside the firm.
Table. 6. Percentage of firms with/without strategies for
NPD.
Specific strategy for NPD? (%)
Firm groups Yes No Total
The best 80 20 100
The rest 74 26 100
Entire sample 76 24 100
Table. 7. The use of a formal NPD-process related to the
existence of a documented strategy for different aspects of NPD Strategies for Formal NPD process % No formal NPD process % Product Line* 56.7 90.5 Module Thinking 46.7 50.0 Outsourcing Innovation** 80.0 59.5 Product Platforms 70.6 77.5 Continuous Improvements* 83.3 57.1 *Chi-square, p < 0.05 **Chi-square, p < 0.10
In this study, majority of the firms from the entire sample had a strategy for NPD activities 76% compared to 24% for those without specific strategy for NPD (Table. 6). The firms who are with formal NPD-processes emphasize to have documented strategy for “continuous improvements”, “outsourcing innovation” and “product platforms” in NPD-processes (Table 7). The firms who are without formal NPD-processes emphasize to have a documented strategy for “product line”. Focusing on the significant difference between the two firm groups, it is noticed that the firms with formal processes have a documented strategy for “continuous improvements” and “outsourcing innovation” more than the firm group that without formal processes. Whereas, the firms who are without formal NPD-processes seem to have a documented strategy for “product line” more that that with formal processes.
Table 8 reveals no significant difference between the best and rest firm groups on the documented NPD strategies. The firms with best NPD practices focus most on a documented strategy for “product line”, while the rest firms focus most on a documented strategy for “product platform”. The module thinking scored the lowest ranking in the analysis, which makes it insignificant in the results.
Table. 8. The existence of a documented strategy for
different aspects of NPD Documented Strategies for: The best % The rest % Product Line 80 73.8 Module Thinking 50 47.6 Outsourcing Innovation 73.3 64.3 Product Platforms 75 75.5 Continuous Improvements 76.7 61.9 5. CONCLUSION
The current status of NPD in Malaysia is summarized in the form of findings of this study. The results are presented in Table. 9. The analysis of these findings can enable NPD managers and academicians to draw a clear roadmap for the NPD processes in Malaysia.
From the collected data from the questionnaire, it is found that the best firms have their R&D and NPD departments either entirely overseas or partially in Malaysia. The rest firms are solely Malaysian with their R&D and NPD departments locally located. The study did not distinguish between the Malaysian firms and the international firms in Malaysia as long as both have their production lines in Malaysia. Therefore, there is a stronger connection between the competitive factors of winning a customer and best-rest firm groups than between the use of formal NPD-processes. Whereas, there is a stronger connection between the NPD strategies and the use of formal NPD- processes than between the best-rest firm groups.
This study shows that the Malaysian industry seems to have a low usage of formal NPD-processes. This could be explained that Malaysian industry is still new to the use of formal NPD-processes. Another reason that could also explain the situation is that Malaysian industry is still relying on foreign technology to develop new products. The concurrent engineering is still not widespread within the Malaysian firm, which consequently leads to the limited use of cross-functional communication between departments.
Previous studies presented frameworks for various NPD issues for specific industries. A framework based on this study can be developed to elaborate on team formation process in NPD. The proposed framework can be compared with a framework that was developed by Janet Murray and Mike Chao (2005). Their framework suggested a successful
international knowledge acquisition at the level cross-team based on source-recipient team integration, source team resources and recipient team resources [18].
Due to the rapid economical change in the region, the authors will repeat this study in the future to compare the current results with the future results in order to keep a track of NPD practices and their development over time in Malaysia.
Table. 9. Summary of findings
NPD-processes
The use is as new as 10 years
58.33% of total firms use formal NPD-process
The “rest” firm group utilizes a formal NPD-process more than the “best” (62% versus 53%)
The rest firms use cross-functional stage gate more than the best firms (31% versus 3%)
The best firms use a cross-functional third generation process more than the rest firms (23% versus 12%)
The idea initiator for NPD:
x Consultants
x University or research institutes
Significant difference between the “rest” and the “best” related to competitive factors:
x Higher product quality
x Lower price
Significant difference between the use of a formal NPD-process related to competitive factors:
x None
NPD-strategies
76% of the total the total sample had a strategy for NP activities with (best 80% versus rest 74%)
68% of total firms have documented strategy for innovation outsourcing
Significant difference between the “rest” and the “best” related to use of documented NPD-strategy:
x None
Significant difference between the use of a formal NPD-process related to use of documented NPD-strategy:
x Continuous improvements (best 83.3% versus rest
57.1%)
x Product line (best 56.7% versus rest 90.5%) x Outsourcing innovation (best 80% versus rest
59.5%)
5.1. Research Limitation
The limitation to this study should be pointed out when presenting the results, for the purpose of improving the future research on best practices of NPD. Firstly, a very high response was expected from the electrical and electronics industry because it is one of the major sectors in Malaysia, only 8.3% of the entire sample of this study has covered this sector. The low involvement of this industry is due to the fact that most of the companies showed little interested in participating in this industry. Secondly, the response rate, in general, was not as high as expected. The low response rate is attributed to several reasons which are the length of the questionnaire, the hardship to reach the right person to take part in this study, and limited interested of personnel in participating in surveys. The companies were offered to receive an executive report about the results for their reference on a condition that they indicate that by sending a business card with the returned questionnaire. Surprisingly, only few companies showed the interest.
ACKNOWLEDGEMENTS
The authors would like to thank Samuel Yau and Sarath Sivakanesan from the Faculty of Engineering and Technology of Multimedia University in Malaysia for his helpfulness and support in this study. And special thanks to all the firms who participated in this study.
REFERENCES
[1] A. Griffin, PDMA research on new product development practices: Updating trends and benchmarking best practices, Journal of Product Innovation Management, (1997) 14: 429-458
[2] J. Rundquist, A Chibba, The use of processes and methods in NPD- A survey of Swedish industry, International Journal of Innovation and Technology Management, Vol. 1, No. 1(2004) 37-54
[3] E. Booz, J. Allen, C. Hamilton, Management of new products, Booz-Allen & Hamilton, (1968) New York [4] E. Booz, J. Allen, C. Hamilton, New products
management for the 1980s, Booz-Allen & Hamilton, (1982) New York
[5] M. Anderson, L. Klein, Integrated product development, Springer Verlag, (1987), Berlin [6] R.G. Cooper, Third-generation new product processes,
Journal of Product Innovation Management, (1994) 11:3-14
[7] B. Yasdani, C. Holmes, Four models of design definition: Sequential, design, centered, concurrent and dynamic, Journal of Engineering Design, (1999) 10:25-37
[8] R. G. Cooper, Winning at New Products Accelerating the Process from Idea to Launch, (2001) 3rd Edn, Cambridge, MA: Perseus Publication.
[9] C. Mcdermott, R. Handfield, Concurrent development and strategic outsourcing: Do the rules change in breakthrough innovation?, Journal of High Technology Management Research, (2000) 11:35-57 [10] C.Wilson C, M. Kennedy, C. Tramell, Superior
product development: Managing the process for innovative products, The University of Tennessee, Knoxville, Blackwell Business, (1996).
[11] C. Crawford, C. Di Benedetto, New Products Management, Mcgraw-Hill, (1991) Ch. 3, P. 53. [12] A. Griffin, L. Albert, PDMA success measurement
project: Recommended measures for product success and failure, Journal of Product Innovation Management, (1996) 13: 478-496
[13] R. G. Cooper, Industrial firms’ new product strategies, Journal of Business Research, (1985) 13:107-121. [14] R. G. Cooper, E. J. Kleinschmidt, Benchmarking the
firm's critical success factors in new product development, Journal of Product Innovation Management, (1995) 12: 374-391.
[15] J. B. Quinn, Outsourcing innovation- the new engine of growth, Sloan Management Review, (2000) 41:13-28.
[16] M. Meyer, A. P. Lehnerd, The power of product platform-building value and cost leadership, Free Press: New York, (1997).
[17] B. Igel, N. Islam, Strategies for service and market development of entrepreneurial software design firms, Technovation, (2001) 21: 157-166.
[18] J. Y. Murray, M. C. H. Chao, A cross-team framework of international knowledge acquisition on NPD capabilities and new product market performance, Journal of International Marketing, (2005) 13: 54-78.