This is a published version of a paper published in BMC Microbiology.
Citation for the published paper:
Ahlinder, J., Ohrman, C., Svensson, K., Lindgren, P., Johansson, A. et al. (2012)
"Increased knowledge of Francisella genus diversity highlights the benefits of optimised
DNA-based assays"
BMC Microbiology, 12: 220
URL:
http://dx.doi.org/10.1186/1471-2180-12-220
Access to the published version may require subscription.
Permanent link to this version:
http://urn.kb.se/resolve?urn=urn:nbn:se:umu:diva-67414
R E S E A R C H A R T I C L E
Open Access
Increased knowledge of Francisella genus
diversity highlights the benefits of
optimised DNA-based assays
Jon Ahlinder
1*†, Caroline Öhrman
1†, Kerstin Svensson
1, Petter Lindgren
1, Anders Johansson
2,3,
Mats Forsman
1, Pär Larsson
1and Andreas Sjödin
1Abstract
Background: Recent advances in sequencing technologies offer promising tools for generating large numbers of genomes, larger typing databases and improved mapping of environmental bacterial diversity. However,
DNA-based methods for the detection of Francisella were developed with limited knowledge about genetic diversity. This, together with the high sequence identity between several Francisella species, means there is a high risk of false identification and detection of the highly virulent pathogen Francisella tularensis. Moreover,
phylogenetic reconstructions using single or limited numbers of marker sequences often result in incorrect tree topologies and inferred evolutionary distances. The recent growth in publicly accessible whole-genome sequences now allows evaluation of published genetic markers to determine optimal combinations of markers that minimise both time and laboratory costs.
Results: In the present study, we evaluated 38 previously published DNA markers and the corresponding PCR primers against 42 genomes representing the currently known diversity of the genus Francisella. The results highlight that PCR assays for Francisella tularensis are often complicated by low specificity, resulting in a high probability of false positives. A method to select a set of one to seven markers for obtaining optimal phylogenetic resolution or diagnostic accuracy is presented.
Conclusions: Current multiple-locus sequence-typing systems and detection assays of Francisella, could be improved by redesigning some of the primers and reselecting typing markers. The use of only a few optimally selected sequence-typing markers allows construction of phylogenetic topologies with almost the same accuracy as topologies based on whole-genome sequences.
Keywords: Bacterial-typing techniques, Optimisation, Francisella, Metagenomics, Phylogeny, Assay, Diversity, NGS, PCR
Background
The gram-negative pathogen Francisella tularensis is the causative agent of tularemia and is classified as a category-A biological-threat agent [1]. Natural transmis-sion of tularemia to humans is complex, occurring via the inhalation of infective aerosols, ingestion of contami-nated water, handling sick or dead animals, ingestion of
infected food-stuffs, or bites of infected arthropods such as ticks, biting flies or mosquitoes [2].
The genus Francisella includes a number of closely related but ecologically distinct species that can be divided into two main genetic clades [3]. These bacteria exhibit a large variety of lifestyles, including specialised intracellular pathogens of mammals (F. tularensis subsp.
tularensisand subsp. holarctica) and fish (F. noatunensis),
Francisella-like endosymbionts (FLEs) (represented here by Wolbachia persica) and freely living generalists (F. philomiragia x F. novicida) causing disease predom-inantly in humans with a compromised immune defense * Correspondence:jon.ahlinder@foi.se
†Equal contributors 1
Division of CBRN Security and Defence, FOI, Swedish Defence Research Agency, SE- 906 21, Umeå, Sweden
Full list of author information is available at the end of the article
© 2012 Ahlinder et al.; licensee BioMed Central Ltd. This is an Open Access article distributed under the terms of the Creative Commons Attribution License (http://creativecommons.org/licenses/by/2.0), which permits unrestricted use, distribution, and reproduction in any medium, provided the original work is properly cited.
[4]. The taxonomic boundaries of Francisella have recently been debated, in particular for F. novicida [5,6]. Recent breakthroughs in sequencing techniques have enabled pub-lic access to whole-genome sequences that can shed light on previously unknown diversity within the Francisella genus. The mode of genetic inheritance varies within the genus: the overall recombination rate is 34% of the genes within the Francisella core genome, although recom-bination is virtually non-existent in F. tularensis and
F. noatunensis [3,7]. These ecological and
reproduct-ive differences which lead to genetic dreproduct-iversity make
Francisella an ideal choice for evaluation of
diagnos-tic PCR-based DNA markers and developing sample sequencing methods for phylogenetic analyses.
Over the last decade, PCR methods have been success-fully applied for the rapid identification and classification of Francisella isolates [8]. An obvious drawback with DNA-based approaches is the possibility of cross-reactivity with non-pathogenic but closely related
Francisella subspecies occurring naturally in the
en-vironment [3,9,10]. This could distract biological surveil-lance systems, such as the BioWatch Program [11], and give false-positive alarms [12,13]. Therefore, primer pairs need to be defined so that an unknown isolate is identified and attributed to the correct species or subspecies. Previ-ously published sequence markers designed for identifica-tion or detecidentifica-tion of Francisella have been developed without taking into consideration the current knowledge of genetic diversity of the genus, in particular the recently discovered species F. noatunensis and F. hispaniensis.
The specificity of Francisella detection assays has often been controlled by testing reactivity with non-Francisella bacterial species. Typically, no other species besides F.
tularensis (including subspecies tularensis, mediasiatica
and holarctica), F. novicida and F. philomiragia have been included as representatives of the Francisella genus [14-17]. As with PCR detection, current knowledge on the diversity of the Francisella genus affects the choice of genetic markers used for obtaining true phylogenetic trees by PCR-based sequence-typing analysis. For F. tularensis, multi-locus typing schemes targeting overlap-ping, as well as separate, genes have been described [18,19]. However, the resolution was limited, allowing discrimination of only the major genetic clades of the species. Recent advances in sequencing and the increased availability of publicly accessible genomic sequences have enabled phylogenetic trees obtained by analysing se-quence markers to be evaluated. Whole-genome sequen-cing is not always desirable for large bacterial sample sets, as such analysis normally generates large amount of data which requires substantial increase in labour and time. Therefore, multiplexed target amplification of selected genomic regions using next generation sequen-cing (NGS) have recently been proposed [20,21].
A considerable effort in the study of bacterial patho-gens has been devoted to evaluating alternative evolu-tionary histories by comparing topologies [22-25]. In order to facilitate these comparisons, various topological distance metrics have been proposed, such as the Robinson-Foulds (RF) or symmetric distance [26], branch-score distance [27], path-length metrics [28] and nearest-neighbour interchanging [29]. To quantify simi-larity, all these metrics focus on topological features (order of nodes within the topology) and/or branch- or path-length differences (between nodes and leaves). An alternative approach would be to construct and test a parameter describing the degree of incompatibility (i.e. conflicting phylogenetic signals) between topologies. To the best of our knowledge, no such straightforward metric exists for this particular purpose of quantifying the level of incompatibility. Alternative topologies could be compared with a reference topology obtained from, e. g. the literature, a large set of concatenated genes or a source of high-quality whole-genome data. Ideally, such reference topology should mimic the species phylogeny as accurate as possible.
In this study, we evaluated the specificity of detection and classification of Francisella by first comparing pub-lished PCR primers against whole-genome sequences representing the known diversity of the genus. Second, we examined the sequence-marker robustness and reso-lution by comparing different sets of one to seven mar-kers using a modified version of the RF metric. Finally, we showed that optimal sets of markers outperform other combinations with respect to phylogenetic robust-ness and resolution.
Results
Overall fit between DNA-markers and whole-genome sequences ofFrancisella
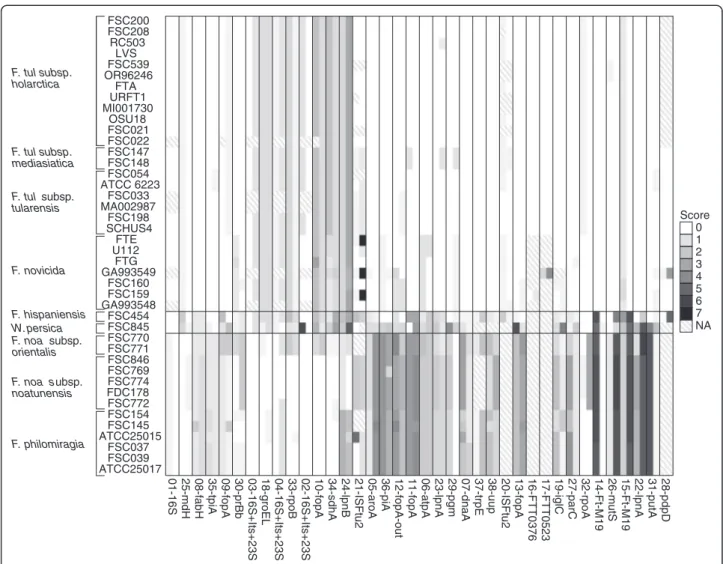
A total of 42 publicly available Francisella genome sequences were screened for sequences (Table 1) of 38 published markers (Table 2). 14 markers had incomplete sets of marker sequences (Figure 1). The lack of 16S marker sequences in FSC022, FSC033, MA002987, GA993549, and GA993548 was probably due to the low quality of the genome sequences, which were all sequenced with early versions of 454 sequencing tech-nology. The lack of sequences for the remaining 10 mar-kers was most likely because they were designed for real-time PCR molecular detection or possibly due to uncovered regions in the sequence (Additional file 1).
The primer specificities of the 38 DNA markers were calculated, resulting in scores ranging from 0 to 7.2 (Figure 1). Importantly, the calculation was performed for Francisella species besides those included in the pub-lication from which the marker originated. A primer score of zero represented a perfect match without any
mispriming events or gaps, while the maximal score of 7.2 corresponded to two mismatches in the 3’ region and a gap of 10 bases within the region targeted by a primer (see marker 21-ISFtu2). All primer scores are presented in Figure 1 and summarised in Table 2. The limit for pos-sible amplification was assumed to be a score value of two, in agreement with the NCBI Primer-BLAST default primer specificity stringency setting. Scores below two (<2) are denoted as low score and score above two (≥2) are denoted as high score [30].
Evaluation of DNA markers
The marker 01-16S [14] targeting 16S rRNA was the only marker with a low score (<1) for all the investigated gen-omes. A total of nine markers (01-16S, 03-16S-Itr-23S, 04-16S-Itr-23S, 08-fabH, 18-groEL 23-lpnA, 25-mdh, 30-prfb and 35-tpiA) had scores < 2 in all subspecies. How-ever, some of these markers, e.g. 23-lpnA, showed a clear difference in scores between clade 1 and clade 2, as clade 1 yielded almost perfect matches, while scores in clade 2 were always > 1.
Most of the included primers amplified sequences of F.
tularensis (including subspecies tularensis, mediasiatica,
and holarctica) and F. novicida of clade 1 and less fre-quently amplified sequences of F. noatunensis and F. philomiragia, of clade 2. Fifteen markers (05-aroA, 07-dnaA, 11-fopA-in, 12-fopA-out, 13-fopA, 14-FtM19, 15-FtM19, 19-iglC, 22-lpnA, 26-mutS, 27-parC, 31-putA, 36-tpiA, 37-trpE and 38-uup) gave low scores for clade 1 and high scores for clade 2. Marker 38-uup also had low scores in one isolate of philomiragia, and the marker 19-iglC had low scores in F. noatunensis subsp. orientalis and in two isolates of F. philomiragia.
Of these fifteen markers, twelve (05-aroA, 07-dnaA, 12-fopA-out, 13-fopA, 19-iglC, 22-lpnA, 26-mutS, 27-parC, 31-putA, 36-tpiA, 37-trpE and 38-uup) had low scores for F. hispaniensis FSC454 and/or W. persica FSC845 as well as low scores in clade 1. Only three (11-fopA-in, 14-Ft-M19 and 15-Ft-M19) out of the fifteen markers consistently differentiated clade 1 from the rest of the Francisella genus.
The marker 10-fopA was the only marker completely specific for clade 2 and only marker 24-lpnB was specific for F. noatunensis. Both of these exhibited lower specifi-city for F. noatunensis subsp. orientalis genomes.
Several markers displayed complex amplification pat-terns. Seven markers (02-16S-Itr-23S, 06-atpA, 09-fopA, 29-pgm, 32-rpoA, 33-rpoB, 34-sdhA) had high scores in one or more species or subspecies, e.g. the marker 09-fopA had a low score in all included strains except in F.
hispaniensis FSC454 and W. persica FSC845. Similar
results were observed for 02-16S-Itr-23S, 29-pgm, 33-rpoB and 34-sdhA.
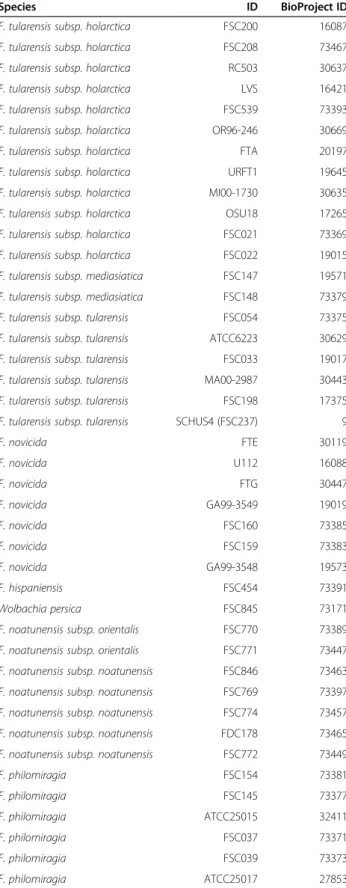
Table 1 Genomes sequences included in the study
Species ID BioProject ID
F. tularensis subsp. holarctica FSC200 16087
F. tularensis subsp. holarctica FSC208 73467
F. tularensis subsp. holarctica RC503 30637
F. tularensis subsp. holarctica LVS 16421
F. tularensis subsp. holarctica FSC539 73393
F. tularensis subsp. holarctica OR96-246 30669
F. tularensis subsp. holarctica FTA 20197
F. tularensis subsp. holarctica URFT1 19645
F. tularensis subsp. holarctica MI00-1730 30635
F. tularensis subsp. holarctica OSU18 17265
F. tularensis subsp. holarctica FSC021 73369
F. tularensis subsp. holarctica FSC022 19015
F. tularensis subsp. mediasiatica FSC147 19571
F. tularensis subsp. mediasiatica FSC148 73379
F. tularensis subsp. tularensis FSC054 73375
F. tularensis subsp. tularensis ATCC6223 30629
F. tularensis subsp. tularensis FSC033 19017
F. tularensis subsp. tularensis MA00-2987 30443
F. tularensis subsp. tularensis FSC198 17375
F. tularensis subsp. tularensis SCHUS4 (FSC237) 9
F. novicida FTE 30119 F. novicida U112 16088 F. novicida FTG 30447 F. novicida GA99-3549 19019 F. novicida FSC160 73385 F. novicida FSC159 73383 F. novicida GA99-3548 19573 F. hispaniensis FSC454 73391 Wolbachia persica FSC845 73171
F. noatunensis subsp. orientalis FSC770 73389
F. noatunensis subsp. orientalis FSC771 73447
F. noatunensis subsp. noatunensis FSC846 73463
F. noatunensis subsp. noatunensis FSC769 73397
F. noatunensis subsp. noatunensis FSC774 73457
F. noatunensis subsp. noatunensis FDC178 73465
F. noatunensis subsp. noatunensis FSC772 73449
F. philomiragia FSC154 73381 F. philomiragia FSC145 73377 F. philomiragia ATCC25015 32411 F. philomiragia FSC037 73371 F. philomiragia FSC039 73373 F. philomiragia ATCC25017 27853
Francisella genomes included in this study selected to represent the known diversity of Francisella: 22 strains representing the public health perspective of F. tularensis (clade 1) and 13 strains of F. noatunensis and F. philomiragia (clade 2) representing a fish farming industry and health perspective.
Table 2 A list of the markers selected to represent published DNA-based markers for molecular PCR detection or phylogenetic identification targetingFrancisella
Marker name/ Target gene
Gene locus_taga Amplicon
size (bp)a
Genomic locationa Reference
01-16S FTT_r04, FTT_r07, FTT_r10 1139 1311156-2294, 1378275–9413, 1771610-2748 [17,37,38,56] 02-16 s + ItS + 23 s FTT_r04, FTT_r07, FTT_r10 915 1311470-2371, 1378876–9490, 1771911-2825 [34] 03-16 s + ItS + 23 s FTT_r03-FTT_r04, FTT_r06-FTT_r07, FTT_r09-FTT_r10 948 1310519-1466, 1377638–8585, 1770973-1920 [34] 04-16 s + ItS + 23 s FTT_r03, FTT_r06, FTT_r09 925 1309613-10537, 1376732–7656, 1770067-991 [34] 05-aroA FTT_0588 650 608150-799 [18,61] 06-atpA FTT_0062 634 62762-3395 [18,61] 07-dnaA FTT_0001 618 303-920 [19] 08-fabH FTT_1373 1289 1418892-20155 [62] 09-fopA FTT_0583 886 599105-990 [19] 10-fopA FTT_0583 1068 599148-600215 [34] 11-fopA-in FTT_0583 404 599526-929 [15] 12-fopA-out FTT_0583 708 599428-600135 [15] 13-fopA FTT_0583 86 599767-852 [9,16] 14-FtM19 FTT_1472c 250 1524132-381 [56,58] 15-FtM19 FTT_1472c 316 1524066-381 [65] 16-FTT0376 FTT_0376 107 377718-824 [17] 17-FTT0523 FTT_0523 91 546620..712 [17] 18-groEL FTT_1696 803 1764659-5461 [34] 19-iglC FTT_1712c 84 1792514-597 [9,16] 20-ISFtu2b FTT_1311 390 1335726-6115 [56,59] 21-ISFtu2 FTT_0099c 97 103438-534c [9,16] 22-lpnAb FTT_0901 407 909857-10263 [19,37,38,56,57] 23-lpnA FTT_0901 93 910211-301 [9,16] 24-lpnB FTT_0904 252 911795-2046 [34] 25-mdh FTT_0535c 715 556932-7646 [63,64] 26-mutS FTT_1499 495 1553224-3718 [19] 27-parC FTT_0396 643 397063-705 [18,61] 28-pdpD FTT_1360c, FTT_1715c 136 1403503-638, 1796838-973 [56,60] 29-pgm FTT_0414 650 425033-682 [18,61] 30-prfB FTT_0191 376 207686-8061 [19] 31-putA FTT_1150c 415 1165411-825 [19] 32-rpoA FTT_0350, FTT_1442c 914 349619-50532 [64] 33-rpoB FTT_0144 262 156309-570 [34] 34-sdhA FTT_0074 223 75065-287 [34] 35-tpiA FTT_0080 484 83679-4162 [19] 36-tpiA FTT_0080 559 83657-4215 [18,61] 37-trpE FTT_1802c 517 1888928-9444 [18,61] 38-uup FTT_0445 645 459229-873 [18,61] a
Amplicon locus tag, length and location in genome of F. tularensis strain SCHU S4.
b
Primer sequence of primer Tuf1705 in marker 20-ISFtu2 and TUL-435 in marker 22-lpnA seem to be incorrectly specified in [56]. See [37] and [59] for the correct primer sequences.
c
Four detection markers (16-FTT0376, 17-FTT0523, 20-ISFtu2 and 28-pdpD) had missing data (i.e. the sequence could not be found in the genome) for all clade 2 isolates plus W. persica. The markers 16-FTT0376 and 17-FTT0523 had missing sequences for F. hispaniensis and F.
tularensissubsp. novicida, except the isolates FSC159 and
GA993549, respectively. The marker 21-ISFtu2 had miss-ing sequences as well as mismatches in almost all subspe-cies represented. A summary of the DNA-marker evaluation can be found in Table 3, and more detailed in-formation, including earlier published results for each marker, can be found in Additional file 1.
Evaluation of sample-sequencing approaches for phylogenetic analyses
In the phylogenetic comparison analysis, we focused not only on the entire Francisella genus, but also analysed
clades 1 and 2 separately. These sub-populations exhibit different lifestyles and environmental niches and are therefore of interest to different scientific fields [3,7,18]. The differences between the poorest and best resolved single marker topologies of the entire genus compared to the whole-genome reference topology (Figure 2) are highlighted in Figure 3A-C. All topologies are shown in Additional file 2. The parameter estimates of the phylo-genetic analysis are summarised in Additional file 3. In general for the analysis of the entire genus, the optimal substitution model was parameter rich, i.e. typically the generalised time-reversible (GTR) [31] or Hasegawa-Kishino-Yano (HKY85) [32] models with either invariant sites parameter (α) or rate heterogeneity over sites (Г). Moderate or even low parameter-rich substitution mod-els were favoured in the separate clade analyses, in par-ticular for clade 1, where Jukes-Cantor (JC) [33] or F. tul subsp. holarctica F. tul subsp. tularensis F. tul subsp. mediasiatica F. novicida F. hispaniensis W. persica F. noa subsp. orientalis F. noa subsp. noatunensis F. philomiragia ATCC25017FSC039 FSC037 ATCC25015FSC145 FSC154 FSC772 FDC178FSC774 FSC769 FSC846 FSC771 FSC770 FSC845 FSC454 GA993548FSC159 FSC160 GA993549FTG U112FTE SCHUS4FSC198 MA002987FSC033 ATCC 6223FSC054 FSC148 FSC147 FSC022 FSC021OSU18 MI001730URFT1 FTA OR96246FSC539 LVS RC503 FSC208 FSC200
01-16S 25-mdH 08-fabH 35-tpiA 09-fopA 30-prBb 03-16S+Its+23S 18-groEL 04-16S+Its+23S 33-rpoB 02-16S+Its+23S 10-fopA 34-sdhA 24-lpnB 21-ISFtu2 05-aroA 36-piA 12-fopA-out 11-fopA 06-atpA 23-lpnA 29-pgm 07-dnaA 37-trpE 38-uup 20-ISFtu2 13-fopA 16-FTT0376 17-FTT0523 19-iglC 27-parC 32-rpoA 14-Ft-M19 26-mutS 15-Ft-M19 22-lpnA 31-putA 28-pdpD Score 0 1 2 3 4 5 6 7 NA
Figure 1 Overview of primer specificity. Weighted score of primer specificity calculated with penalties for mismatches and gaps, where zero indicates a perfect match. The first column of each marker represents the forward primer score and the second represents the reverse primer score. The score was calculated with PrimerProspector as follows: 3’ mismatch, 1 penalty per mismatch (length of 3’ region was set to 5), non-3’ mismatch, (0.4 penalty per mismatch), last base mismatch (penalty 3 per mismatch), non 3’ gap (penalty 1 per gap) and 3’ gap (penalty 3 per gap).
HKY85 models were found to be the optimal choice
without α or Г. For clade 2, it was important to include
the proportion of invariant sites parameter in the ana-lyses, because of detected recombination events [3].
Throughout the study, to facilitate the phylogeny com-parisons, we made use of two metrics: degree of incon-gruence (inc) and difference in resolution (res). The two
topologies compared were the reference topology,
obtained from whole genome data, and the single-sequence or the concatenated marker single-sequences topology.
Results from comparing single-sequence topologies
against the reference phylogeny based on whole-genome sequences are summarised in Additional file 4. The com-parisons varied in inc, and sometimes considerably so. In the analysis of the entire genus, the 37-trpE topology did not exhibit any incongruence compared to the reference (inc = 0), although the resolution was poor. For other mar-kers, such as 08-fabH, 27-parC, 03-16 s + ItS + 23 s, 04-16 s + ItS + 23 s, 25-mutS and 36-tpiA, the topology comparisons indicated few mismatched bipartitions (inc < 0.25), whereas the opposite result was found for
11-fopA-in, 29-pgm and 30-prfB (inc > 0.35). As expected, for some single-marker topologies, particularly those with the lowest inc scores, the SH test did not reject congruence compared to the reference phylogeny.
Separate clade 1 topologies exhibited a lower average
in-congruence than topologies of the entire genus (incclade1=
0.139 vs. incgenus= 0.258, p = 6.6e-05) and clade 2
topolo-gies (incclade1= 0.139 vs. incclade2= 0.238, p = 0.0149). In
sev-eral cases, clade 1 topologies were totally congruent with no mismatched bipartitions. Some of these topologies were also congruent in clade 2: (01-16S, 03-16 s + ItS + 23 s, 04-16 s + ItS + 23 s, 07-dnaA, 08-fabH, 22-lpnA, 24-lpnB, 25-mdh, 27-parC, 30-prfB, 31-putA, 35-tpiA, 36-tpiA, 37-trpE and 38-uup). The low level of incongruence was verified by the results of the SH-test, which showed that con-gruence in the topology comparisons could not be rejected with the exception of 19-iglC. Reported incongruences in clade 1 mostly occurred in F. novi-cida. Most assignments deviating from the reference in clade 2 were due to misplacements of subspecies
F. philomiragia and F. noatunensis subsp. noatunensis.
Table 3 Summary of estimated amplification performance of primer pairs representing published DNA-based markers targetingFrancisella
Estimated amplification performance Marker id
Amplifies the entire genus 01-16S, 03-16S-Itr-23S, 04-16S-Itr-23S, 08-fabH, 18-groEL, 23-lpnAa, 25-mdh, 30-prfb and 35-tpiA.
Amplifies clade 1 but not clade 2 05-aroA, 07-dnaA, 11-fopA-inaa, 12-fopA-outa, 13-fopAa, 14-FTM19b, 15-FTM19, 19-iglCac, 22-lpnAa, 26-mutS, 27-parCc, 31-putA, 36-tpiA, 37-trpE and 38-uup. Amplifies clade 1 but no other Francisella species. 11-fopA-ina, 14-FtM19 and 15-FtM19a
Amplifies clade 1 as well as F. hispaniensis and W. persica 05-aroA, 07-dnaA, 12-fopA-outa, 27-parCcand 36-tpiA. Amplifies clade 1 as well as F. hispaniensis 13-fopAa, 19-iglCc, 22-lpnA, 31-putA, 37-trpE and 38-uup.
Amplifies clade 1 as well as W. persica 26-mutS
Amplifies clade 2 but not clade 1 10-fopA
Amplifies noatunensis but not the other species 24-lpnB
Amplifies all isolates except some certain species. 02-16S-Itr-23S, 06-atpA, 09-fopA, 29-pgm, 32-rpoA, 33-rpoB and 34-sdhA. Amplifies all except F. hispaniensis and W. persica 09-fopA
Amplifies all except F. hispaniensis 33-rpoB
Amplifies all except F. tularensis, W. persica and F. hispaniensis 34-sdhA
Amplifies all except W. persica 02-16S-Itr-23S, 29-pgm
Amplifies all except F. noatunensis subsp. orientalis 06-atpA
Amplifies all except F. noatunensis 32-rpoA
Markers with data missing for clade 2 and W. persica 16-FTT0376a, 17-FTT0523a, 20-ISFtu2band 28-pdpDb. Amplifies only F. tularensis (only when including the probe). 16-FTT0376aand 17-FTT0523a
Amplifies F. tularensis subsp. mediasiatica, F. tularensis subsp. holarctica and 6/7 F. tularensis subsp. novicida.
28-pdpDb Amplifies isolates from all clade 1 species as well as W. persica. 20-ISFtu2b Marker with missing sequences as well as mismatches in almost
all subspecies represented.
21-ISFtu2a
Successful amplification was defined as having a primer score below two in both the forward and reverse primers.
a
Have associated TaqMan probe which is not considered here.b
Detection by variable-length amplicon which is not considered here.
c
In the separate analysis of clade 1, most strains not assigned according to the reference were due to poor resolution, notably topologies of markers 32-rpoA, 37-trpE, 25-mdh, 24-lpnB and 19-iglC. The average reso-lution (res) in topologies of clade 1 was significantly
higher than clade 2 (resclade1= 0.723 vs. resclade2= 0.604,
p= 0.003) and the entire genus (resclade1= 0.723 vs.
resgenus= 0.664, p = 0.010). The correlations between the
incongruence and resolution metrics wereρ = 0.405 and
ρ = 0.484 for clade 1 and 2, respectively.
Figure 4 shows the difference in comparison metrics and average bootstrap support (boot) when markers were randomly concatenated and an optimised combin-ation of markers was selected. Table 4 lists optimal sets of two to seven markers for use in studies of the Francisella genus. Summary statistics of the optimal combinations of markers in the entire genus are summarised in Additional file 5. Results of the optimisation analyses of the separate clades are not shown. Compared to random concatenation of sequence markers, the Francisella genus topology from
an optimised set of markers reduced the difference in reso-lution by on average 50 - 59% and totally eliminated incon-gruences. The suggested combination of five gene fragments in [34] resulted in a topology comparison with res = 0.471 and inc = 0.217, whereas the corresponding opti-mal topology resulted in res = 0.176 and inc = 0.000. The average bootstrap support of the optimised topologies com-pared to the average bootstrap of random marker topolo-gies was significantly higher for congruence at the 5 marker
level (bootopt= 88.33 vs. bootrand= 86.38, p < 0.001), 6
mar-ker level (bootopt= 88.67 vs. bootrand= 87.81, p < 0.001), and
7 marker level (bootopt= 88.92 vs. bootrand= 88.29,
p< 0.001), as well as for resolution at the 6 marker level
(bootopt= 90.71 vs. bootrand= 87.81, p < 0.001).
Discussion
Knowledge about theoretical limitations of marker assays is important for the successful detection and identifica-tion of bacteria in research as well as public health con-texts. Existing methods for detection and identification
F. tularensis subsp. holarctica F. tularensis subsp. tularensis F. tularensis subsp. mediasiatica F. novicida F. philomiragia 0.02 F. noatunensis subsp. orientalis F. noatunensis subsp. noatunensis W. persica FSC021 MI001730 OSU18 FSC539 OR96246 FTA URFT1 FSC200 FSC208 RC503 LVS FSC504 ATCC6223 FSC198 SCHUS4 FSC147 FSC148 FSC159 FSC160 FTE U112 FTG FSC454 FSC845 FSC770 FSC771 FDC178 FSC769 FSC846 FSC774 FSC772 ATCC25017 FSC037 FSC039 FSC145 FSC154 ATCC25015 Clade 1 Clade 2 F. hispaniensis
Figure 2 Whole-genome SNP phylogeny. The whole-genome phylogeny for 37 Francisella strains obtained with model averaging
of Francisella were developed with limited knowledge about the genetic diversity within the Francisella genus. From a clinical perspective, the lack of knowledge of di-versity in the environment may be of minor importance since diagnostic sampling is performed on humans or animals suspected of having the disease. In contrast, use of the same detection assays for environmental sampling can lead to problems with false positive results. The re-cent increase in publicly available genome sequences enables development of improved detection and identifi-cation methods for both purposes. The emergence of high-throughput typing of large collections of bacterial strains targeting single amplicons is likely to mean that the targeting of single-marker regions will continue to be important in the future [20].
In this study, we evaluated 38 published markers (Table 2) against the current known diversity of the
Francisellagenus. It is important to note that the studies
from which the markers were gathered differed widely in scope. Some studies were designed to only cover a spe-cific species and exclude others, whereas in other studies it was not of interest or even possible to study all the
Francisellaspecies included here. Several of the included
markers were amplifying sequence products for species not included in previous studies of Francisella, e.g. F. hispaniensis, F. noatunensis and W. persica. As many as one third of the markers amplified all the included sub-species and approximately half of the markers amplified products for F. hispaniensis and/or W. persica together with clade 1 or clade 2. This indicates that strains belonging to F. hispaniensis, W. persica, F. noatunensis are responsible for several false identifications. It should be pointed out that we have only considered sequence based markers here. Other type of markers and marker
0.02
C
F. tularensis subsp. holarctica F. tularensis subsp. mediasiatica F. tularensis subsp. tularensis F. novicida F. noatunensis subsp. orientalis F. noatunensis subsp. noatunensis 0.02
B
F. tularensis, F. novicida Wolbachia persica F. noatunensis subsp. orientalisF. hispaniensis F. philomiragia, F. noatunensis subsp. noatunensis 0.05
A
F. tularensis F. novicidaF. noatunensis subsp. orientalis
F. noatunensis subsp. noatunensis Wolbachia persica F. hispaniensis F. philomiragia F. hispaniensis Wolbachia persica F. philomiragia
Figure 3 Single-marker phylogenies. Single-marker phylogeny of the Francisella genus: (A) highest ranked marker 08-fabH, (B) lowest ranked marker 33-rpoB, and (C) whole-genome phylogeny. Rank is based on difference in resolution between alternative and whole-genome topology.
combinations can be fruitful, in particular for construc-tion of sub-species specific assays, which has been shown by e.g. combining variable-number of tandem repeats (VNTR) and insertion-deletion (indel) markers [35] or SNP and indel markers [36].
Specificity is especially important for markers designed for detection. The results of the investigated detection markers suggested that the specificity was questionable
for the majority of them. The marker 22-lpnA [37,38], designated for F. tularensis detection, was found to also amplify F. hispaniensis FSC454 [39]. In the present study, the primers of the genus-specific marker 13-fopA [16] were not predicted to amplify any of the included F. philomiragia, whereas in the original publication they were reported to amplify all included F. philomiragia isolates. Probably a large unknown diversity exists within this species. For almost all 11 detection markers for Francisella tularensis, there was a significant risk of false-negative results caused by unwanted mismatches for isolates that should be detected. In conclusion, pri-mer sequences need to be continually evaluated and redesigned using up-to date knowledge of the genetic di-versity of the targeted sequences to minimise the likeli-hood of false-positive or -negative results. A similar conclusion was published by [40] where false-positive and -negative hits of primers against publically available sequences in various species of bacteria were evaluated with the result of high degree of primer mismatch in Haemophilus influenza, Pseudomonas aeruginosa and Escherichia coli. Hence, primer miss-match seems to be a general problem within prokaryotes. Our evaluation approach for primers could subsequently be of benefit to the microbiological community.
In order to compare analyses based on PCR-based se-quence data with analyses based on whole-genome data for making phylogenetic inferences, we partitioned the popular RF metric into two separate metrics, incompati-bility and resolution, to enable comparison of an alterna-tive topology with a reference topology. These two metrics explain different characteristics, which allow a particular question to be considered when evaluating the phylogeny of bacteria given the reference topology. In the genomes of Francisella analysed here, these two metrics were correlated and therefore displaying similar metric characteristics, albeit with some exceptions, par-ticularly in the clade 1 analysis. The incompatibility metric was negatively correlated with nucleotide diver-sity, whereas the opposite was found for the resolution metric, which highlights differences in the characteristics of these metrics. This finding suggests that single-nucleotide polymorphisms (SNPs) in marker-sequence regions increase the resolution but may also compromise the phylogenetic signal. One possible explanation for the incompatibility of SNPs and whole-genome phylogeny is the presence of recombination within sequence frag-ments, which has been suggested by several previous analyses of pathogenic bacteria populations; i.e. Neisseria
meningitidis [22,25,41], Staphylococcus aureus [22,42]
and Escherichia coli [22,43]. Nonetheless, for analysis of large numbers of bacterial strains showing conflicting topologies using different combinations of markers, our proposed comparison metrics are useful measures. To
0.0 0.1 0.2 0.3 0.4 0.5 0.2 0.4 0.6 0.8 75 80 85 90 2 3 4 5 6 7 x x x x x x 7 6 5 4 3 2 7 6 5 4 3 2 x x x x x x A B C Number of MLST markers Incong ruence Resolution A v er age bootstr a p suppor t
Figure 4 The impact of the number of markers on phylogenetic parameters. The effect of concatenating sequence markers on topology (of the Francisella genus) in comparison with the whole-genome tree for (A) incongruence score, (B) resolution score, and (C) average bootstrap support from 1000 replicates. The results of the optimised topology comparisons are shown as crosses.
determine whether the observed topological differences could have occurred by chance, our comparison ap-proach can be combined with a statistical test, such as the SH test applied here or an alternative test, e.g. [44,45].
Most incompatibilities were associated with the top-ologies that included all strains, whereas the level of in-compatibility was significantly lower for clade 1, with topologies being totally compatible in many cases. These results indicate that the clonal frame is maintained within the F. tularensis clade, but it is disrupted at the genus level and in clade 2. Most incompatibilities were a result of F. philomiragia, F. novicida, W. persica and F.
hispaniensis strains that were misplaced in the
single-marker cases, which suggests that recombination is the main evolutionary force that promotes incongruences in Francisella, as pointed out by, e.g. [7,18]. The reduction of recombination rate in clade 1 might, in turn, reflect barriers to gene flow between ecological and geograph-ical clusters among sub-species [7,46-49].
Our result suggests that no single-marker topology of the entire genus is able to assign all strains to the sub-species defined by the whole genome topology. In fact, some marker topologies, such as 02-16 s + ItS + 23 s and 24-rpoB, made deviating assignments in more than 70% of the cases. The reason for the low success rate of assigned strains to their corresponding sub-species is mainly poor resolution, which meant that typically all F.
tularensis strains displayed identical sequences. Most
topologies assigned all strains to the same main clades as in the whole genome phylogeny, with a few excep-tions: 33-rpoB assigned F. hispaniensis to clade 2 and 19-iglC assigned W. persica to clade 2, in subgroup F.
noatunensissubsp. orientalis (in both assignments). This
is an interesting observation as rpoB was recently sug-gested as an alternative marker to 16S rDNA in metage-nomic studies [21].
The level of incompatibility and difference in resolution compared to the whole-genome reference topology were decreased, in some cases by a considerable amount, by selecting an optimal combination of markers. Moreover, topologies based on an optimal set of markers significantly increased the average statistical support (i.e. average boot-strap). Generally, both the degree of compatibility and resolution were improved by concatenating sets of two to seven markers in all possible combinations. However, some combinations, in particular considering incompati-bility, might result in poorer topologies than for an estimated topology based on a single marker. This obser-vation is consistent with previous work where conca-tenation of sequence data have resulted in biased phylogenetic estimates [50]. All incompatible phylogenetic signals were removed in topologies based on optimised sets of two to seven markers, in contrast to random con-catenation. Totally congruent topologies were obtained by concatenating as few as only two markers (08-fabH and 35-tpiA). These two markers were included in all optimal sets. Hence, by selecting an optimal set of markers, a large improvement in resolution and compatibility can be obtained over random concatenation.
An exhaustive search strategy was employed to find the optimal set of markers since the total number of available markers was relatively small. It should be pointed out that the number of possible marker combinations increases rapidly with the number of markers considered and soon becomes computationally intractable. As all the
Table 4 Summary of the optimisation procedure for resolution (res) and congruence (inc) in theFrancisella genus where the consensus set of markers are highlighted according to how often they are selected in the optimal partitions of markers; position 1 corresponds to the most represented marker
Position 1 2 3 4 5 6 7
No of markers Metric
2 res 08-fabH 35-tpiA
inc 08-fabH 35-tpiA
3 res 08-fabH 35-tpiA 24-lpnB
inc 08-fabH 35-tpiA 02-16 s
4 res 08-fabH 35-tpiA 24-lpnB 27-parC
inc 35-tpiA 08-fabH 01-16S 02-16 s
5 res 08-fabH 35-tpiA 24-lpnB 27-parC 22-lpnA
inc 35-tpiA 08-fabH 24-lpnB 27-parC 33-rpoB
6 res 08-fabH 24-lpnB 35-tpiA 27-parC 22-lpnA 25-mdh
inc 35-tpiA 08-fabH 24-lpnB 04-16 s 01-16S 33-rpoB
7 res 08-fabH 35-tpiA 24-lpnB 26-mutS 27-parC 18-groEL 22-lpnA
inc 35-tpiA 08-fabH 01-16S 04-16 s 24-lpnB 27-parC 25-mdh
742 gene fragments of the core genome in the analysed population have recently become available in [3], an interesting extension to the current work would be to find the optimal set of markers based on all those genes. Such an optimisation could be carried out by utilising one of the myriad of available optimisation techniques, such as a simulated annealing approach [51,52]. It should be noted that we do only try to minimize the value of the objective metrics, incongruence or resolution difference, with respect to the whole-genome topology. There is no guarantee that the whole genome topology accurately resembles the true underlying species topology as sys-tematic errors and statistical inconsistencies in the phylo-genetic inference method could be amplified when analyzing whole genome data [50,53-55].
By demonstrating the potential of establishing robust bacterial phylogenies using sample sequencing of only a few markers, we believe that the framework presented here could serve as a foundation for population analyses as well as for identifying and attributing unknown pathogenic strains to the correct subspecies.
Conclusions
The results of this study suggest that several of the investi-gated markers designed to be diagnostic exhibit a consider-able level of unspecificity. Hence, several of the currently used primers need to be redesigned to avoid false-positive results. This arises because of a previous lack of knowledge about genetic diversity within the Francisella genus repre-sented by, e.g. strains belonging to F. hispaniensis and among FLEs. By employing sample sequencing of DNA markers to make phylogenetic inferences, we revealed incompatibilities among topologies that included all con-sidered Francisella strains but not among topologies that included only clade 1 strains containing F. tularensis. An estimated topology based on optimised combination of markers drastically reduced incompatibility and resolution differences compared to topologies obtained by random concatenation and at the same time improved the average bootstrap support, using the whole genome phylogeny as a reference. Implementation of such an optimisation frame-work based on accurate reference topology would help to improve assays for detection and identification purposes, which are of considerable importance in a number of re-search fields, such as for improving biosurveillance systems and inferring evolutionary histories.
Methods Bacterial strains
A total of 37 genome sequences (Table 1) were selected to represent the known diversity of Francisella. This col-lection included both pathogenic and non-pathogenic strains and could be divided into two major clades. The public-health perspective was represented by 22 strains
of the human pathogen F. tularensis (clade 1) and the fish-farming industry and health perspective was repre-sented by 13 strains of F. noatunensis and F. philomira-gia, which are all fish pathogens (clade 2). In addition, the strain Wolbachia persica FSC845, representing the FLEs, and the newly discovered F. hispaniensis FSC454 were included. More detailed information about the included strains has been published elsewhere [3].
PCR markers
The study focused on a set of 38 markers used in detection or identification of Francisella (Table 2). A subset of 13 markers (01-16S [14,37,38,56], 22-lpnA [19,37,38,56,57], 13-fopA, 19-iglC, 21-ISFtu2, 23-lpnA [9,16], 11-fopA-in, 12-fopA-out [15], 14-FtM19 [56,58], 16-FTT0376, 17-FTT0523 [17], 20-ISFtu2 [56,59] and 28-pdpD [56,60]) were originally designed primarily for real-time PCR molecular detection of
Francisella at different taxonomic levels; genus, species or
subspecies (here called detection markers).
A subset of 25 markers (02-16S + ItS + 23S, 03-16S + ItS + 23S, 04-16S + ItS + 23S, 10-fopA, 18-groEL, 24-lpnB, 33-rpoB, 34-sdhA [34], 05-aroA, 06-atpA, 27-parC, 29-pgm, 36-tpiA, 37-trpE, 38-uup [18,61] 07-dnaA, 09-fopA, 26-mutS, 30-prfB, 31-putA, 35-tpiA [19], 08-fabH [62], 25-mdh [63,64] 32-rpoA [64], 15-FtM19 [65]), which were originally designed for PCR-based identification (here called identification markers), were also included.
The primer specificity was tested for all 38 markers. In the topological comparisons and optimisation proce-dures, 28, 27 and 26 markers were used for clade 1, clade 2 and the whole-genome data, respectively (see Additional file 1 for details).
In silico PCR
PCR fragments were assumed to result from all included genomes rather than exclusively the genomes considered in developing the marker. An in silico PCR fragment was first generated for one selected isolate (F. tularensis subsp.
tularensisSCHU S4, F. tularensis subsp. holarctica FSC200
or F. noatunensis subsp. noatunensis FSC769) using
multi-threaded electronic PCR (mismatches allowed = 4,
expected length = 2000 bp, margin = 400 bp, honouring IUPAC ambiguity in STS) [66], which is an enhanced ver-sion of electronic PCR [67] . This fragment was then aligned to the rest of the genomes using Exonerate v2.2.0 (model: est2genome, percent threshold = 70, score thresh-old = 50, maxintron length = 2500) [68]. Finally, all frag-ments for each marker were aligned using MUSCLE v3.7 using default settings [69].
PCR-primer scoring
Primer specificity was evaluated by scoring each primer sequence against the corresponding in silico generated target sequences using PrimerProspector [70]. To direct
the scoring to the region where the primer sequence aligned for all strains, the primer region was extracted from the alignment and used alone as input to the scor-ing software. The weighted score was calculated based on 3’ mismatch (penalty 1 per mismatch, 3’ length 5), non-3’ mismatch (penalty 0.4 per mismatch), last-base mismatch (penalty 3 per mismatch), non 3’ gap (penalty 1 per gap) and 3’ gap (penalty 3 per gap). The lowest possible score in this type of calculation is zero, which is only achieved when the primer is a perfect match. The score, which is based on mismatches and gaps, is dependent on primer length, and thus a max score can-not be given. The limit for a possible PCR amplification was set to 2, in agreement with the NCBI Primer-BLAST default primer specificity stringency setting for amplification, i.e. at least two mismatches in the 3’ re-gion. According to latter system, scores below two are regarded as low scores, whereas scores greater than or equal to two are regarded as high scores. Calculated scores for forward and reverse primers for each strain were clustered with DIvisive ANAlysis clustering in the cluster package [71] and then plotted in a heatmap using the ggplot2 package [72] in R v2.13.1 [73].
Phylogenetic analysis
Phylogenetic trees were inferred using two alternative methods: neighbour joining (NJ) [74] and maximum like-lihood (ML) [75]. The software packages PhylML 3.0 [76,77] and Phylip [78] were used. In the NJ analysis, 1000 bootstrap replicates were calculated in the software Seqboot and summarised in the Consense software. The genetic distances between strains were estimated with the software Dnadist by employing the F84 nucleotide substitution model [79]. The NJ tree was inferred with the Neighbour software, in the Phylip package [76]. By using the software jModelTest [80], we were able to evaluate alternative nucleotide substitution models for the maximum likelihood analysis and perform model averaging [81], in which the alternative models were weighted based on the fit to the data and model com-plexity (i.e. the number of effective parameters in each substitution model) using the Bayesian information cri-terion (BIC) [82]. Substitution models with unequal base
frequencies, a proportion of invariable sites,α, and
allow-ance for rate variation among sites,Г, were included. The
number of discrete gamma categories was 4. In total, we considered 24 alternative substitution models in the model-averaging process. The more computationally in-tense ML procedure was chosen to estimate phylogenies in the single-marker analysis, whereas the rapid NJ method was utilised in the multiple marker analyses. The whole-genome phylogeny was estimated with both the ML and NJ methods by considering 20,072 SNPs on the core gen-ome of all 37 gengen-omes. The SNPs were obtained using the
same procedure as in [3], where the Mauve software [83] with default options was used to perform multiple gen-ome alignment and in-house perl-script was used to identify the SNPs based on the obtained alignments. As both ML and NJ methods resulted in virtually identical phylogenies, we concluded that the choice of estimation method did not have a significant impact on the evalu-ation of the sequence-marker topologies.
Phylogenetic-topology comparison
To check for and quantify the degree of compatibility between the phylogenetic trees estimated with marker-sequence data and the whole-genome tree (i.e. two trees with nested taxa), bipartitions in the marker tree were checked for their presence/absence in the whole-genome tree. In trees with missing sequences, the corresponding leaves were removed from the whole-genome tree using the R package ape [84]. The output, i.e. number of ab-sent bipartitions, were normalised by the total number of bipartitions in the marker tree. This topology metric was denoted inc throughout the study. For perfectly compatible trees, no bipartitions in the marker tree should be absent in the whole-genome tree. To obtain the bipartitions at the internal edges of the trees, the output from the Consense software in the Phylip pack-age [78], together with an in-house Perl script (available upon request), were used. The inc metric is similar to the RF distance [26], although the RF metric counts the number of bipartitions not present in the other tree for both trees. Therefore, the RF metric measures both the degree of incongruence and the difference in resolution between reference and alternative topologies. By modify-ing the RF distance metric, the degree of incongruence can be quantified more precisely and also separated from the difference in resolution between the compared topolo-gies. In a similar manner, a Perl script was implemented to count the number of bipartitions present in the whole-genome topology that were absent in the alternative top-ology (i.e. difference in resolution, denoted res) and to normalise the output to vary between 0 and 1. As a refer-ence, RF distances (also known as symmetric differences) implemented in the Treedist software [78] were used. To investigate the success of the marker tree to allocate a strain to its corresponding sub-species family (according to the whole genome phylogeny), bipartition scoring in the Consense software was used and the output was com-pared to the pre-defined subspecies bipartitions according to the whole-genome tree. In addition, we investigated whether strains were assigned to the corresponding main clades of the entire Francisella genus, reporting the pro-portion of misidentified strains on each clade. Finally, we considered the average bootstrap support of each marker tree.
It is important to consider a statistical test for topo-logical incongruence as stochastic effects in the evolu-tion of the sequences results in incongruence between
the compared trees. To address this issue, we
employed the Shimodaira-Hasegawa (SH) test [85],
which is a non-parametric test for determining
whether there are significant differences between con-flicting topologies in specific sequence data. The null hypothesis of the SH test assumed that the compared topologies were equally probable given the data. Here, we tested the marker topologies and the whole-genome topology on each respective marker sequence using the phyML software package by fixing the top-ologies and optimising the substitution model and branch-length parameters. The SH test was performed within the CONSEL software package [86], which takes the output from phyML as input. Since multifurcations in topologies are strongly penalised in the phyML software, we resolved the topologies into bifurcating trees using the R package ape [84]. The substitution model selected in the phyML analysis was based on the preferred substitution model of the jModelTest analysis. To test whether clades differed in incongruence or resolution, a Wilcoxon rank sum test with continuity correction was utilised, imple-mented in the R statistical package [73]. We used Spear-man’s rank correlation coefficient, ρ, to quantify correlations between metrics and the average pairwise
nu-cleotide diversity,π, of the clades.
Optimisation procedure
Since the number of included sequence markers in this study was moderate, we searched through all possible combinations of markers (i.e. an exhaustive search). We performed two separate analyses, one for each of the metrics used: incongruence and difference in resolution between topologies. The marker config-uration(s) resulting in the lowest metric value were saved. The code was written in Perl and is available upon request from JA.
To test whether the average bootstrap support obtained from optimised topologies and topologies gen-erated by random concatenation differed, we again made use of the Wilcoxon rank sum test with continuity cor-rection in cases where more than 10 optima were found. The null hypothesis was that the level of average boot-strap support was equivalent for the optimised and ran-domised topologies. Due to the high computational demands, we only analysed 100 topologies obtained by random concatenation of sequences with respect to bootstrap support. Furthermore, we compared the opti-mal topology identified here to the topology obtained by analysing the sequence combination suggested by [34]: 33-rpoB, 10-fopA, 18-groEL, 24-lpnB and 34-sdhA.
Additional files
Additional file 1: Summary of earlier published and current results of investigated sequence markers. A list of earlier published as well as current results of the specificity of each marker at subspecies level, presence/absence of the markers in the different clades, details of which parts of the study the marker was included and marker type.
Additional file 2: Single-marker topologies. A zip-file containing all single-marker topologies in pdf format obtained from the model-averaging phylogenetic analysis using jModelTest.
Additional file 3: Parameter estimates obtained from the phylogenetic analysis. Summary statistics of the single-marker phylogenetic analysis. The most optimal DNA substitution model was selected by BIC implemented in jModelTest. Standard errors of average bootstrap supports are shown in parentheses. The estimated proportion of invariable sites is the expected frequency of sites that do not evolve. Additional file 4: Table of single-marker results. Comparison of inferred single-gene topologies to the whole-genome topology with respect to RF distance degree of incongruence, difference in resolution, the proportion of misidentified strains and SH test of incongruence. To test alternative topologies for markers with missing sequences, the corresponding leaves were removed from the whole-genome tree. Additional file 5: Optimal set of marker partitions. Optimisation of the subset of two to seven marker-sequence topologies to minimise incongruences and difference in resolution compared to the whole-genome topology. The numbers show the percentage of each marker included in the optimal configurations. The proportion of strains misplaced in the tree, average bootstrap support of optimal topologies and the SH test of incongruence is also reported. The total number of global optima was calculated from the output of the heuristic search analyses.
Abbreviations
BIC: Bayesian information criterion; Clade 1: Population including F. tularensis subspecies; Clade 2: Population including F. noatunensis subspecies and F. philomiragia; Entire genus: Entire genus all included strains representing all known subspecies; FLEs: Francisella like endosymbionts; GTR: Generalised time reversible; HKY85: Hasegawa-Kishino-Yano; Indel: Insertion-deletion; JC: Jukes Cantor; ML: Maximum likelihood; NGS: Next generation sequencing; NJ: Neighbour joining; RF: Robinson-Foulds; SH: Shimodaira-Hasegawa; SNP: Single-nucleotide polymorphisms; VNTR: Variable number of tandem repeats.
Authors’ contributions
JA and CÖ wrote script code, extracted and analysed the data; JA, CÖ, and AS wrote the manuscript; KS, PLI, AJ, MF, PLA contributed to writing the manuscript; AJ, MF, PLA and AS organised and conceived the study. All authors read and approved the final manuscript.
Acknowledgements
This project was funded by the Swedish Ministry of Foreign Affairs, project A4952, the Swedish Civil Contingencies Agency, project B4055 and the Swedish Ministry of Defence, project A404012. We wish to thank the associate editor and three anonymous reviewers for comments that improved an earlier version of the paper.
Author details
1Division of CBRN Security and Defence, FOI, Swedish Defence Research Agency, SE- 906 21, Umeå, Sweden.2Department of Clinical Microbiology, Umeå University, SE–901 85, Umeå, Sweden.3Laboratory for Molecular Infection Medicine Sweden (MIMS), Umeå University, SE–901 87, Umeå, Sweden.
Received: 4 June 2012 Accepted: 31 August 2012 Published: 25 September 2012
References
1. Rotz LD, Khan AS, Lillibridge SR, Ostroff SM, Hughes JM: Public health assessment of potential biological terrorism agents. Emerg Infect Dis 2002, 8:225–230.
2. Beran GW, Steele JH: Handbook of Zoonoses: Section A: Bacterial, Rickettsial, Chlamydial, and Mycotic Zoonoses. 2nd edition. Boca Raton: CRC-Press; 1994. 3. Sjödin A, Svensson K, Öhrman C, Ahlinder J, Lindgren P, Duodu S,
Johansson A, Colquhoun DJ, Larsson P, Forsman M: Genome characterisation of the genus Francisella reveals similar paths of host adaption in pathogens of mammals and fish. BMC Genomics 2012, 13:268. 4. Hollis DG, Weaver RE, Steigerwalt AG, Wenger JD, Moss CW, Brenner DJ:
Francisella philomiragia comb. nov. (formerly Yersinia philomiragia) and Francisella tularensis biogroup novicida (formerly Francisella novicida) associated with human disease. J Clin Microbiol 1989, 27:1601–1608. 5. Johansson A, Celli J, Conlan W, Elkins KL, Forsman M, Keim PS, Larsson P,
Manoil C, Nano FE, Petersen JM, Sjöstedt A: Objections to the transfer of Francisella novicida to the subspecies rank of Francisella tularensis. Int J Syst Evol Microbiol 2010, 60:1717–1718. author reply 1718–20.
6. Busse H-J, Huber B, Anda P, Escudero R, Scholz HC, Seibold E, Splettstoesser WD, Kämpfer P: Objections to the transfer of Francisella novicida to the subspecies rank of Francisella tularensis - response to Johansson et al. Int J Syst Evol Microbiol 2010, 60:1718–1720.
7. Larsson P, Elfsmark D, Svensson K, Wikström P, Forsman M, Brettin T, Keim P, Johansson A: Molecular evolutionary consequences of niche restriction in Francisella tularensis, a facultative intracellular pathogen. PLoS Path 2009, 5:e1000472.
8. Johansson A, Ibrahim A, Göransson I, Eriksson U, Gurycova D, Clarridge JE, Sjöstedt A: Evaluation of PCR-based methods for discrimination of Francisella species and subspecies and development of a specific PCR that distinguishes the two major subspecies of Francisella tularensis. J Clin Microbiol 2000, 38:4180–4185.
9. Barns SM, Grow CC, Okinaka RT, Keim P, Kuske CR: Detection of diverse New Francisella-like bacteria in environmental samples. Appl Environ Microbiol 2005, 71:5494–5500.
10. Keim P, Pearson T, Okinaka R: Microbial forensics: DNA fingerprinting of Bacillus anthracis (Anthrax). Anal Chem 2008, 80:4791–4800.
11. Shea DA, Lister SA: The BioWatch Program: Detection of Bioterrorism, Congressional Research Service.Report No. RL 32152. Washington, DC: Library of Congress; 2012. November 19, 2003. Accessed online at http://www.fas. org/sgp/crs/terror/RL32152.html on March 9, 2012.
12. Kman NE, Bachmann DJ: Biosurveillance: a review and update. Adv Prev Med 2012, 2012:301408.
13. Bush NS: BioWatch: case for change of traditional leadership to improve performance. Monterey: Master’s Thesis. Naval Postgraduate School; 2009. 14. Forsman M, Sandström G, Sjöstedt A: Analysis of 16S ribosomal DNA
sequences of Francisella strains and utilization for determination of the phylogeny of the genus and for identification of strains by PCR. Int J Syst Bact 1994, 44:38–46.
15. Higgins JA, Hubalek Z, Halouzka J, Elkins KL, Sjostedt A, Shipley M, Ibrahim MS: Detection of Francisella tularensis in infected mammals and vectors using a probe-based polymerase chain reaction. Am J Trop Med Hyg 2000, 62:310–318.
16. Versage JL, Severin DDM, Chu MC, Petersen JM: Development of a multitarget real-time TaqMan PCR assay for enhanced detection of Francisella tularensis in complex specimens. J Clin Microbiol 2003, 41:5492–5499.
17. Mitchell JL, Chatwell N, Christensen D, Diaper H, Minogue TD, Parsons TM, Walker B, Weller SA: Development of real-time PCR assays for the specific detection of Francisella tularensis ssp. tularensis, holarctica and mediaasiatica. Mol Cell Probe 2010, 24:72–76.
18. Svensson K, Larsson P, Johansson D, Byström M, Forsman M, Johansson A: Evolution of subspecies of Francisella tularensis. J Bact 2005,
187:3903–3908.
19. Nübel U, Reissbrodt R, Weller A, Grunow R, Porsch-Ozcürümez M, Tomaso H, Hofer E, Splettstoesser W, Finke E-J, Tschäpe H, Witte W: Population structure of Francisella tularensis. J Bact 2006, 188:5319–5324. 20. Singh P, Foley SL, Nayak R, Kwon YM: Multilocus sequence typing of
Salmonella strains by high-throughput sequencing of selectively amplified target genes. J Microbiol Meth 2012, 88:127–133.
21. Vos M, Quince C, Pijl AS, de Hollander M, Kowalchuk GA: A comparison of rpoB and 16S rRNA as markers in pyrosequencing studies of bacterial diversity. PLoS One 2012, 7:e30600.
22. Feil EJ, Holmes EC, Bessen DE, Chan MS, Day NP, Enright MC, Goldstein R, Hood DW, Kalia A, Moore CE, Zhou J, Spratt BG: Recombination within natural populations of pathogenic bacteria: short-term empirical
estimates and long-term phylogenetic consequences. P Natl Acad Sci USA 2001, 98:182–187.
23. Lerat E, Daubin V, Moran NA: From gene trees to organismal phylogeny in prokaryotes: the case of the gamma-Proteobacteria. PLoS Biol 2003, 1:E19. 24. Noël C, Dufernez F, Gerbod D, Edgcomb VP, Delgado-Viscogliosi P, Ho L-C,
Singh M, Wintjens R, Sogin ML, Capron M, Pierce R, Zenner L, Viscogliosi E: Molecular phylogenies of blastocystis isolates from different hosts: implications for genetic diversity, identification of species, and zoonosis. J Clin Microbiol 2005, 43:348–355.
25. Holmes EC, Urwin R, Maiden MC: The influence of recombination on the population structure and evolution of the human pathogen Neisseria meningitidis. Mol Biol Evol 1999, 16:741–749.
26. Robinson D, Foulds L: Comparison of phylogenetic trees. Math Biosci 1981, 53:131–147.
27. Kuhner MK, Felsenstein J: A simulation comparison of phylogeny algorithms under equal and unequal evolutionary rates. Mol Biol Evol 1994, 11:459–468.
28. Steel MA, Penny D: Distributions of tree comparison metrics–some new results. Syst Biol 1993, 42:126–141.
29. Waterman MS, Smith TF: On the similarity of dendrograms. J Theor Biol 1978, 73:789–800.
30. Primer-BLAST, NCBI. http://www.ncbi.nlm.nih.gov/tools/primer-blast. 31. Tavare S: Some probabilistic and statistical problems in the analysis of
DNA sequences. Lect Math Life Sci 1986, 17:57–86.
32. Hasegawa M, Kishino H, Yano T: Dating of the human-ape splitting by a molecular clock of mitochondrial DNA. J Mol Evol 1985, 22:160–174. 33. Jukes TH, Cantor CR: Evolution of protein molecules. In Mammalian Protein
Metabolism vol.3. Edited by Munro HN. New York: Academic Press; 1969:21–132.
34. Bohle H, Tapia E, Martínez A, Rozas M, Figueroa A, Bustos P: Francisella philomiragia, bacteria asociada con altas mortalidades en salmones del Atlántico (Salmo salar) cultivados en balsas-jaulas en el lago Llanquihue. Arch Medi Veter 2009, 41:237–244.
35. Larsson P, Svensson K, Karlsson L, Guala D, Granberg M, Forsman M, Johansson A: Canonical insertion-deletion markers for rapid DNA typing of Francisella tularensis. Emerg Infect Diseases 2007, 13:1725–1732. 36. Svensson K, Granberg M, Karlsson L, Neubauerova V, Forsman M, Johansson
A: A real-time PCR array for hierarchical identification of Francisella isolates. PLoS One 2009, 4:e8360.
37. Sjöstedt A, Eriksson U, Berglund L, Tärnvik A: Detection of Francisella tularensis in ulcers of patients with tularemia by PCR. J Clin Microbiol 1997, 35:1045–1048.
38. Johansson A, Berglund L, Eriksson U, Göransson I, Wollin R, Forsman M, Tärnvik A, Sjöstedt A: Comparative analysis of PCR versus culture for diagnosis of ulceroglandular tularemia. J Clin Microbiol 2000, 38:22–26. 39. Versage JL, Severin DDM, Chu MC, Petersen JM: Development of a multitarget
real-time TaqMan PCR assay for enhanced detection of Francisella tularensis in complex specimens. J Clin Microbiol 2003, 41:5492–5499.
40. Lemmon GH, Gardner SN: Predicting the sensitivity and specificity of published real-time PCR assays. Ann Clin Microbiol Antimicrob 2008, 7:18. 41. Urwin R, Holmes EC, Fox AJ, Derrick JP, Maiden MCJ: Phylogenetic
evidence for frequent positive selection and recombination in the Meningococcal surface antigen PorB. Mol Biol Evol 2002, 19:1686–1694. 42. Sabat AJ, Wladyka B, Kosowska-Shick K, Grundmann H, van Dijl JM, Kowal J,
Appelbaum PC, Dubin A, Hryniewicz W: Polymorphism, genetic exchange and intragenic recombination of the aureolysin gene among Staphylococcus aureus strains. BMC Microbiol 2008, 8:129.
43. Retchless AC, Lawrence JG: Phylogenetic incongruence arising from fragmented speciation in enteric bacteria. P Natl Acad Sci USA 2010, 107:11453–11458.
44. Campbell V, Legendre P, Lapointe F-J: The performance of the Congruence Among Distance Matrices (CADM) test in phylogenetic analysis. BMC Evol Biol 2011, 11:64.
45. Irestedt M, Fjeldså J, Nylander JAA, Ericson PGP: Phylogenetic relationships of typical antbirds (Thamnophilidae) and test of incongruence based on Bayes factors. BMC Evol Biol 2004, 4:23.
46. Keim P, Johansson A, Wagner DM: Molecular epidemiology, evolution, and ecology of Francisella. Ann NY Acad Sci 2007, 1105:30–66. 47. Achtman M: Evolution, population structure, and phylogeography of
genetically monomorphic bacterial pathogens. Ann Rev Microbiol 2008, 62:53–70.
48. Keim PS, Wagner DM: Humans and evolutionary and ecological forces shaped the phylogeography of recently emerged diseases. Nat Rev Microbiol 2009, 7:813–821.
49. Thelaus J, Andersson A, Mathisen P, Forslund A-L, Noppa L, Forsman M: Influence of nutrient status and grazing pressure on the fate of Francisella tularensis in lake water. FEMS Microbiol Ecol 2009, 67:69–80. 50. Kubatko LS, Degnan JH: Inconsistency of phylogenetic estimates from
concatenated data under coalescence. Syst Biol 2007, 56:17–24. 51. Spall JC: Introduction to Stochastic Search and Optimization. Hoboken, NJ:
Wiley; 2003.
52. Kirkpatrick S, Gelatt CD, Vecchi MP: Optimization by simulated annealing. Science 1983, 220:671–680.
53. Rodríguez-Ezpeleta N, Brinkmann H, Roure B, Lartillot N, Lang BF, Philippe H: Detecting and overcoming systematic errors in genome-scale phylogenies. Syst Biol 2007, 56:389–399.
54. Rannala B, Yang Z: Phylogenetic inference using whole genomes. Annu Rev Genomics Hum Genet 2008, 9:217–231.
55. Kumar S, Filipski AJ, Battistuzzi FU, Kosakovsky Pond SL, Tamura K: Statistics and truth in phylogenomics. Mol Biol Evol 2012, 29:457–472.
56. World Health Organization: WHO guidelines on tularaemia: epidemic and pandemic alert and response. Geneva: WHO; 2007:125.
57. Berrada ZL, Telford SR: Diversity of Francisella species in environmental samples from Martha’s Vineyard, Massachusetts. M Microb Ecol 2010, 59:277–283.
58. Goethert HK, Shani I, Telford SR: Genotypic diversity of Francisella tularensis infecting Dermacentor variabilis ticks on Martha’s Vineyard, Massachusetts. J Clin Microbiol 2004, 42:4968–4973.
59. Petersen JM, Schriefer ME, Carter LG, Zhou Y, Sealy T, Bawiec D, Yockey B, Urich S, Zeidner NS, Avashia S, Kool JL, Buck J, Lindley C, Celeda L, Monteneiri JA, Gage KL, Chu MC: Laboratory analysis of tularemia in wild-trapped, commercially traded prairie dogs, Texas, 2002. Emerg Infect Dis 2004, 10:419–425.
60. Nano FE, Zhang N, Cowley SC, Klose KE, Cheung KKM, Roberts MJ, Ludu JS, Letendre GW, Meierovics AI, Stephens G, Elkins KL: A Francisella tularensis pathogenicity island required for intramacrophage growth. J Bact 2004, 186:6430–6436.
61. Birdsell DN, Stewart T, Vogler AJ, Lawaczeck E, Diggs A, Sylvester TL, Buchhagen JL, Auerbach RK, Keim P, Wagner DM: Francisella tularensis subsp. novicida isolated from a human in Arizona. BMC Res Note 2009, 2:223.
62. Rohmer L, Brittnacher M, Svensson K, Buckley D, Haugen E, Zhou Y, Chang J, Levy R, Hayden H, Forsman M, Olson M, Johansson A, Kaul R, Miller SI: Potential source of Francisella tularensis live vaccine strain attenuation determined by genome comparison. Infect Immun 2006, 74:6895–6906. 63. Ottem KF, Nylund A, Karlsbakk E, Friis-Møller A, Krossøy B: Characterization
of Francisella sp., GM2212, the first Francisella isolate from marine fish, Atlantic cod (Gadus morhua). Arch Microbiol 2007, 187:343–350. 64. Ottem KF, Nylund A, Karlsbakk E, Friis-Møller A, Kamaishi T: Elevation of
Francisella philomiragia subsp. noatunensis Mikalsen et al. (2007) to Francisella noatunensis comb. nov. [syn. Francisella piscicida Ottem et al. (2008) syn. nov.] and characterization of Francisella noatunensis subsp. orientalis subsp. nov. J Appl Microbiol 2009, 106:1231–1243.
65. Johansson A, Farlow J, Dukerich M, Chambers E, Byström M, Fox J, Chu M, Forsman M, Sjöstedt A, Keim P: Worldwide genetic relationships among Francisella tularensis isolates determined by multiple-locus variable-number tandem repeat analysis. J Bact 2004, 186:5808–5818. 66. Murphy K, Raj T, Winters RS: White PS: me-PCR: a refined ultrafast
algorithm for identifying sequence-defined genomic elements. Bioinformatics 2004, 20:588–590.
67. Schuler GD: Sequence mapping by electronic PCR. Genome Res 1997, 7:541–550.
68. Slater GSC, Birney E: Automated generation of heuristics for biological sequence comparison. BMC Bioinf 2005, 6:31.
69. Edgar RC: MUSCLE: multiple sequence alignment with high accuracy and high throughput. Nucleic Acids Res 2004, 32:1792–1797.
70. Walters WA, Caporaso JG, Lauber CL, Berg-Lyons D, Fierer N, Knight R: PrimerProspector: de novo design and taxonomic analysis of barcoded polymerase chain reaction primers. Bioinformatics 2011, 27:1159–1161. 71. Maechler M, Rousseeuw P, Struyf A, Hubert M, Hornik K: cluster: cluster
analysis basics and extensions.; 2012.
72. Wickham H: ggplot2: Eegant Graphics for Data Analysis (Use R!). New York: Springer; 2009.
73. R Development Core Team: R: a language and environment for statistical computing.; 2011.
74. Saitou N, Nei M: The neighbor-joining method: a new method for reconstructing phylogenetic trees. Mol Biol Evol 1987, 4:406–425. 75. Felsenstein J: Evolutionary trees from DNA sequences: a maximum
likelihood approach. J Mol Evol 1981, 17:368–376.
76. Guindon S, Gascuel O: A simple, fast, and accurate algorithm to estimate large phylogenies by maximum likelihood. Syst Biol 2003, 52:696–704. 77. Guindon S, Dufayard J-F, Lefort V, Anisimova M, Hordijk W, Gascuel O: New
algorithms and methods to estimate maximum-likelihood phylogenies: assessing the performance of PhyML 3.0. Syst Biol 2010, 59:307–321. 78. Felsenstein J: PHYLIP (Phylogeny Inference Package) version 3.5c. Distributed by
the author. Seattle: Department of Genetics, University of Washington; 1993. 79. Felsenstein J, Churchill GA: A Hidden Markov Model approach to variation
among sites in rate of evolution. Mol Biol Evol 1996, 13:93–104. 80. Posada D: jModelTest: phylogenetic model averaging. Mol Biol Evol 2008,
25:1253–1256.
81. Burnham K, Anderson D: Model selection and multimodel inference: a practical information-theoretic approach. 2nd edition. New York: Springer; 2003. 82. Schwarz G: Estimating the dimension of a model. Ann Stat 1978,
6:461–464.
83. Darling AE, Mau B, Perna NT: ProgressiveMauve: multiple genome alignment with gene gain, loss and rearrangement. PLoS One 2010, 5:e11147. 84. Paradis E, Claude J, Strimmer K: APE: Analyses of phylogenetics and
evolution in R language. Bioinformatics 2004, 20:289–290.
85. Shimodaira H, Hasegawa M: Multiple comparisons of log-likelihoods with applications to phylogenetic inference. Mol Biol Evol 1999, 16:1114–1116. 86. Shimodaira H, Hasegawa M: CONSEL: for assessing the confidence of
phylogenetic tree selection. Bioinformatics 2001, 17:1246–1247. doi:10.1186/1471-2180-12-220
Cite this article as: Ahlinder et al.: Increased knowledge of Francisella genus diversity highlights the benefits of
optimised DNA-based assays. BMC Microbiology 2012 12:220.
Submit your next manuscript to BioMed Central and take full advantage of:
• Convenient online submission
• Thorough peer review
• No space constraints or color figure charges
• Immediate publication on acceptance
• Inclusion in PubMed, CAS, Scopus and Google Scholar
• Research which is freely available for redistribution
Submit your manuscript at www.biomedcentral.com/submit