Success at the box
office in the age of
streaming services
THESIS WITHIN: Economics NUMBER OF CREDITS: 30
PROGRAMME OF STUDY: Civilekonom AUTHOR: Jesper Johansson
JÖNKÖPING August 2020
An examination of how streaming
services have impacted the
dynamics of successful movies in
the cinema
Master Thesis
Economics
Title: The box office before and after streaming services
Authors: Jesper Johansson
Tutor: Agostino Manduchi Date: 2020-08-24
Key terms: films, box office, streaming services, the long tail, uncertainty
Abstract
Netflix and other streaming services have grown immensely since they started offering online streaming. In this paper I present a correlation matrix using ticket sales at the domestic box office and the number of Netflix subscribers. They are shown to be negatively correlated with one another, supporting many previous researchers’ thoughts on the topic. I also show using two OLS regressions with data from movies released in 2006-2007 and 2017-2018 that being a part of a franchise has a stronger correlation with increased revenue in the latter model compared to the previous one. In the models one can also see that the general quality of a movie, as measured by IMDb rating, is associated with a higher increase in revenue in the latter model. I argue that this is due to consumers being inclined to watch what they perceive to be high-quality movies in the theaters in the latter model as they can conveniently watch movies of a poorer quality on their streaming service, an option that was not available to the same extent previously. I also argue that consumers are more willing to commit to going to the cinema for a franchise movie, especially in the Marvel cinematic universe, as they are often effects driven movies which are better experienced on a large screen. The budget variable is significant in both models, but the coefficient is much smaller in the second model. I argue that this is due to the fact that a higher budget is required for movies released in 2017-2018 to maintain the same level of revenue as in 2006 and 2007 due to the competition that have come from streaming services. However, I conclude that more research is necessary before drawing definite conclusions as the market for cinema is highly uncertain and difficult to estimate accurately.
Contents
1.
Introduction ... 3
1.1 Purpose ... 4
1.2 Delimitations ... 5
2.
Theoretical framework and literature review ... 5
2.1 Determining financial success ... 5
2.2 An uncertain market ... 8
2.3 The long tail ... 10
2.4 Streaming services ... 12
3.
Method/Methodology ... 16
3.1 Time series model ... 17
3.2 Cross sectional models ... 17
3.3 Heteroscedasticity ... 19
3.4 Expected results ... 19
3.4.1 Time series model ... 19
3.4.2 Cross sectional models ... 20
4.
Empirical results ... 21
4.1 Time series model ... 21
4.2 Cross sectional models ... 23
4.2.1 2006-2007 ... 24 4.2.2 2017–2018 ... 26
5.
Discussion ... 27
5.1 Data limitations ... 306.
Conclusion ... 30
7.
Reference list ... 33
8.
Appendix ... 36
1. Introduction
The overall performance of a movie at the box office is determined by a myriad of different factors. They can be a major actor’s star power, genre, age restrictions, critical consensus, release date and so on. There has been some research in this area previously with some empirical studies being released, mainly showing the expected financial impact that each individual factor has on the overall success of a movie, box office wise. The topic of economics within the film industry is becoming increasingly important as the industry grows ever bigger and as some movies make an exorbitant amount of money. This combined with the new competitor of streaming services in the 2010s means the market is changing and firms must change with it. As of the 28th of October 2019, the streaming services which holds the most subscriptions worldwide is Netflix, with 158 million subscribers and Amazon Prime Video coming in second with around 97 million subscribers (Moskowitz, 2019). With Netflix being significantly larger than its top competitor it will often be used as an indicator of the streaming industry as a whole throughout this paper. Netflix launched its online streaming service for US customers in 2007 (Helft, 2007) and accumulated 7,48 million subscribers to the service by the end of the year. By the end of 2015 Netflix had expanded to several other countries and amassed almost 75 million subscribers in total (Dunn, 2017). Thusly, millions upon millions of people in the world has turned to streaming sites since Netflix launched its online service. Outside of Netflix and streaming sites the American movie industry has grown a lot as a whole in the last few decades and the number of total releases grew from 439 in the year 2000 to 993 in 2018, an increase by 136% (Box office mojo, 2020).
The market for film is one that has almost completely differentiated products. Indeed, there are more genres than can be counted, and even more subgenres, actors with separate styles, directors with unique approaches, ideas that evolve and become something astonishing that has not been seen ever before. The list can go on and on, what it means is that every film brings something new to a market that has existed for over a century. As we have moved into the internet age the market for films has changed with it. As the total number of releases in theaters have increased, so has the subscribers of streaming services. Streaming services utilize a concept called the long tail which was introduced by Anderson (2006). Anderson argues that in the future of entertainment companies must look to take advantage of not just the big hits but to nurture the smaller ones as well. He
argues further that the future of entertainment is to sell less of more to fully utilize the market. This is possible for streaming services to a much larger extent than it is for movies released in the theatre as in theory, the streaming services have, what Anderson calls it, an unlimited shelf space. This means that they could potentially hold every movie in the world within their library without it taking up any extra space.
As previously stated, the market has expanded rapidly in the last decades, showing a steady upwards trend in number of releases and total revenue. This trend is in line with the ideas of The Long Tail (Anderson, 2006), which argues that the future of business is to sell less of more. Anderson argues that to thrive in the future, companies must look to satisfy all corners of the market and stop relying on major “hits”. This in order to take full advantage of the possible revenue and profit that may come from products that is not a part of the highest earners. While the market is still not without major hits, indeed some behemoths like Avengers: Endgame (2019), Black Panther (2018) and Star Wars: The Force Awakens (2015) will stand out from the crowd, “the long tail” stretches out as an astounding amount of films earn at least 10000 US dollars during their run in theaters. Furthermore, of the top 100 films at the box office of all time, all but eleven came after the year 2000. Thus, the years coming after this are successful ones and are therefore perfect for analyzing what the keys to success are within the film industry. It is a field stacked with previous research, thus providing a strong framework of theory to build upon in this paper. All data in this paper is taken from Box office mojo unless otherwise stated. 1.1 Purpose
This paper will aim to contribute to the preexisting literature by examining if streaming services have had a significant impact on the market for movies released in the cinema. It also aims to show how the effect has changed the dynamics of the market one decade apart, a decade in which streaming services have grown immensely. With evidence gathered from movies released in 2006 and 2007 compared with movies released in 2017 and 2018 I aim to shed light on how the market works today which can be used to gain a deeper understanding of what qualities attract consumers and can lead to higher profits. I do not believe that there are many studies which examines the dynamics of the cinema market before and after streaming services and this paper can in that way contribute to the literature on the topic of cinema and streaming services.
The main research question in this paper is as follows:
Have streaming services made a significant impact on the market for movies released in theaters, and if so, have the dynamics of what constitutes a successful movie changed as well?
1.2 Delimitations
Although many different movie centers exist around the world, such as Bollywood, Hallyuwood, Chinawood etc. The American movie industry, also known as Hollywood, will be the main focus in this paper as it is the most previously investigated and presumably the most well-known movie center in the world. This is done due to there being a lot of readily available data on American films that are released. Adding to this, another delimitation to this study will be that only domestic (from the United States, Canada, and Puerto Rico) revenue will be considered in this paper due to there being more detailed data available from the main sources for this study, namely Boxofficemojo and The Numbers, for this market compared to international markets. The total gross in the domestic market was just over 11 billion dollars in 2019 and by solely focusing on the domestic market the rest of the world will be ignored. Thus, any analysis from this paper will only be applicable to the market in the United States, Canada, and Puerto Rico. Due to lack of data availability and lack of ability to source data in an efficient I have not used all movies released for a given year but have instead limited myself to a sample provided by the Numbers. This may affect the models in a negative way as not all movies released are accounted for.
2. Theoretical framework and literature review
2.1 Determining financial success
Belleflamme & Paolini (2015) show that big budget movies, and high-revenue movies, tend to be released during so called demand peaks, which are the holiday season, early May and throughout summer. Cartier & Liarte (2012) also show that movie distribution studios exploit peaks in demand that occur throughout the year. However, they also note that an agglomeration of releases during these periods may lead to studios overestimating
the true demand for each movie released during the peak demand. They find that certain periods are overexploited, and some are underutilized. It is also noted that the release date serves as a good predictor for the overall performance of the film. Jeesha et al (2018) looked specifically at Bollywood and found that holiday releases could serve as a positive indicator for a movie’s box office performance. However, they noted that this only applied to big budget movies that had a big enough draw. For low-budget movies, they advised to seek out other release dates when the competition from high-budget ones was not as large. Furthermore, Jeesha et al (2018) notes that having a big director attached and being in a widely appreciated genre like rom-com (romantic comedies) or drama are also significant for success at the box office.
Albert (1998) argues that while a star can contribute to a movie’s financial success it is far from the only thing needed to make a successful movie. However, Albert also shows that bringing in an actor, actress or director with strong star power for a project may provide a revenue floor for a film which it will then not fall under, thus a star provides some security in revenue terms. While Albert does not make a difference between actor and actress when it comes to star power, Treme & Craig (2013) show that having young male actors that are frequently mentioned in tabloids and papers involved in a film has a significant positive impact on gross earnings from a movie and that actresses with the same qualities negatively impact earnings. Furthermore, the authors find that casting a lead actor over the age of 42, which is still frequently mentioned in tabloids, will decrease revenues for the movie by 10 million dollars.
Besides star power, Chang & Ki (2005) found that, among other things, the drama genre and release dates during the summer were significantly positively correlated with a higher box office performance. On the other hand, Terry, Butler & De’Armond (2011) find several predictors of box office success that was not attributed to release dates. For example, they found that if the general consensus among movie critics increased by 10%, the movie earned an extra 7 million dollars at the box office. Additionally, they showed that an academy award nomination increased revenue by 6 million dollars. In contrast to this, King (2007) found that for movies released in 2003 (the basis for their study) there was no apparent correlation between critical ratings and money earned at the box office. The authors attribute this in part due to critics gaining access to more films which in general may not receive a wide release for the public to see. However, for wide releases
(movies opening on 1000 screens or more) there was no difference between audience and critical taste, and they found a significant positive correlation between critical consensus and box office earnings. The role of the critics is further discussed by Basuroy, Chatterjee & Ravid (2003) who argue that both positive and negative critical reviews are important for the first eight weeks of a movies run in theaters. However, they also claim that the presence of a star in the production may moderate the impact of the critic and not make it as strong. Furthermore, the authors show that negative reviews are more powerful in affecting the gross revenue of a movie.
In an empirical study conducted by Prag & Casavant (1994) they find a significant positive correlation between sequels, star power and winning an academy award with financial success. However, they found no positive correlation between the actual quality of a film, measured in awards and critical consensus, and the above-mentioned variables. On the topic of sequels, or more specifically franchises, Beaty (2016) discusses how movies in the Marvel Cinematic Universe have had an overwhelming financial and economic effect in Hollywood and can utilize its brand to build expectations and increasing the revenue for each movie released with a connection to that particular brand. Prag & Casavant additionally found no indications that films rated PG-13 or R performed any better or worse at the box office. The ratings for American films are set by the MPAA (Motion Picture Association of America) and are divided into 5 distinct categories. They are G (general audiences, everybody are allowed to watch it), PG (parental guidance suggested for content that may be unsuitable for small children), PG-13 (strong parental guidance suggested, the movie is not suitable for children under the age of 13), R (restricted for older teenagers and adults, children under the age of 17 are not allowed to watch the film without an accompanying adult) and NC-17 (nobody under the age of 17 is allowed, strictly for adults). The ratings determined by a group of parents within the MPAA called CARA (The Classification & Rating Administration) that watch each that is to be rated and determine in which category it belongs (Motion Picture Association of America, 2010). In contrast to what Prag and Casavant found in their study De Vany & Walls (2002) found that in strict financial terms it is not advisable to release R-rated movies as PG-rated movies make, on average, triple what an R-rated movie makes on the box office, and G-rated movies make even more. A studio’s decision to still release rated movies is instead due to the prestige that may arise from making a high-quality
R-rated film for actors and studios alike, which may translate into higher box office numbers for future films. Thus, De Vany and Walls argue that releasing a film with a rating below R provides a floor of expected revenue that ensures the film will make at least a certain amount of money at the box office. Thus, it may be beneficial, or at least safer, for studios to release films that are rated below R. A way in which studios use this to their advantage while still producing a violent movie is to incorporate certain techniques in filming that allows them to obtain a PG-13 rating. This may be to not show blood in scenes or to linger on violent actions that occurs (Barranco, Rader & Smith, 2017). Barranco et al also adds that violence in movies in of itself may be a contributor to increased ticket sales but makes no actual claim that this is the case due to the risk of multicollinearity with other variables.
2.2 An uncertain market
”Nobody knows anything”. A quote by William Goldman, a prominent screenwriter in Hollywood, which epitomizes the Hollywood industry (Debruge, 2018). The noticeably high-risk industry is also explained by producer Robert Evans who said: “A film is like no other product. It only goes around once. It is like a parachute jump. If it doesn’t open, you’re dead.” (Mingant, Tirtaine & Augros, 2015).
The always present uncertainty in the market may rationally be a natural deterrent for investors and a sector in which profits are scarce and may be hard to come by. Due to the risk of not producing a profitable movie, the financing, and in that way also the risk, is oftentimes shared by the major studios in the American film industry (who are responsible for the majority of films produced in Hollywood under any given year) and outside investors. Actions taken in order to mitigate the risks were taken by some studios by the late 1990s when many studios significantly reduced the total amount of money spent on producing movies, as well as how big a share of an investment they made for each produced movie, and relied more on co-financing with other distributors and outside investors (Phillips, 2004). To take less of a risk for each individual movie released was essential for modern studios is supported by Pokorny & Sedgwick (2010) who claims that returns from an individual film are essentially unpredictable. However, Pokorny & Sedgwick further argues that this does not mean investing in movies is an irrational decision but that a diversified portfolio is absolutely essential in order to be profitable. Indeed, Vogel (2011) claim that for every ten major theatrical films that are produced, on
average, six or seven of them can be categorized as downright unprofitable and one of them may break even. In fact, De Vany and Walls (1999) show that the movie industry follows a Lévy stable distribution. In this type of distribution there is a strong upper tail and a possible infinite variance, which the authors show is the case for the movie industry. Furthermore, De Vany and Walls find that the average revenue at the box office is almost completely dominated and skewed by the heavy upper tail provided by big blockbuster movies, which are very rare. The authors claim that there is no way of predicting success of a movie and that once it is released, the quality of the film determines its fate.
However, a way in which to mitigate the risk of a movie not being profitable is by getting actors or actresses with strong star power to agree to appear in the movie. Liu, Liu & Mazumdar (2013) show that having a star attached to a project is very important to get a movie greenlit for production and distribution. Liu et al further show that stars require higher compensation and thus raising the total production budget of the movie which means a higher total revenue is needed to be profitable. Furthermore, the authors argue that stars with previous bankability within the same genre as the new film is good for promoting the film before release. A different way of mitigating risk is to build upon previous movies by doing remakes (Bohnenkamp, Knapp, Hennig-Thurau & Schauerte, 2014). The authors show that remaking a movie (producing a very similar movie to one that made years before) has a significant effect on lowering the risk of not being profitable but does not necessarily mean that they are more financially successful compared to other movies.
While the market is in general uncertain as to what constitutes a successful film, Chaturvedi (2009) shows that there is a slight positive correlation between economic performance in a country and the overall spending on cinema. However, the authors argue that this correlation is insignificant and may in fact be disregarded. Von Rimscha (2013) argue that while the state of the economy cannot be considered an accurate predictor of the market for cinema, it is considered to be a low-cost leisure activity, meaning that as income go up, cinema attendance go down.
On the other hand, Hurd & Rohwedder (2013) argue that unemployed people tend to limit their spending on entertainment once unemployed, showing an 11% decrease in spending on entertainment after losing their job. Scanlan, Bundy & Matthews (2011) similarly
argue that young, unemployed adults spend less time engaging in entertainment activities such as going to the cinema, sporting events and so on.
2.3 The long tail
The long tail was introduced by Chris Anderson (2006) where he described the evolution of the entertainment industry in the internet age and how it had developed into something which was fundamentally different from how it looked in the pre-internet era. In this day companies no longer need to rely solely on the hits but increasingly more on the peripheral products that are released as they are taken up an increasing amount of total revenue. An issue that Anderson himself brings up with the concept of the long tail in markets such as the theatrical film industry is that it may not always be able to incorporate all products (films) that are released and that not all films will be able to generate revenue, due to the lack of carrying capacity in the industry. Anderson shows a steep decline in revenue at around the 100th highest grossing movie in 2005. However, De Vany and Walls (1996) show that, in theory, a movie that has a long enough run in theaters will acquire its own life and stretch the tail of the industry far to the right. This is usually not the case though due to films not staying in theaters for a sufficient amount of time. Additionally, they show that weekly revenues are autocorrelated with one another and that movies which are experiencing increasing revenues are expected to continue this growth going forward, thus ensuring that films increasing in revenue will continue doing so, in theory, in perpetuity. Although, according to De Vany (2004), whether or not a film will be a success or a flop is determined by around the fourth week after its premiere, by this point films either continue on being bankable or face a rapid decline in revenue. This also showing that a fantastic opening weekend is not a guarantee that the movie will be a total financial success.
Furthermore, Walls & De Vany (2004) discuss the importance and success of the blockbuster within the industry, describing the blockbuster strategy as using heavy advertising, star power from leading actors or actresses and opening on a large number of screens. It relies on early movie-goers being “leaders” and herding the masses to the screens from the opening weekend. Furthermore, Walls and De Vany further argue that that while true that blockbusters generally fare better during their opening weekends, weekly revenue may fall rather quickly after this and leaves room in theaters for other
movies which gain popularity through word of mouth and perceived quality of the film itself.
However, the increase of overall products (i.e. films) in a market is not always what consumers prefer, or even want. Iyengar & Lepper (2000) showed that consumers, when given the option to choose between a small selection of something and a big one they mainly gravitated towards the small variety. This indicating that consumers felt overwhelmed by the sheer number or choices and avoided this by choosing from the smaller variety. Kamar, Smith & Telang (2014) also show that consumers are skewed towards smaller selections in regards to movies during their theatrical release, reporting that only 10% of movies make up 48% of theatrical and DVD sales before the films started showing on broadcast channels after which the top 10% only account for 35% of sales. A significant reduction in concentration of sales at the top 10% when other movies are given a platform to grow on where consumers do not need to make an active choice to pay and watch a movie. Thusly, Kamar et al argues that a long tail effect within the movie industry can be observed but only after a movie has a sufficiently large distribution via, for example, broadcast channels on tv. This then gives a platform for smaller movies which previously has not enjoyed the spotlight to shine and grow. Goel, Broder, Gabrilovich and Pang (2010) show that people that are subscribed to streaming services such as Netflix and Amazon.com are drawn to the hit but also to the odd obscure choice. The authors find overwhelming evidence that consumers in general are somewhat eccentric and are often drawn to films that are beyond the mainstream, albeit not to the same extent as they wish to watch the big mainstream films.
The appeal of the hit, and the long tail, is also present in other forms of consumption of media. Ordanini & Nunes (2016) examined the development in the music industry between 1974 and 2013. The authors found evidence of both a “winner takes all” industry and an industry with a clear long tail. Ordanini & Nunes showed that while there is clear evidence of the long tail on the charts for songs, there was evidence of the opposite for the artists. Similarly, Peltier, Benhamou and Touré (2016) argue that smaller distributors in the French publishing industry have a lot to gain from the long tail phenomenon in that over time they take over larger and larger chunks of the total revenue in the market. The presence of the hit, or superstar effect, is still palpable but as in the film industry smaller
productions generate revenue over time and take up an increasingly large share of the online market.
2.4 Streaming services
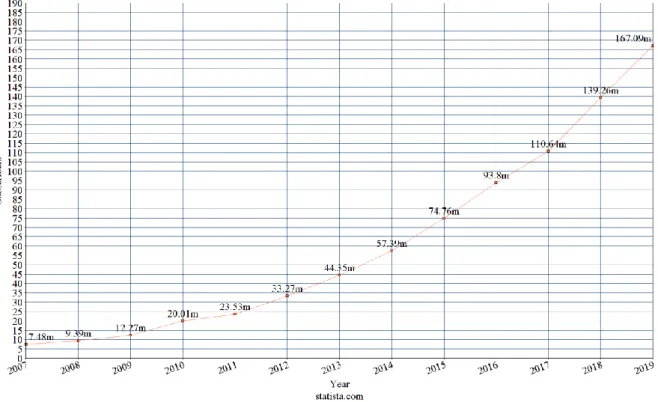
In theory, streaming services, such as Netflix and Amazon Prime, have an endless shelf space. Embracing the long tail that this gives is in part what had made them successful, stacking their service with movies that not many consumers may seek out individually but when put together make up a rather large percentage of what the audience wants to see. Streaming services such as Netflix and Amazon Prime have in the 2010s developed into companies which make multibillion-dollar investments in the industry of home entertainment (Hadida, Lampel, Walls, Joshi, 2020). The development in subscribers for Netflix can be seen in figure 1 below. It shows a rapid increase every year between 2007 and 2019 when the number of subscribers rose by around 160 million worldwide. This has presented an almost unprecedented threat to the traditional strategy of making money of a movie at the box office and on home video.
Figure 1
The development in Netflix subscriber has evidently gone in a steady upward direction. This development can be compared to the development of the total number of tickets sold in the domestic market in the same time period. See figure 2 below. Although not as clear as the upwards curve presented in figure 1 there is a steady downwards trend in the number of tickets sold at the domestic box office between the years 2007 and 2018.
Figure 2
Furthermore, Hadida et al (2020) presents two different institutional logics employed by studios and streaming services, namely commitment logic and convenience logic. Commitment logic is what has been traditionally the strategy used by the distribution companies within the industry, essentially guiding the entire production towards a theatrical release and trying to attract as big a crowd as possible. Meanwhile, the convenience logic employed by streaming services gears towards giving their customers a wide array of films or series to choose between and make their money off subscriptions paid every month (Hadida et al, 2020). Similar to the convenience logic, (McDonald & Smith-Rowsey, 2016), discusses the concept of “on-demand Utopia” which streaming services gives the illusion of being able to choose from an endless supply of different series or movies, specially tailored for our individual tastes. People may sit in their homes with the thought that what they are watching has been tailor made for that individual person, when in reality it has been made for a group of consumers who happen to have somewhat similar interests in films and series. By relying on what the algorithm produced by Netflix suggests for you the consumers are giving up their own independent choice of
what they watch and watch what is recommended by Netflix as well as being subjected to the endless data hoarding from the company regarding their viewing habits (McDonald & Smith-Rowsey, 2016).
Parlow & Wagner (2018) show the impact that Netflix has had in European countries after it was introduced outside of the United States. The authors argue that Netflix can act as a complement to the movie going experience in theaters and found that initially after Netflix launched ticket sales for movies released in theaters increased by up to 14%. However, by 2016 the authors found a reversal of this trend, after Netflix produced more original content and started offering more critically acclaimed TV shows, and predicted that this effect would stay intact over the following years. That streaming services has had a significant effect on the movie industry is further claimed by Pardo (2012) who argues that when streaming services are playing an ever-increasing role in the world of entertainment, the Hollywood industry must adapt and evolve. A reluctant industry at first that gradually became aware of what was happening and started acting accordingly by incorporating more digital solutions in their business model.
That Netflix and cinema may appear as competitors there is one way of consuming movies, and tv-shows, that also must be discussed in the light of streaming services appearing in the entertainment market and that is physical sales of DVDs and Blu-rays. That streaming services have a significant impact on the sales of physical sales is shown by Yu, Chen, Peng & Chau (2018) which studied what happened to physical sales of movies when content owner EPIX switched to Hulu instead of Netflix as their streaming partner. Hulu does not have the same subscriber base as Netflix and the result was increase of almost 35% in EPIX’s monthly DVD sales. This negative relationship is further argued by Chao & Zhao (2013) who argue that the convenience of streaming services is far more favorable for consumers despite the fact that it may lack in quality at times.
A study conducted over the course of three years by Ernst & Young Global Limited Liability Partnership (2020) showed that streaming services, such as Netflix in particular, had little to no impact on visits to the movie theatre. They found that higher levels of streaming had a positive correlation with the number of visits to the movie theatre, a relationship that held true across all age groups and ethnicities included in the study. The
study also showed that nearly half of all people who did not watch a single movie in theaters during the past year, did not stream a single hour of content during the week. This study is a strong indicator for that the real draw to watch films in movie theaters comes from a genuine interest in the art and consumers who enjoys movies will watch as much as they can, both in streaming form and in movie theater form. However, the Ernst & Young study only showed that consumers still watched movies in the theatre and not which movies they watched and if what was now watched in theaters had changed from previous consumer behavior.
3. Method/Methodology
As previously discussed in section 2.2 the market for movies is highly uncertain and can make it difficult to draw strong conclusions regarding the dynamics and development of the market. However, in order to make an analysis of the data available I have developed a model with cross-sectional data which uses movies released in 2006 and 2007 as well as the same model but for movies released in 2017 and 2018. The models used will be identical in execution but will be different in which years the movies released. Thus, one model measures movies released before Netflix rolled out its streaming service and the other model will measure movies released after Netflix has been a major player in the world of entertainment for some years. The source of data in this paper will be obtained from Box office mojo and The Numbers which both tracks released movies and box office receipts. The services provide extensive box office data and reports daily, weekly, monthly, yearly, and seasonal data. The data provided by Box Office Mojo is collected from a wide array of sources such as film studios, distributors, and sales agents ("IMDb | Help", n.d.). The cross-sectional models will be complemented by a time series correlation analysis highlighting how the total number of Netflix subscribers (among other variables) is correlated with the overall number of tickets sold in the domestic box office.
The models will seek to determine what drives success at the box office, measured in net gross, through several independent variables discussed more in depth below. By combining the results from the models with previous research on the cinema market some conclusions may be drawn on how the market has changed and may find some indicators of a shift in the dynamics of what creates a successful product in this market.
3.1 Time series model
To conduct the analysis on whether or not the market for cinema as a whole is correlated with the number of subscribers of streaming services, I have produced a correlation matrix using the total numbers of tickets sold at the domestic box office and the number of Netflix subscribers during the time period 2007-2019 with observations being made in December of each year for a total of 12 observations per variable. All variables included in the analysis showed signs of a trend. As such a detrended version of the variables were included on top of the normal values in the correlation matrix shown in section 5.1. The detrended variables are the first difference of the original variables.
Number of tickets sold: The dependent variable in this model. It is measured in millions
of tickets and data is collected from The Numbers. (The Numbers - Movie Market Summary 1995 to 2020, 2020)
Number of Netflix subscribers: Measured in millions of subscribers by the end of a
given year. I expect this to be negatively correlated with number of tickets sold. Previous studies have had varying results when examining the effect that streaming services have had on cinema, with studies such as the one done by Parlow & Wagner (2018) as well as Pardo (2012) showing a negative relationship. However, the report that Netflix could be seen as a complement to the cinema industry by Ernst & Young (2020) should be kept in mind.
Average ticket price: The average ticket price for a movie in the United States have been
steadily increasing during the period 2007-2018, as such it is suitable to look at when examining variables with a possible correlation with ticket sales. This is expected to be negatively correlated with number of tickets sold. This is measured in dollars per ticket.
Unemployment rate: Unemployment was proven by Hurd & Rohwedder (2013) and
Scanlan, Bundy & Matthews (2011) to be negatively correlated with spending on entertainment and is therefore suitable to include in the model. As Hurd & Rohwedder (2013) and Scanlan, Bundy & Matthews (2011) have previously shown I expect this to be negatively correlated with number of tickets sold. This is measured using a percentage given by the US Bureau of Labor Statistics. (Civilian unemployment rate, 2020).
3.2 Cross sectional models
The cross-sectional models presented in this paper aim to show a differing dynamic between before and after streaming services have emerged as a huge player in the world
of entertainment consumption. I will present two models analyzing movies released before and after Netflix started amassing a huge base of subscribers. By comparing these two models I aim to show if, and how, the dynamics of what constitutes a successful movie released in the cinema have changed. The variables used in both models will be exactly the same and they have been estimated in the same way (with different datasets) to ensure that they can be compared properly. The 2006-2007 model is estimated using a total of 304 movies and the 2017-2018 model is estimated using a total of 193 movies.
Revenue: The dependent variable in the models. Revenue is counted in dollars and is
counted as the gross income for each movie at the box office. Data is from The Numbers. To normalize the variable the natural logarithm has been used for the estimation of the model.
Genre: Some genres may be more correlated with increased revenue and to examine this
the variable genre will take on a different value for certain genres. The allocation of a movie to a specific genre will go by a classification provided by Opus data which allocates one of 14 categories to a film. The genres are comedy, drama, action, adventure thriller/suspense, romantic comedy, horror, documentary, musical, black comedy, western, concert/performance, multiple genres, and genre unknown. In this paper I have chosen to exclude documentaries, concert/performances, multiple genres, and genre unknown as documentaries and concerts are not movies in the traditional sense and to use multiple genres, or genre unknown, will not give an accurate picture on whether or not the genre of the movie contributed to its success ("Movie genre - OpusData", n.d.). Full explanation of the different genres can be found in the appendix. That certain genres can have a significant impact on the success of a movie has been documented by previous studies (Chang & Ki (2005), Jeesha et al (2018)) and is therefore a crucial factor to consider when looking at what is important for success at the box office.
Part of a franchise: This variable will include any movie that is a part of a larger
franchise or universe outside of that specific movie. This includes sequels, prequels, reboots, remakes, and crossover movies. I expect there to be a significant change in this variable mainly due to the rise of the Marvel Cinematic Universe during the 2010s. Of the 23 films released in the franchise, six of them came in 2017 and 2018, all those six made at least 216 million dollars at the domestic box office. That this is an important factor to consider is argued by both Beaty (2016) and Prag & Casavant (1994) with Beaty
strongly considering the Marvel cinematic universe. This is a categorical dummy variable which will take on the value 1 if the movie is a part of a franchise and the value 0 if not.
Budget: This is intuitively an important predictor of revenue, if you spend more money
making a movie then hopefully that contributes to earning more money. That the budget of a movie can be an important influence in determining the success of a movie is supported by Belleflamme & Paolini (2015) and Jeesha et al (2018). This is measured in dollars and to normalize the variable, the natural logarithm has been used for the estimation of the model.
IMDb rating: The rating on IMDb is determined by its own users rating on a movie. It
goes from 1 to 10 and is shown with 1 decimal. For example, a movie can be rated as 6,5 or 7,8 and so on. (IMDb: Ratings, Reviews, and Where to Watch the Best Movies & TV Shows, n.d.)
Other variables such as a categorical dummy for a movie being rated above or below R and total number of theaters that the movie opened on were considered for inclusion but they proved insignificant and did not improve the goodness of fit of either model and was thusly cut. Due to a problem with heteroscedasticity in both the before and after model they were estimated using HAC consistent covariances (Newey-West) to ensure that he estimators in the model are consistent even in the presence of heteroscedasticity.
3.3 Heteroscedasticity
As the market is highly uncertain and due to large variations in the datasets there is risk for heteroscedasticity in the regression models. Gujarati (2009) states that an OLS regression that is applied with unequal variances in the error terms leads to inefficient estimators. Thus, I tested the models for heteroscedasticity using White’s test in Eviews. Unfortunately, the two cross-sectional models suffer from heteroscedasticity. To remedy the problem, the OLS regressions are estimated with HAC consistent covariances which keeps variables efficient despite the presence of heteroscedasticity in the model.
3.4 Expected results
3.4.1 Time series model
I expect Netflix to have negative relation to total ticket sales indicating that as Netflix grows the cinema industry suffer. This is argued by both Parlow & Wagner (2018) and
Pardo (2012). I believe that a similar relationship will be seen between the average ticket price and tickets sales, that as prices go up attendance will go down, as per normal economic theory. As for unemployment rate, I expect it to be negatively correlated with ticket sales, as argued by Hurd & Rohwedder (2013).
3.4.2 Cross sectional models
I expect that being a part of a franchise to be positively correlated with box office gross in both models but to a higher degree in the latter version, mainly due to what Beaty (2016) argues regarding the major financial success of the Marvel cinematic universe which blossomed during the 2010s. The Marvel cinematic universe is right now the largest franchise in history, bringing in over 3 billion dollars more than the franchise with the second highest revenue across all its movies. (Franchises (US & Canada) - Box Office Mojo, 2020) I also expect budget to be a significant variable in both models, but that the effect of increasing your budget will have less of an effect on the net gross of the movie. I think that as streaming services have emerged movies must spend more money (i.e a higher budget) to maintain the same level of revenue as in 2006 and 2007. This stems mainly from the convenience versus commitment logic presented by Hadida et al (2020). Along the same lines I expect certain genres associated with a higher budget to be a bigger contributing factor in the latter model as opposed to the early one where genres easily accessible for everyone, such as comedy or drama, may serve as a stronger contributor to success (Chang & Ki (2005), Jeesha et al (2018)). I expect these to be the type of movies which consumers will tend to watch on their streaming service instead of paying for the ticket at the cinema, they may be negatively correlated with box office gross if at all significant. The variable of IMDb rating is expected to be significantly positively correlated with revenue in both models as the rating comes from consumers of movies who have rated the movie, a higher score indicates a general appreciation for the movie and intuitively it should then translate into higher revenue for the movie. I believe that this variable will be slightly more related to higher revenue in the latter model as a higher rating will also drive consumers to commit to watching the movie in the cinema instead of using the convenience of Netflix at home.
4. Empirical results
4.1 Time series model
The correlation matrix for tickets sold, the number of Netflix subscribers, the average ticket price, and the unemployment rate, as well as the first difference of each variable is presented in table 1.
Variable Tickets sold Detrended tickets sold Netflix subscribers Detrended Netflix subscribers Average ticket price Detrended average ticket price Unemployment rate Detrende unemplo-yment rate Tickets sold 1 0.553 -0.565 -0.436 -0.631 0.161 0.637 0.620 Detrended tickets sold 0.553 1 0.208 0.311 0.153 -0.232 -0.046 0.182 Netflix subscribers -0.565 0.208 1 0.959 0.959 -0.074 -0.907 -0.390 Detrended Netflix subscribers -0.436 0.311 0.959 1 0.927 -0.122 -0.860 -0.454 Average ticket price -0.631 0.153 0.959 0.927 1 -0.124 -0.829 -0.586 Detrended average ticket price 0.161 -0.232 -0.074 -0.122 -0.124 1 0.125 0.465 Unemployment rate 0.637 -0.046 -0.907 -0.860 -0.829 0.125 1 0.396 Detrended unemployment rate 0.620 0.182 -0.390 -0.454 -0.586 0.465 0.396 1 Table 1
Table 1 is showing a correlation matrix of the variables introduced in section 4.1. It is important to note that table 1 shows a correlation matrix and cannot be used to
determine causality between any two variables included. The numbers in the matrix are Pearson correlation coefficients which measures correlation between two variables on a scale of -1 to 1. -1 is a perfect negative correlation and 1 is a perfect positive
correlation. If it is 0, there is no correlation between the variables.
When looking at the normal variables one can see that Netflix subscribers is negatively correlated with ticket sales, showing a correlation of -0,56. The relationship between the change in Netflix subscribers (detrended) and the total number of tickets sold is also a negative one with a correlation coefficient of -0,44. As such there is a relatively strong negative correlation between the number of Netflix subscribers and tickets sold. This is true even though there is evidence of a slight positive correlation between a change in tickets sold and number of Netflix subscribers. However, this is so small (0,21) that it may be disregarded. There is a rather strong negative correlation between ticket sales and the average price at -0,63. There is little to no correlation between the change in price and ticket sales. Both unemployment and the change in unemployment have a rather strong positive correlation with ticket sales at 0,64 and 0,62 respectively. A strong negative correlation is observed between the unemployment rate and the number of Netflix subscribers, with a correlation of -0,91. A similar relationship is seen between the change in Netflix subscribers and unemployment rate, with a correlation coefficient of -0,86. The change in the unemployment rate is also negatively correlated with Netflix subscribers, however, the correlation is not as strong at -0,39. The average ticket price looked to be very strongly correlated with the number of Netflix subscribers with a correlation coefficient of 0,96. However, this is not observed when instead looking at the detrended average ticket price which is shown to have very close to no correlation with Netflix subscribers at all, the coefficient being -0,07.
4.2 Cross sectional models
𝒍𝒏 𝑹𝒆𝒗𝒆𝒏𝒖𝒆 = 𝜷𝟎 + 𝜷𝟏 ∗ 𝒍𝒏 𝑩𝒖𝒅𝒈𝒆𝒕 + 𝜷𝟐 ∗ 𝑭𝒓𝒂𝒏𝒄𝒉𝒊𝒔𝒆 + 𝜷𝟑 ∗ 𝑰𝑴𝑫𝒃 𝒓𝒂𝒕𝒊𝒏𝒈 + 𝜷𝟒 ∗ 𝑨𝒄𝒕𝒊𝒐𝒏 + 𝜷𝟓 ∗ 𝑨𝒅𝒗𝒆𝒏𝒕𝒖𝒓𝒆 + 𝜷𝟔 ∗ 𝑪𝒐𝒎𝒆𝒅𝒚 + 𝜷𝟕 ∗ 𝑫𝒓𝒂𝒎𝒂 + 𝜷𝟖 ∗ 𝑴𝒖𝒔𝒊𝒄𝒂𝒍 + 𝜷𝟗 ∗ 𝑯𝒐𝒓𝒓𝒐𝒓 + 𝜷𝟏𝟎 ∗ 𝑹𝒐𝒎𝒂𝒏𝒕𝒊𝒄 𝒄𝒐𝒎𝒆𝒅𝒚 + 𝜷𝟏𝟏 ∗ 𝑻𝒉𝒓𝒊𝒍𝒍𝒆𝒓𝑺𝒖𝒔𝒑𝒆𝒏𝒔𝒆 4.2.1 2006-2007
The output for movies released in 2006 and 2007 is presented in table 2. There is a total of 304 observations.
Dependent variable: LN Revenue
Coefficient Standard error P-value
Constant -5.786 (3.989) 0.1479 Ln Budget 1.128*** (0.206) 0.0000 Franchise 0.352 (0.288) 0.2213 IMDb rating 0.318*** (0.098) 0.0014 Action 0.794 (0.629) 0.2076 Adventure 1.266** (0.632) 0.0459 Comedy 1.701*** (0.652) 0.0096 Drama 0.696 (0.616) 0.2593 Horror 2.071*** (0.632) 0.0012 Musical 0.624 (0.879) 0.4780 Romantic comedy 1.553** (0.734) 0.0352 Thriller/Suspense 0.972* (0.564) 0.0859
In table 2 above the relationship between the independent variables and revenue is shown. To normalize the genre dummy variables one genre (Western) was dropped and the 8 that remains are interpreted with regards to the dropped variable. The natural logarithm has been taken of both the dependent variable, revenue, as well as the independent variable budget.
As was expected beforehand, the budget variable is significantly correlated with revenue even at the 1% level. The coefficient shows that an increase by 1% in the budget of a movie is associated with 1,13% in revenue. The rating on IMDb is also positively correlated with revenue at the 1% level. An increase by 1 in the IMDB rating is associated with a 37% increase in revenue. However, it is important to note that the rating is determined with one decimal on the site and that is seen as quite a large increase in quality if a movie goes from a, for example, 6 to a 7 or a 7 to an 8. Being a part of a franchise was not significant in this model, even at the 10% level of significance.
Only two genres were significant on the 1% level. They were comedy and horror, both being specific type of genres which try to elicit a certain response in its viewers. A comedy aims to make the audience laugh and have fun while a horror movie tries to scare, or disgust, them. Adventure and romantic comedy were both significant at the 5%, two genres which may not be as singular as comedy or horror and perhaps is not as strong, statistically speaking, in estimating revenue. While romantic comedies certainly are comedies. they encompass a bit of romance in the movie which is not always exhibited in other comedies and as such may put certain consumers of, as well as entice others Adventure often takes the audience on a journey but can in doing so also include elements from several other genres, such as comedy and big action set pieces. Thriller/suspense was significant at the 10% level, a genre that can be similar to others on the list, such as action or horror, but all share the trope that the plot is the what drives the movie forward, not action scenes or big scares. Action, drama, and musicals were not significant even at the 10% level of significance.
All genres are observed to be more strongly associated with higher revenue compared to the western genre. The ones which have the highest coefficients are comedy and horror (incidentally the variables which were significant at the 1% level), they have a coefficient
of 1,70 and 2,07 respectively. Of the significant variables, both romantic comedy and adventure are also observed to have rather high coefficients at 1,55 and 1,27 respectively. Only thriller/suspense was observed to have a coefficient lower than one, with the coefficient being 0,97.
4.2.2 2017–2018
The regression output for movies released in 2017 and 2018 is presented in table 3.
Dependent variable: LN Box office
Coefficient Standard error P-value
Constant 2.683 (2.257) 0.2362 Ln Budget 0.632*** (0.103) 0.0000 Franchise 0.538*** (0.138) 0.0001 IMDb rating 0.354*** (0.071) 0.0000 Action 1.467* (0.882) 0.0980 Adventure 1.650* (0.887) 0.0646 Comedy 1.865** (0.888) 0.0371 Drama 1.355 (0.864) 0.1183 Horror 2.081** (0.834) 0.0135 Musical 2.016** (0.922) 0.0300 Romantic comedy 2.515*** (0.944) 0.0084 Thriller/Suspense 1.184 (0.910) 0.1949
(***=Significant at 1% level, **=Significant at 5* level, *=Significant at 10% level) Table 3
As in the previous model, as well as was expected by previous research, budget was significantly positively correlated with revenue. However, in this model it was only
associated with a 0,63% increase in revenue for every 1% increase in budget. As opposed to the previous model, being a part of a franchise is significant and has a coefficient of 0,54. The IMDb variable is slightly larger in this model and an increase by 1 in the rating is associated with a 42% increase in this model as opposed to 37% in the previous one.
As in the previous model, all variables were observed to be more strongly correlated with higher revenue compared to the western genre. However, only romantic comedy was significant at the 1% level of significance and had a coefficient of 2,52, quite a lot higher in comparison to the previous model. Comedy, horror, and musical were significant at the 5% level of significance and all had higher coefficients in this model. The coefficient for comedy was 1,87, for horror it was 2,08, and for musical 2,02. On the 10% level, action and adventure were significant. They had a coefficient of 1,47 and 1,65 respectively. Both drama and thriller/suspense were insignificant even at the 10% model of significance.
As such, musical went from being an insignificant variable in the 2006-2007 model to being significant at the 5% level. Similarly, action went from being insignificant in the 2006-2007 model to being significant at the 10% level in the 2017-2018 model. Thriller/suspense was significant in the previous model but turned out to be insignificant in the latter one.
5. Discussion
In the correlation matrix presented previously one can see that there is a negative correlation between the number of Netflix subscribers and ticket sales during 2007-2018, this is true for a change in Netflix subscribers as well. This is in line with what some of the previous research have alluded to previously, such as Parlow & Wagner (2018) and Pardo (2012), which have shown that Netflix has a negative impact on ticket sales in cinema. However, it is important to note that the correlation matrix presented in 4.1 solely measures correlation and cannot be regarded as proof of causality among the variables. With that being said, one must consider if the two variables may have a causal relationship and if they do act as competitors to one another. When instead looking at the relationship between unemployment rate it was found to be rather strongly positively correlated with ticket sales. This was somewhat surprising in terms of what previous research has shown but it had been studied by Von Rimscha (2013) Chaturvedi (2009) previously and they
had found that a positive correlation between the two may exist, or a correlation between a country’s economic performance and ticket sales. The results shown here indicate that cinema may indeed be a low-cost leisure activity and one that is undertaken more when people are unemployed and possess less disposable money compared to when they are working. However, the unemployment rate is determined by a multitude of different variables in of itself and it represents far from the entire population, as such it is a large stretch to assume that these results are significant and show a true correlation between unemployment and spending on the cinema. That the ticket price was negatively correlated with ticket sales was highly expected, once price goes up, quantity generally goes down. I believe that this relationship would be significant in just about any model including both the number of tickets sold and ticket price.
The main takeaway from the correlation matrix using these variables is that a negative relationship between ticket sales and Netflix subscribers was observed between 2007 and 2018. While this does not prove that there is a significant causal relationship between the two it does show that there is a negative relationship, at least if you are purely looking at the numbers. That this correlation is shown to be negative, both when measuring the change in the variables and the normal numbers, is grounds to say that the relationship must be examined further perhaps with a different model which takes into account more in depth of what Netflix offers to its subscribers as well as what exactly the cinema offers that Netflix does not.
If, for the sake of discussion, we assume that there is a significant relationship between the number of Netflix subscribers and ticket sales then one can assume that this has impacted the dynamics of what constitutes a successful movie released in the cinema as well. By comparing the two models presented in section 4.2.1 and 4.2.2 we can see somewhat the change that has occurred between before Netflix launched their streaming service and after it had gained more than 100 million subscribers. In both models the variable of IMDb rating was significant at the 1% level of significance. This was expected as the IMDb score is determined by the rating assigned to the movie by its users. As such one may expect that the variable is important for determining the revenue that a movie released in the cinema will bring in. It is correlated with a slightly higher increase in revenue in the latter model compared to the first one. I believe that this is related to the commitment versus convenience logic introduced by Hadida et al (2020). After Netflix
and other streaming services have grown larger and larger, a higher quality movie is more likely to draw people away from the convenience of their own home where they have multiple movies just one click away. If the movie is perceived by others to be of a high quality, then they are more likely to commit to going to the cinema and paying the admission to watch the higher quality movie which they cannot see at home. Similarly, I argue that the same can be said for the franchise variable. Rather surprisingly it was not significant in the 2006-2007 model but, as expected, it was significant at the 1% level in the latter model. With franchise movies, consumers can be more certain of the quality of the movie and are thus more likely to commit to going to the cinema to watch it. I believe that a big part in the change of this model can also be attributed to the rise of the Marvel cinematic universe during this time, as argued by Beaty (2016). Franchise movies, such as the ones released in the Marvel universe, are generally perceived to be of a good enough quality that people will go to the cinema to watch it. A large part of why these movies in particular are so successful may also be attributed to them usually being a big spectacle to watch with, for example, big action set pieces which are better experienced in a theater with a large screen as well as great surround sound that is harder to achieve at home. Since 2008, 23 movies have been released in the franchise with all of them making a minimum of 134 million dollars at the box office. As such this is an incredibly important variable, and with Marvel looking to release several more movies in the coming years, it is a variable that must be considered for future research on the effect of franchises (Franchise: Marvel Cinematic Universe - Box Office Mojo, 2020).
The budget variable was, as expected, significant at the 1% level in both models. However, the coefficient was almost twice as high in the 2006-2007 model compared to the 2017-2018 one. If we assume that the correlation matrix in section 4.1 holds true, then these numbers are expected. This is also related to convenience versus commitment logic which has ben discussed above. If the draw of the convenience of consuming entertainment at home, via streaming services, then one must assume that a higher budget is required to draw consumers to the theaters and to make them commit to watching it in the cinema instead of watching whatever you can watch at home. As such, a larger budget is now required to maintain the same level of revenue as in the previous model. A large budget is oftentimes correlated with blockbuster movies that have large action set pieces, or cool scenes which are better enjoyed on a big screen with a great sound, something
which is much harder to achieve at home. I believe that the variable budget and franchise may act in a similar way in this framework and that a combination of the two may be great for a movie’s success at the box office, in strict financial terms.
When looking at the different genres that were included in the model the top three highest coefficients (comedy, horror and romantic comedy) in the 2006-2007 model remained in the top four in the 2017-2018 model with musical being significant in the latter model but not in the first. That these three, comedy, horror, and romantic comedy, are significant in both models indicate that they are among the most popular ones for consumers. Both comedy and romantic comedy are very easily accessible for many consumers and are oftentimes made for a wide audience. Horror is a specific genre in that it seeks to elicit fear and disgust in its audience to provoke an adrenaline response which viewers may find pleasurable. With this said it is hard to show that streaming services have impacted what genres are popular in the cinema as the top ones are pretty much the same before and after. I believe that to understand what Netflix may have altered for genre movies released in the cinema one must consider the offerings of Netflix. What genres are popular among Netflix consumers? How many movies of certain genres do the provide to its consumers? Those are just two questions which may deepen the understanding of how these two ways of consuming entertainment can affect one another.
5.1 Data limitations
While estimating my model and gathering the data for the analysis I was heavily restricted by the data available to me. Due to unforeseen issues with sourcing data I had to rely on a smaller sample provided by the Numbers. The sample provided to me included 304 movies from the period 2006-2007 and 193 movies in the time period 2017-2018. As such, the discussion and results in this paper may not be as robust as they would have, had all the movies released in the given years been considered. As there were fewer movies used in the 2017-2018 model, it may not be as strong as the earlier one.
6. Conclusion
The purpose of this paper was to examine if Netflix and other streaming services have affected the market for movies released in the cinema and, if so, how have the dynamics of what makes a successful product in that market changed. The results showed a negative
correlation between the number of Netflix subscribers and the number of tickets sold at the domestic box office in the USA, Canada, and Puerto Rico. This was somewhat in line with previous research on the topic and supports the idea that Netflix is a strong competitor to cinema as a mode of consuming entertainment. However, there is no causality proven between the two variables in this paper and the results must therefore be considered to not be that strong. With that being said, that there is a negative correlation between the two variables may indicate that they compete over the same consumers, and to stay relevant they should always consider the competitor when making strategic decisions.
To show how the dynamics of what constitutes a successful movie released in the cinema changed from before to after Netflix launched its streaming service and gained over 100 million subscribers two ordinary least squares regressions with HAC consistent covariances were conducted. These showed that certain genres (comedy, romantic comedy, and horror) were significantly positively correlated with revenue. I argue that this is due to both comedy and romantic comedy are genres that are easily accessible for many people and are thus popular. Horror movies are created to elicit a fear response in its audiences and release adrenaline, which may be pleasurable, and as such it is a popular genre of movies. However, to determine the effects that streaming services have had on which genres are popular for movies released in the cinema I suggest looking deeper into the offerings of streaming services regarding what genres they have.
That being a part of a franchise was significantly positively correlated with revenue in the latter model I attribute in part to the Marvel cinematic universe which rose to prominence in the 2010s. People are more likely to commit to going to the cinema when they can tell in advance around what quality the movie will be and thus leave the convenience of their home and streaming services to watch the movie in the cinema. I believe that the same holds true, to some extent, for the budget of a movie. The budget variable is significant in both models, but the coefficient is much smaller in the second model. I argue that this is due to the fact that a higher budget is required for movies released in 2017-2018 to maintain the same level of revenue as in 2006 and 2007.
I argue that streaming services have played an important role in shaping what constitutes a successful movie released in the cinema and that it is a variable that is crucial to include
when examining the market for cinema. The conclusions drawn in this paper can be used as a foundation to build on and to consider when creating new models. However, it is important to note that further studies need to be conducted in order to draw definite conclusions as well as showing how streaming services and the market for movies released in the cinema interacts with one another. This is as well due to the extreme uncertainty exhibited in this market.
For future research on the topic I suggest looking into what type of movies streaming services offer, what genres, what rating, franchise movies and so on. I believe that this could create a deeper understanding of the differences between the two mediums and their offerings. I would also strongly recommend using a larger dataset than what was available in this paper as it will then give a more robust and better look at the market as a whole.
7. Reference list
Albert, S. (1998). Movie Stars and the Distribution of Financially Successful Films in the Motion Picture Industry. Journal Of Cultural Economics, 22, 249-270.
Anderson, C. (2006). The long tail. New York: Hyperion
Barranco, R., Rader, N., & Smith, A. (2017). Violence at the Box Office. Communication
Research, 44(1), 77-95. doi: 10.1177/0093650215614363
Basuroy, S., Chatterjee, S., & Ravid, S. (2003). How Critical are Critical Reviews? The Box Office Effects of Film Critics, Star Power, and Budgets. Journal Of
Marketing, 67(4), 103-117. doi: 10.1509/jmkg.67.4.103.18692
Beaty, B., 2016. Superhero fan service: Audience strategies in the contemporary interlinked Hollywood blockbuster. The Information Society, 32(5), pp.318-325.
Belleflamme, P., & Paolini, D. (2015). Strategic Promotion and Release Decisions for Cultural Goods. SSRN Electronic Journal, 37. doi: 10.2139/ssrn.2634894
Bls.gov. 2020. Civilian Unemployment Rate. [online] Available at: <https://www.bls.gov/charts/employment-situation/civilian-unemployment-rate.htm> [Accessed 17 July 2020].
Bohnenkamp, B., Knapp, A., Hennig-Thurau, T., & Schauerte, R. (2014). When does it make sense to do it again? An empirical investigation of contingency factors of movie remakes. Journal Of Cultural Economics, 39(1), 15-41. doi: 10.1007/s10824-014-9221-6
Box Office Mojo. n.d. Franchises (US & Canada) - Box Office Mojo. [online] Available at: <https://www.boxofficemojo.com/franchise/?ref_=bo_nb_bns_secondarytab> [Accessed 3 May 2020].
Box Office Mojo. 2020. Franchises (US & Canada) - Box Office Mojo. [online] Available at: <https://www.boxofficemojo.com/franchise/?ref_=bo_lnav_hm_shrt> [Accessed 5 August 2020].
Byeng-Hee Chang & Eyun-Jung Ki (2005) Devising a Practical Model for Predicting Theatrical Movie Success: Focusing on the Experience Good Property, Journal of Media Economics, 18:4, 247-269, DOI: 10.1207/s15327736me1804_2
Chao, C. and Zhao, S., 2013. Emergence of Movie Stream Challenges Traditional DVD Movie Rental—An Empirical Study with a User Focus. International Journal of Business
Administration, 4(3).
Chaturvedi, I., 2009. Impact of Recession on Entertainment Industry with Special Reference to Bollywood. Drishtikon : A Management Journal, 1(1), pp.53-60.
De Vany, A., & Walls, W. (1999). Uncertainty in the Movie Industry: Does Star Power Reduce the Terror of the Box Office?. Journal Of Cultural Economics, 23, 285-318.