INFLUENCE OF ROAD UNEVENNESS ON
ROAD HOLDING AND RIDE COMFORT
av
Brajnandan P Sinha
INFLUENCE OF ROAD UNEVENNESS ON
ROAD HOLDING AND RIDE COMFORT
av
Brajnandan P Sinha
INSTITUTIONEN FÖR MASKINELEMENT
FORDONSTEKNIK
TEKNISKA HÖGSKOLAN/ STOCKHOU
INFLUENCE OF ROAD UNEVENNESS ON
ROAD HOLDING AND RIDE COMFORT
AV
BRAJNANDAN PD, S IN H A
T E K N i L I C
This report was first published as Report N o 1 1972 of the Departm ent o f M a c h in e Elem ent D esign , Royal Institute o f T ech n o lo g y, Stockholm .
Errata sheet for I N F L U E N C E O F R O A D U N E V E N N E S S O N R O A D H O L D I N G A N D R ID E C O M F O R T .
The reader is k in d ly requested to make corrections in the text in acco rd a n ce w ith the errata tab le b e lo w .
Page N o . L in e N o . Instead of: Please read:
3 33 h = A sincpg h = aco s cPq 6 3 Z = ...
Z
=...
s s 6 11 R .m .s = R o a d ... R .m .s = R o o t ... 6 21 <P0= ...( rad) 9 q =...cp(rad) 9 29 rought rough 11 31 works work 15 14 in is 18 13 (ta b le 1) O 1 CN CN 1o
30 22 res trie td r e s t r i c t e d 33 22 q . = ... q . = ...q . 34 2 (E q n .7 .5 .5 ). i + ,/ 2 K 2( Z b- V i i + V 2 K 2 ( 2 b - z ' 0 ) 2 34 3 (E q n .7 .5 .5 ). + 1/2K ,(Z+b9 -Z, ) 4 b + 1/2K .(Z+ b9-Z, ) 2 4 b 34 7 (E q n .7 .5 .6 ) . + l/ 2 C 4(Z + b 9 - Z b ) 2 + l/ 2 C 4(Z + b 9 - Z b ) 2 34 7 (E q n .7 .5 .6 ). + l/ 2 C s( Z s- Z + n 9 )2 + 1/2C ( Z - Z + n 9 )2 s s 35 12Ph(d/n)
= ... hf (dyn) 35 14 P , P , b (d y n ) h b (d yn ) 9 ? 44 33 N i! > S \ N II > 6 r 48 11 help a a ... help of a ...48 14 can be ap plied . . . . ca n possibly be a p p lie
54 3 G ra n fie ld C ra n fie ld 54 28 M its c h k le M itsch k e 55 1 M its c h k le M itsch k e 57 3 G ra n fie ld C ra n fie ld 57 5 G r a n fie ld C ra n fie ld Fig N o . 65 19 Zq= A u) sinoot Zq= - Au) sinuot 66 22 Zq = A i« sinuot Zq= - Au) sinuot 68 26 Front a x le . Front ax le
S ta tic w heel lo a d = 9 7 5 0 (N ). S ta tic a x le lo ad= 96 00(N )
68 26 Rear a x le Rear ax le
1 2 3 7
12
13 13 13 13 16 17 19 19 19 19 25 28 29 29 29 30 30 31 32 35 36 CONTENTS ABSTRACT ACKNOWLEDGEMENT LIST OF SYMBOLSLIST OF FIGURES AND TABLES
INTRODUCTION
ROAD HOLDING AND RIDE COMFORT 6.1 Road holding
6.1.1 Definition of road holding 6.1.2 Road holding criteria
6.1.3 Methods for determination of road holding on a given road
6.1.4 Road factors influencing road holding 6.1.5 Vehicle parameters influencing
road holding 6.2 Ride comfort
6.2.1 Definition of ride comfort 6.2.2 Ride comfort criteria
6.2.3 Methods for determination of ride comfort on a given road
6.2.4 Road factors influencing ride comfort 6.2.5 Vehicle parameters influencing
ride comfort
ANALYSIS OF THE INFLUENCE OF ROAD UNEVENNESS ON ROAD HOLDING AND RIDE COMFORT
7.1 Purpose of the research 7.2 Scope of the research 7.3 Road holding index 7.4 Ride comfort index
7.5 Mathematical models of vehicle 7.6 Road model
Page
7.8 Methods of analysis 36
7.9 Influence of road unevenness on dynamic wheel load, 39
road holding index and impact factor
7.10 Influence of road unevenness on ride comfort 43
7.11 Comparison between theory and some experimental data 46
7.12 Conclusions 48
7.13 References 50
7.14 Figures 58
Road unevennesses affect the safety and comfort of a vehicle. It is desirable, therefore, to maintain a certain evenness standard on a road. However, this evenness standard should be established in terms of safety and comfort. This thesis provides: (a) definitions of the terms "road holding" (safety) and "ride comfort", (b) survey of literature describing different measuring criteria and methods to determine road holding and ride comfort, (c) how road holding and ride comfort are influenced by vehicle and road parameters.
Furthermore, the influences of different wave lengths and amplitudes of the road unevennesses on road holding, ride comfort and impact factor,
(the stress imposed upon the road by a vehicle) as a function of vehicle
speed, are investigated with the help of a mathematical model of two-axle and two-wheels vehicle with driver. The road holding problems are also studied with the help of one-wheel and one-axle vehicle model. Road sur face, in this investigation, is considered to be a continuous sine wave. This investigation, thus, presents a range of significant wave lengths which ought to me measured by road surface measuring devices. At last,
the theories developed in this thesis are compared with some experimental data.
REFERAT
Vägojämnheter påverkar körsäkerhet och komfort. Det är därför önskvärt att upprätthålla en viss jämnhetsstandard på en väg. Denna jämnhetsstandard kan uttryckas medelst mått på körsäkerhet och komfort. Avhandlingen ger defini tioner på begreppen körsäkerhet och komfort, en översikt av i litteraturen
redovisade mått på dessa begrepp och metoder att bestämma dessa samt av hur komfort och körsäkerhet påverkas av väg- och fordonsparametrar.
Vidare har inverkan av vägojämnheters amplitud och våglängd på ett väghåll- ningsmått, ett komfortmått och ett väg- och fordonspåkänningsmått studerats som funktion av hastigheten med hjälp av en matematisk modell av ett två- axligt, tvähjuligt fordon med förare. Väghållningsmättet har även studerats med en matematisk modell av ett enaxligt fordon. Vägbanan har vid dessa studier utgjorts av en kontinuerlig sinusvåg. Denna undersökning ger upp lysning om vilka våglängder som mätapparatur för jämnhetsmätning bör kunna registrera.
2. ACKNOWLEDGEMENT
This thesis work was conducted during the years 1966 to 1970 at The National Swedish Road and Traffic Research Institute (earlier The National Swedish Road Research Institute), where I was employed as research engineer.
This work was carried out under the guidance of Mr Gösta Kullberg, former chief of the Mechanical Department of the institute, who initiated the work
and assisted for its progress. I am indebted to him and would like to extend
my hearty thanks.
I would also like to avail myself of this opportunity to thank Mr Olle Nord
ström for his assistance in forming the frame for this thesis work, which
is only a part of the whole research programme sponsored by The National Swedish Road Administration (Statens Vägverk).
Last but not the least I would like to thank Mr Hans Runqvist for his co operation and valuable advices as to the analog computation of the problem in
question.
I would fail in my duty if I do not thank all the others who were, in some way or other, associated with me in fulfilling this thesis work.
STOCKHOLM, DECEMBER 1972
3. LIST OF SYMBOLS
A = Amplitude (m)
A (a ) = Amplitude spectrum Density ( m ) (PSD)
a = Distance between nip^ and (m)
B = Band with
b = Distance between centre of gravity and rear axle (m)
Cj = Damping constant of tyre (front) (Ns/m)
C2 = Damping constant of tyre (rear) (Ns/m)
Cj = Damping constant of shock absorber (front) (Ns/m)
C^ = Damping constant of shock absorber (rear) (Ns/m)
C, = Damping constant of seat damper located horizontally at the back
of the driver (Ns/m)
Cm = Damping constant of shock absorber (Ns/m)
C = Damping constant of seat damper located horizontally under the heap
of the driver (Ns/m)
Ct = Damping constant of tyre (Ns/m)
c = Constant
d = Vertical distance between center of gravity and nip^ (ra)
Eq, E^, E^, E^, E^ = Areas, as devined in Fig. 1
e = Basis of natural logarithm (2,7183)
F = Force
F. = Input force
in *
Fout = Output force
F(t) = Input force as function of time
f = Frequency (Hz) and also for distance between centre of gravity and
front axle (m)
fp = Constant and equal to 10 Hz
G(s) = Transfer function (TF)
C (s)= Transfer function relating acceleration
acn f
Cp(s)= Transfer function relating force
Cd i(s)= Transfer function relating driving point acceleration impedance
2
g = Acceleration due to gravity = 9,81 (m/s )
i = 1, 2, 3, ...
2 2
Jg= (mp2 a ) Moment of inertia of around nip^ (kg m )
2
Jy= Moment of inertia of vehicle around y axis (kg m )
Kq = Integration constant
= Spring constant of tyre (front) (N/m)
= Spring constant of tyre (rear) (N/m)
= Spring constant of suspension spring (front (N/m)
= Spring constant of suspension spring (rear) (N/m)
K.. = Spring constant of spring seat located horizontally at the back of
the driver (N/m)
= Spring constant of suspension spring (N/m)
Kg = Spring constant of seat spring located horizontally under heap of
the driver (N/m)
Kj. = Spring constant of tyre (N/m)
K* = Comfort value defined by VDI-2057
Kqi = Comfort value defined by Dieckmann
Kj^= Comfort value defined by Jacklin and Lidell
Kj^= Comfort value defined by Janeway
Kr m~ Comfort value defined by Reiher and Meister
Kj,g= Comfort value defined by Sperling and Betzhold
K ^ = Zeller comfort index
k = Constant
1 = Wheel base (m)
m = Mass of the vehicle (kg)
m = Axle mass (kg)
3.
nip-^ Mass of the upper portion of the driver (kg)
Mp2= Mass of the lower portion of the driver (kg)
m ^ = Axle mass (rear) (kg)
mhf= mass (front) (kg)
n = Horizontal distance between center of gravity and (m)
Pg= Effective wheel load (N)
F*dyn= Dynamic wheel load (N)
w Total wheel load (N)
^hb(dyn) = Dynamic wheel load for rear axle (N)
Phf(dyn)= Dynamic wheel load for front axle (N)
Pd = Average dynamic wheel load decreament (1)
V
Absorbed powerV
95 percentil of the sum of dynamic and static wheel loadsP'= Mean value of effective wheel load (N)
Q = Impact factor
Generalized force
Qs
= Statistically defined impact factor«i = Generalized coordinate
^i = First time derivative of generalized coordinate
R = Viscous dissipation function
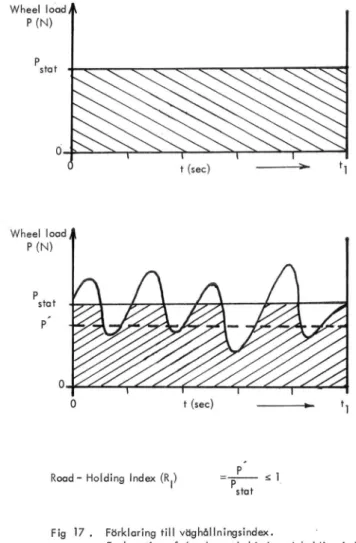
RI = Road holding index
T = Integration time T = E 2 2 Kinetic energy (kg m /s ) t = Time (sec) V = Potential energy (kg m /s )2 2 v = Driving speed (km/h) or (m/s)
Z = Vertical displacement of vehicle body (m)
i = First time derivative of Z (m/s)
«0
Z = Second time derivative of Z (m/s)
z
=a Vertical displacement of axle (m)
• Z =
a First time derivative of Za
##
Z = Second time derivative of Z
a a
Zb = Vertical displacement of rear axle (m)
*b = First time derivative of Z^ (m/s)
* Z’b =
7 Second time derivative of Z^ (m/s )
Zf = Vertical displacement of front axle (m)
= First time derivative of Z£ (m/s)
= Second time derivative of Z^ (m/s )
Z 0 " Excitation function
zo = First time derivative of Zq
o
Zs = Vertical displacement of seat (m)
Zs = First time derivative of Zg (m/s)
2
Z = Second time derivative of Z (m/s )
s s v J
(Zg)= Threshold amplitude at 1 Hz = 0.1 cmZ/s^
(Zf)= Velocity of vibration (cm/s)
(Zf)g= Velocity of vibration for threshold = 0,04 cm/s
2
(Zf )^ = Input acceleration
2
(Zf )Qut=Output acceeleration 2
(Zf ) = R.m.s value of random acceleration P.S.D.= Power Spectral Density
R.m.s.= Road mean square value
ms = Mean square value
acn = Acceleration
a => Constant
e = Pitch displacement of vehicle body (radian)
é = First time derivative of (rad/sec)
0 = Second time derivative of (rad/sec )
<p = Pitch displacement of drivers upper portion (radian)
<j> = First time derivative of (rad/sec)
ip = Second time derivative of (rad/sec )
<Pq= Initial value of (rad)
a) = Angular frequency (rad/sec)
u = Coefficient of friction
A = Wave lenght (m)
4. Figure 1 2 3 4 5 6 7
8
9 10 11 12 13 14 15 16LIST OF FIGURES AND TABLES
Page
Explanation of the theory behind average dynamic wheel load 58
decrement
Mathematical model of one axle vehicle (Two-degrees-of-freedom) 58
Block diagram of data flow line for determination of road holding 58
index using an analog computer
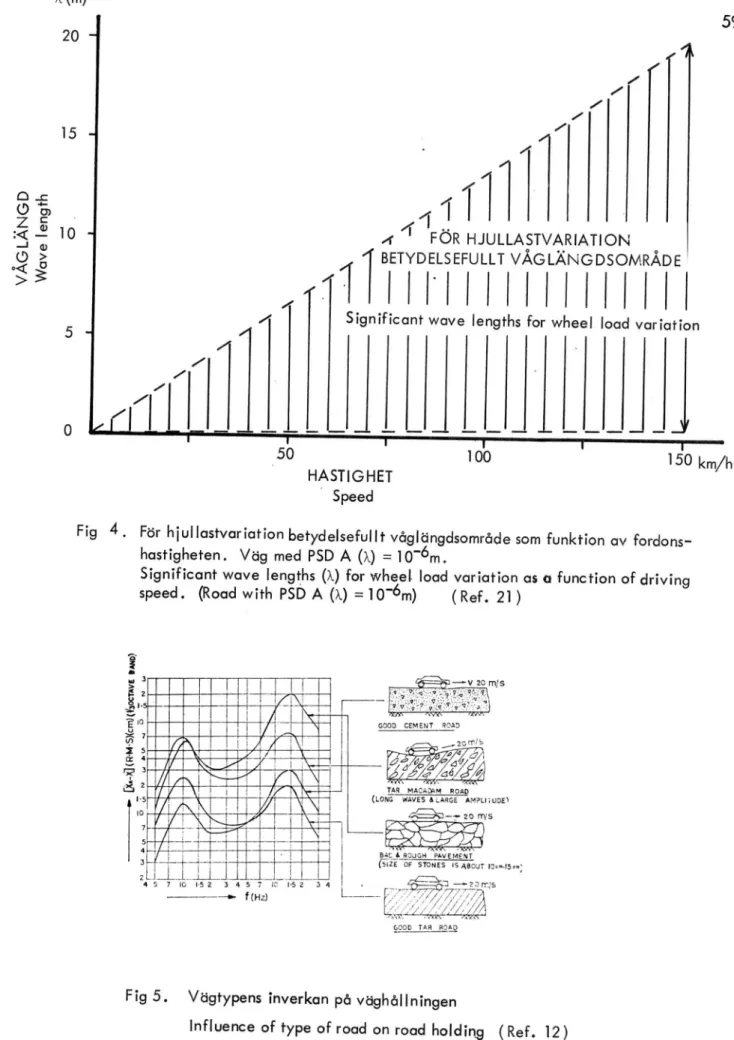
Significant wave lengths (a) for wheel load variation as a 59
function of driving speed. (Road with PSD A (a) = 10~^ m)
Influence of type of road on road holding 59
Comparison of Reiher and Meister's,Jacklin and Lidell's, and 60
Dieckmann's comfort zones based on data from their individual tests
Comparison of Goldman's and Janeway's surveys of state of the 60
art with Reiher and Meister's zones of comfort
Comparison of Dieckmann's,Zeller's and Sperling's zones of 60
comfort
Comparison of VDI's-2057(new and old), Reiher and Meister's 60
and Sperling and Betzhold's zones of comfort
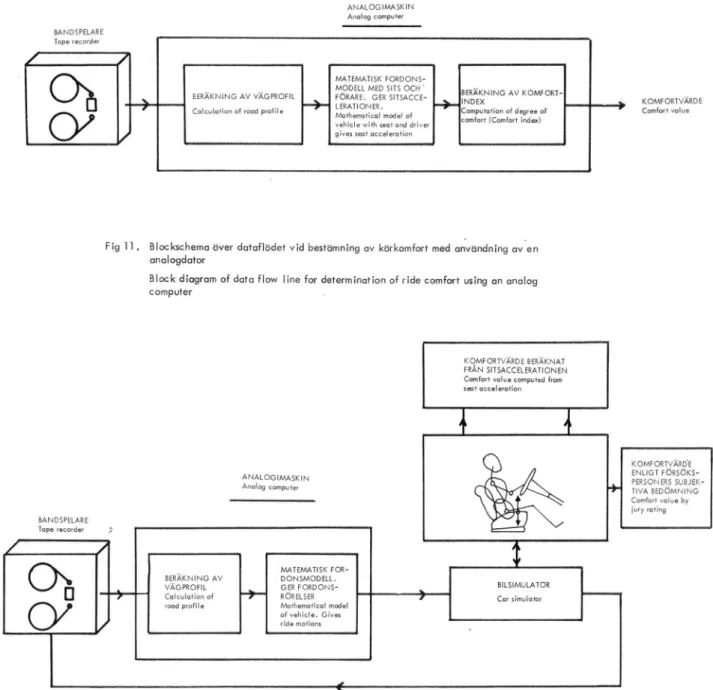
Block diagram of data flow line for determination of ride com- 61
fort in the vehicle
Block diagram of data flow line for determination of ride com- 61
fort using an analog computer
Block diagram of data flow line for determination of ride com- 61
fort using a car simulator
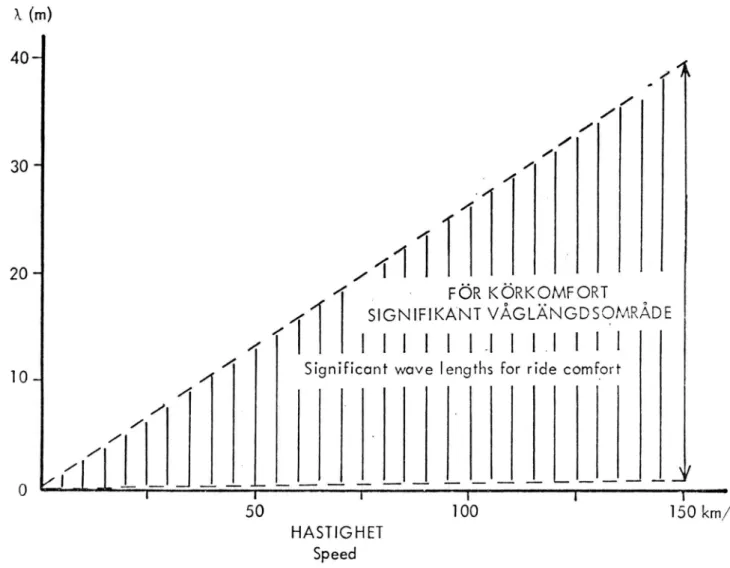
Significant wave lenghts (a) for ride comfort as a function 62
of vehicle speed. (Road with PSD A (a) = 10~^ m)
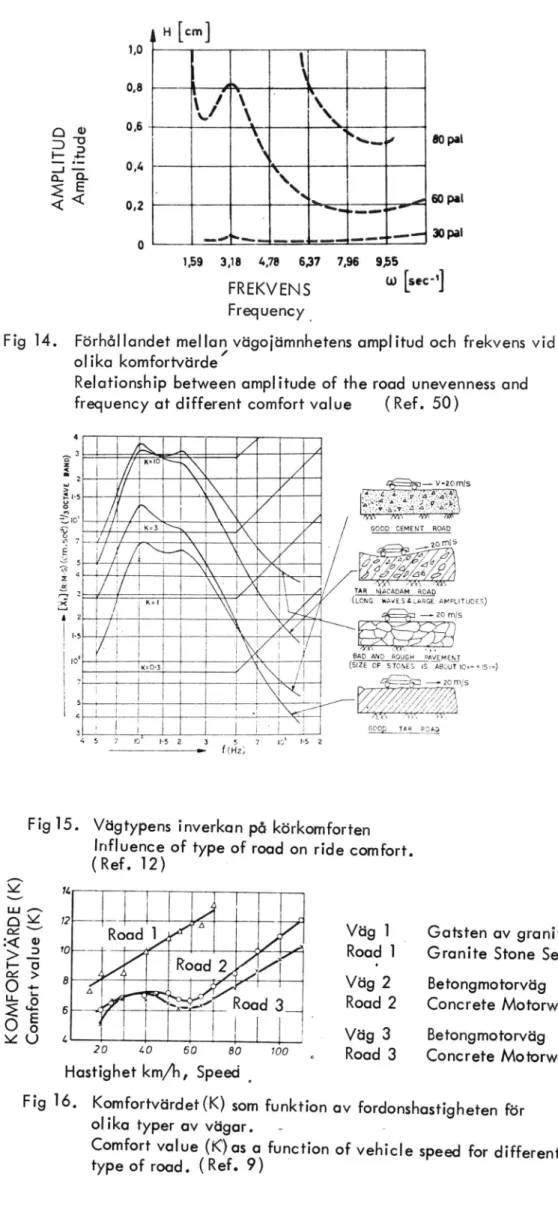
Relationship between amplitude of the road unevenness and 63
frequency at different comfort value
Influence of type of road on ride comfort 63
Comfort value (K ) as a function of vehicle speed for different 63
Fi: 17 18 19
20
21 22 23 24 25 26 27 28 29 30 31 32 33 34 35Explanation of the theory behind road holding index
Two axle vehicle model with seat and driver. (Six-degree-
of-f reedom)
Configuration of the sinusoidal function
Block diagram of data flow line for determination of road holding and ride comfort index using an analog computer
Analog scheme for generation of continuous sinusoidal function Analog scheme for one axle vehicle model with function gene rator and mean value computation units
Analog scheme for two axle vehicle model with function gene rator, road holding, and ride comfort computation units Analog scheme for the comfort index computation unit accor ding to VDI-guide-line-Standard 2057
Analog scheme for the computation of road holding index Influence of different amplitudes (A) on dynamic wheel load variations as a function of frequency (f)
Peak values of dynamic wheel load at natural frequencies of body and rear axle of the vehicle as a function of road amplitude
Influence of different wave lengths ( A ) on road holding index
as a function of vehicle speed for A = * 0,05 (m)
Influence of different wave lenghts (a) on road holding index
as a function of vehicle speed for A = t 0,02 (m)
Influence of different wave lenghts ( A ) on road holding index
as a function of vehicle speed for A = * 0,01 (m)
Influence of different wave lenghts (a) on road holding index
as a function of vehicle speed for A = t 0,003 (m)
Influence of different amplitudes on road holding index as a
function of vehicle speed for wave lenght A = 2,5 (m)
Significant wave length (a) for road holding as a function of
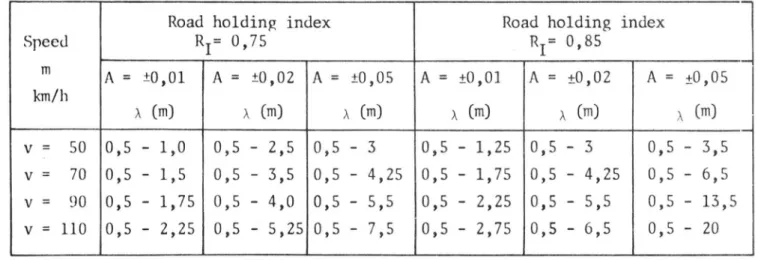
vehicle speed for different amplitudes (A) (Rj= 0,85)
Significant wave length (a) for road holding as a function of
vehicle speed for different amplitudes (A)(Rj= 0,75)
Influence of different wave lengths (a) on impact factor as a
function of vehicle speed for A = t 0,05 (m)
Influence of different wave lengths ( A ) on impact factor as a
Figure 37 38 39 40 41 42 43 44 45 46 47 48 49 Table 1 2 3 4
Influence of different wave lengths (a ) on impact factor as a
function of vehicle speed for A = t 0,01 (m)
Influence of different wave lengths (a) on impact factor as a
function of vehicle speed for A = t 0,003 (m)
Influence of different wave lengths (a) on comfort
as a function of vehicle speed for A = t 0,05 (m)
Influence of different wave lengths (a) on comfort
as a function of vehicle speed for A = i 0,02 (m)
Influence of different wave lengths (a) on comfort
as a function of vehicle speed for A = t 0,01 (m)
Influence of different wave lengths (a) on comfort
as a function of vehicle speed for A = t 0,003 (m) Influence of different amplitudes on comfort value
function of vehicle speed for wave length a = 5 (m)
Significant wave lengths (a) for ride comfort as a function
of vehicle speed for A = t 0,05 (m)
Significant wave lengths (a) for ride comfort as a function
of vehicle speed for A = t 0,003 (m)
Significant amplitudes (A) with respect to ride comfort for
different wave lengths (a) as a function of vehicle speed.
(Wave lengths (a) as a function of vehicle speed)
Road profile measuring vehicle DF1 (Principle configuration)
Comparison between comfort values based on directly measured body acceleration and on body acceleration computed from measured road profile. Examples from smooth road
Comparison between comfort values based on directly measured body acceleration and on body acceleration computed from measured road profile. Examples from rought road
value (K )
value (K )
value (K )
value (K )
(K ) as a
Effect of wave lengths (a) on wheel load variations at diffe
rent vehicle speeds
Different comfort values compared in terms of vertical acce leration at frequency 5 Hz
Different ideas proposed by different investigations concer ning the influence of different vibration parameters on human sensation for different frequency ranges
Effect of wave lengths (a) on ride comfort at different
vehicle speeds Pape 71 71 72 72 72 72 73 73 73 73 74 75 76 18 26 26
Table Pape
5 Vehicle data for the test vehicle DF1 (For one axle vehicle 57
model)
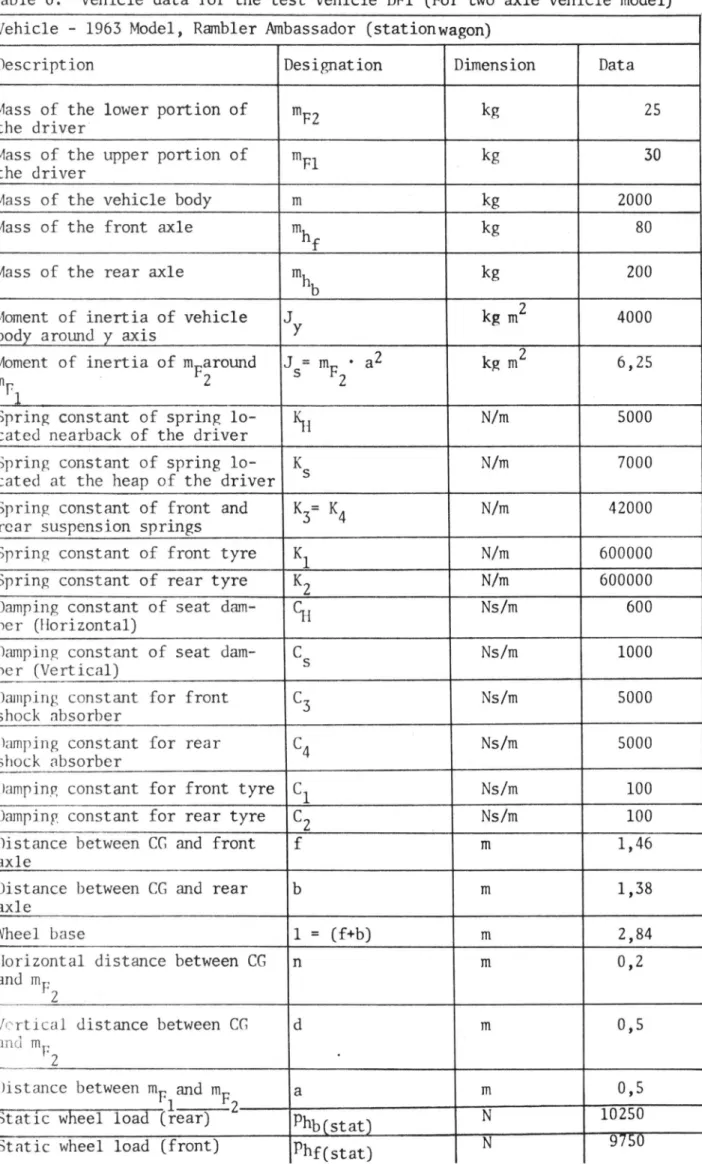
6 Vehicle data for the test vehicle DF1 (For two axle vehicle 38
model)
7 Range of wave lengths of significance for road holding 45
INTRODUCTION
The unevenness of road profile plays an important role in traffic safety
and comfort. It induces vertical motion to the sprung masses of the ve
hicle that may sometimes threaten the ride comfort i.e the subjective
experiences of well being of driver and passengers travelling in a vehicle. In addition to that, it also induces vertical motion to the unsprung masses of the vehicle that may cause serious damage to road and vehicle which may also deteriorate the road holding i.e the capability of a vehicle of braking and cornering. The influence of road unevennesses, therefore, must be jud ged by the two factors: 1) ride comfort, 2) road holding. Therefore, stan dard in a road is highly desirable to allow the traffic to flow safely and comfortably within permissible speed limits. To do that, however, one
requires the information about the dynamic behaviour of the "Vehicle-Driver- Road" system and the influences of different parameters on the total per
formance of ride comfort and road holding. Basically, the problem is to
find the optimum solution to this problem in the most economical way.
Although much information can be gained experimentally, it may be realised, that, purely experimental studies in which many different parameters are to be varied, must be limited within economical bounds. These limited studies may give an incomplete picture and sometimes lead to inconclusive results. Another better approach is to study the problem theoretically with the help of m o d e m computational technique.
Keeping above goal in mind, a long research program concerning the influ ences of road unevenness on safety and comfort was intitiated at The National Swedish Road and Traffic Research Institute, Stockholm, in the year 1966, under the sponsorship of The National Swedish Road Administra tion. The main objectives of this research program have been: development of a measuring device for rapid measurement of longitudinal road profiles, measurement of a number of typical road profiles, theoretical and experi mental analyses of ride comfort and road holding qualities of a vehicle as a function of vehicle speed on a given road. The works described in this thesis mainly concerns with the analysis of ride comfort and road holding qualities of a vehicle as a function of vehicle speed on a given road.
The works described in this thesis may briefly be summarised as follows: 1) The first part defines the terms "road holding", "ride comfort" and
their different criteria, and also attempts to review the different methods to determine the road holding and ride comfort.
2) The second part investigates the influences of different wave lengths and amplitudes on road holding and ride comfort as a function of vehicle speed with the help of linear two wheel - two axel vehicle model with seat and driver.
3) The third part compares the theory with some experimental results.
4) The conclusion suggests a range of significant wave length and ampli tudes which ought to be measured by a road surface measuring device.
6 . ROAD HOLDING AND RIDE COMFORT
This chapter will provide definitions of the terms "road holding" and "ride comfort" and a survey of literature describing different existing measuring criteria and methods to determine road holding and ride comfort of a vehicle on a given road. Furthermore, the recommendations made by different invesr tigators concerning the influences of different vehicle and road parameters on road holding and ride comfort will also be reviewed shortly in this chapter.
6 .1 Road holding
6.1.1 Definition of road holding
The road holding may be defined as the ability to utilize a given road fric tion for the transmission of forces in the longitudinal and transverse di
rections between wheel and road. It is influenced by the characteristics
of both the road and the vehicle. However, a road is characterized by its amplitudes and wave lengths or frequencies, whereas a vehicle is characte rized by the springing and damping properties of the tyre, wheel suspension systems and by the suspension geometry. The road holding can be described mathematically by one or other criterion that indicates upto what extent a
given road friction can be utilized during braking.
6.1.2 Road holding criteria
The vertical wheel load variation on the road, produced by the road une vennesses is the factor together with coefficient of friction determines the road holding. The road holding, however, can be described mathemati cally by means of a suitable criterion. The literatures on the subject reveal that several such criteria are available. An attempt, therefore, is made in the following chapter to review briefly some of the existing cri teria.
1. Impact Factor
The impact factor is defined as the ratio of total wheel load to static wheel load. It may be mathematically defined as (Ref. 7):
Q. ! s t a t l ^ n , x t ( 6 1 a )
where:
stat dyn tot
Impact factor (-) Static wheel load (N) Dynamic wheel load (N) Total wheel load (N)
It has also been defined statistically (Ref.7) as the ratio of 95 percentile
of the sum of dynamic and static wheel loads to static wheel load. It may
be mathematically defined as:
^s =
stat
(
6.
1.
2)
where: Qs = Statistically expressed impact factor (-)
Ps = 95 percentile of the sum of dynamic and static wheel load (N) Thus, the impact factors (Q and Q ) defined above are used as criteria for road holding. Using these criteria, different roads have been classified
(Ref.7). The typical measured results are presented below. Measurements were made at 50 km/h and the vehicle used was 3,6 ton heavy vehicle.
Type of roads Measuring speed
km/h Q=P. ./P . . x tot stat measuring distance 50 (m) W Pstat measuring distance 50 (m) 1. Bad roads 50 1 , 8 8 1,97 2. Normal good road 50 1,49 1,45 3. Motor way 50 1 , 6 6 1,39
2. Average Dynamic Wheel Load Decrement
The average dynamic wheel load decrement is defined as the time average of total wheel load decrement from the static wheel load in precent of the sta tic wheel load. According to Fig.l, it may be mathematically defined
(Ref.8) as:
E, + E ? + E, + E.
P ' = _i i ^ i loo (l) (6.1.3)
where: P^j = Average dynamic wheel load decrement
Using equation 6.1.3 as criterion for road holding, different roads have
been classified (Ref.8) and typical results are presented below. Measure
ments were made at 50 km/h and the vehicle used was Ford Taunus 1949 made.
Type of road Measuring speed
*d km/h 1 1. Bad road 50 13,5 2. Normal good road 50 6 3. Motor way 50 0,5
3. Random criteria for road holding
Considerable progress has been made in both the theory of random processes and its application to vehicle dynamic problems in the past few years. As a result, the road holding evaluations have been carried out by many inves tigators by using different random criteria for road holding. An attempt is made here to review some of such criteria which are used for evaluating road holding under random excitations. The important terms, associated with random processes theory that may often occur in the following discus sion, are defined in appendix so that readers may not be overwhelmed.
While applying the random processes theory for road holding evaluation, it is further assumed that the process in "ergodic stationary" (see appendix). The reason is that under such assumption,the statistical properties of the system can be determined by the quantities, such as, mean value, mean square value, root mean square value (rms) and power spectral density (PSD). Each of these quantities can be calculated either by analog computer techniques or by digital computer techniques. Such techniques are explained in Refe rence 15.
The root mean square (ms) values of the dynamic vertical and lateral for ces between wheel and road caused by the road unevennesses have been taken as the criteria for road holding (Refs.1,13,14). The rms value of the dy namic vertical displacement between tyre and ground caused by road uneven nesses has also been used as road holding criterion (Ref.12). The works reported in Refs. 21, 42,43 utilize the PSD of the dynamic wheel load cau sed by road unevennesses as the criterion for road holding. Experimental
techniques in the literature (Refs.12,13,14) are described to determine road holding in terms of rms and PSD. From all these investigations one may conclude that for good road holding these values should be small.
6.1.3 Methods for determination of road holding on a given road.
Mentions have already been made that the total vertical load or force bet ween wheel and road is the factor together with coefficient of friction
primarily decides the road holding, that is, the capability of the vehicle
of braking and cornering. However, this total vertical force is composed of static and dynamic wheel loads. The static wheel load is a constant factor whereas the dynamic wheel load is a variable and varies depending
on the conditions of road surfaces. It is, therefore, necessary to mea
sure the dynamic wheel load first^before going to evaluate road holding. Different techniques for measurement of dynamic wheel load have been re viewed briefly in reference 7. An attempt is made in the following chap ter to present the basic background theories of the technique developed upto now. Furthermore, different methods for determination of road hol ding on a given road will also be outlined in this chapter.
Measurement of dynamic wheel load: Basic principles.
All measuring techniquesupon which different devices have been developed to measure the dynamic wheel load are based on the following three prin ciples :
1. The dynamic wheel load can be measured by measuring instantaneously the body and axle accelerations of a vehicle. According to Fig.2, which rep
resents a very simplified one-wheel, one-axle vehicle model, the dynamic wheel load can be expressed as:
Pdyn ■ ” Z ♦ ma z'a ... (6.1.4)
2. The dynamic wheel load can be measured by measuring and adding instan taneously the spring and damping forces of the tyre. Referring to Fig.2, the dynamic wheel load can be expressed as:
3. The dynamic wheel load can be measured by measuring and adding instanta neously the axle acceleration, spring force and damping force of the sus pension springs and dampers. Referring to Fig.2, the dynamic wheel load can be written as:
P, = m Z -K (Z-Z ) - C (Z-Z ) .... (6.1.6)
dyn a z m v a' m v a' v '
Methods to determine road holding:
There are two methods to determine road holding on a given road. a) Determination of road holding in the vehicle.
b) Determination of road holding through analog simulation.
A brief review of the background in each of these methods follows:
a) Determination of road holding in the vehicle.
In this method, a test vehicle is required. The test vehicle is instrumen ted as desired in order to measure the vertical load between wheel and ground. Thus, the instantaneous vertical wheel load as a function of time or distance is measured by driving the test vehicle on the test road. Fi nally, the road holding is evaluated by applying any one of the criteria
defined in chapter 6 .1 .2 .
b) Determination of road holding through analog simulation.
An overall schematic view of this method which consists of a magnetic tape recorder and an analog computer,is shown in Fig.3. The actual road surface
is measured with the help of a road surface measuring device. It is then
recorded on a magnetic tape recorder. An analog computer is used to simul-
tate the tyre and suspension system of the test vehicle and actual road in
puts are fed into the system, using analog signals recorded on magnetic ta
pe. In this way, the road holding evaluation is carried out in the labora
tory as shown in Fig.3.
6.1.4 Road factors influencing road holding
The road factors that influence road holding are the amplitudes and wave
length or frequencies of the road unevennesses. Influences of these fac
tors on road holding have been investigated by many different people and some of their important results are presented in the following chapter.
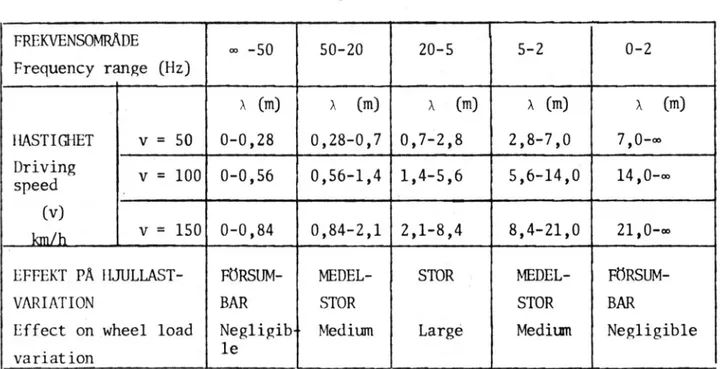
The influence of different wave lengths of the road unevennesses on road holding as a function of vehicle speed from 0 to 150 km/h at amplitude density (PSD), A (A) = 10 ^ (m) have been investigated (Ref.21) and it was found that the significant wave lengths for road holding lie in between 0.3 and 20 (m). The results are shown in table 1 and Fig.4. The influen ces of different amplitudes have also been investigated (Ref.13) and has been concluded that the road holding is deteriorated by increasing the amp litude density of the road unevenness.
Tabell 1. Våglängdens inverkan på hjullastvariationer vid olika kör
häst i ghet
Effect of wave lengths (x) on wheel load variations at different vehicle speeds (Ref.21)
FREKVENSOMR/ Frequency re IDE inge (Hz) - -50 50-20 20-5 5-2 0 - 2 HASTIGHET Driving speed (v) km/h .... v = 50 X (m) 0-0,28 X (m) 0,28-0,7 X (m) 0,7-2, 8 X (m) 2,8-7,0 X (m) 7,0-» v = 1 0 0 0-0,56 0,56-1,4 1,4-5, 6 5,6-14,0 14,0-oo v = 150 0-0,84 0,84-2,1 2 ,1-8 ,4 8,4-21,0 2 1 ,0-co EFFEKT PÄ HJULLAST- VARIATION
Effect on wheel load variation FÖRSUM BAR Negligib le MEDEL STOR ■ Medium STOR Large MEDEL STOR Medium FÖRSUM BAR Negligible
Moreover, the influences of different types of road on road holding have been investigated (Ref.12) and it has been reported that for all types of roads, the road holding is mostly affected in the frequency ranges bet ween 0,7 to 1,2 Hz and 7 to 25 Hz, and this is due to the resonance pheno
mena of the sprung and unsprung masses of the vehicle. It has been further
reported that the good tar road and good cement road have better road hol ding than the tar macadam road and bad rough pavement road. The results are shown in Fig.5.
6.1.5 Vehicle parameters influencing road holding
The vehicle parameters that influence road holding are the spring and dam ping constants of suspension systems, spring and damping constants of tyres
and the masses of the axle and body of the vehicle. Investigations concer
ning the influences of these parameters on road holding have been studied by many different investigators and some of their important results are briefly outlined in the following chapter.
The influences of said parameters on road holding have been investigated (Refs.5,12,13,22,42,43) and it can be concluded that spring and damping constants of suspension system should be so correlated that the relative damping of the shock absorber has a value between 0,25 and 0,4 independent of the vehicle load.
Furthermore, the spring and damping constants of tyres and axle mass should be kept as low as possible. However, constructive problem at present limits the spring constants to give a natural bounce frequency of the body between
0,5 and 2 Hz. and of the axle of 8 and 12 Hz. In order to maintain the re
lative damping within the given limits, therefore, springs and dampers with variable load dependent characteristics must be used on vehicle with large difference between laden and unladen body masses.
6.2 Ride comfort
6.2.1 Definition of ride comfort
Ride comfort is defined as the subjective experience of well being of dri ver and passengers travelling in a vehicle. The factors that influence ride comfort are: the noise, smell, light, temperature, road condition, vehicle dynamics, human dynamics as well as mental and physical conditions of vehic le occupant. However, consideration of all these factors while defining ri de comfort in terms of subjective experience seems difficult. The above de finition of ride comfort, therefore, is restricted only to the subjective feeling resulting from vibration of the vehicle due to road originated dy namic forces and all other factors are neglected.
6.2.2 Ride comfort criteria
A comfort criterion defines the degree of correlation between the human
sensation and the vibration. It provides guide lines for tolerance levels.
In order to establish different comfort levels, therefore, tests have been
tests a subjective concept has been established by asking a person whether he feels comfortable or not when subjected to harmonic vibrations. The results are usually given in terms of acceleration versus frequency. Final ly, from these results comfort value is defined. A comfort value defines the relationship between the psychological magnitude of ride sensation and
the physical magnitude of vibration intensity. It is expressed as a number
or index that can be interpreted in order to describe the degree of comfort in terms of tolerance time or expression like "perceptible", "unpleasant"
and "intolerable". It has been defined in a number of different ways and
some of them are defined in the following chapters.
1. Dieckmann comfort criterion
The Dieckmann comfort criterion (Ref.19) defines comfort index in the fre
quency ranges from 0 to 100 Hz. In these frequency ranges, it is defined
as: (a) From 0 to 5 Hz: KPI II tN J ts. • • • • (a) ) (b) From 5 to 40 Hz: k di = 5-Z-f ... (6 .2 . 1 (b) ) (c) From 40i to 100 Hz: *DI = 2 0-Z .... (c) )
where: = Dieckmann comfort value
Z = Vibration amplitude (mm)
f = Frequency (Hz)
2. Jacklin-Liddell comfort criterion
The Jacklin-Liddell comfort criterion defines comfort index (Ref.28) in the frequency range from 1 to 10 Hz. It may be expressed as:
KjL = ( Z-f2) e°’6 ‘f (6.2.2)
where: K-^ = Jacklin-Liddell comfort index
e = Base of natural logarithm (2,7183)
Z = Vibration amplitude (ft)
f = Frequency (Hz)
3. Janeway comfort criterion
The Janeway comfort criterion defines (Ref.31) comfort index in the frequen
KJ R = a *Z-fK ... (6.2.3)
where: KJR = Janeway comfort index
Z = Vibration amplitude (inch)
f = Frequency (Hz)
k = Exponent varying from 1 to 3
a = Constant
In different frequency ranges, it is defined as:
(a) From 1 to 6 Hz: k= 3 ; a = 1/6:
Kjr= i .Z.f3 (6.2.3 (a))
It indicates that comfort index is proportional to the rate of change of
acceleration (Z*(2irf) ), that is "jerk". In this frequency range, maximum
tolerable "jerk" value is set to 40 ft/sec3 (Kjp=l/3).
( b) From 6 to 20 Hz: <=2 ;a=I:
Kjr= Z-f2 ... (6.2.3 (b))
It indicates that comfort index is proportional to vibration acceleration
(Z‘(2irf)2). In this frequei
set to 3,3 % g (KjR = 1/3).
2
(Z‘(2irf) ). In this frequency range maximum tolerable acceleration value is
(c) From 20 to 60 Hz:< =l;a=l/60:
kj r = h z ' f ... ( 6 - 2 - 3 Cc))
It indicates that comfort index is proportional to vibration velocity (Z*(2irf)). In this frequency ranges maximum tolerable velocity is set to 0,105 inch/s (KJR= 1/3).
4. Meister and Reiher comfort criterion
The Meister and Reiher comfort criterion defines (Ref.41) comfort index in
the frequency range from 1 to 70 Hz. It may be expressed as:
KRM= 1 0 log (Z*f)Q ... (6.2.4)
where: = Meister and Reiher comfort index
Z«f = Velocity of vibration (cm/s)
(Z*f)Q = Velocity of vibration for threshold and it was approximately equal to 0,04 cm/s
5. Sperling and Betzhold comfort criterion
The Sperling and Betzhold comfort criterion defines (Ref.52) comfort index
in the frequency range from 1 to 20 Hz. It may be expressed as:
Kqr= 2,7 SB= 2,7 AV Z -fJ 1 0J Z3 *f5 ... (6.2.5)
where: Kgg = Sperling and Betzhold comfort index
Z = Vibration amplitude (mm)
f = Frequency (Hz)
6 . Society of the German Engineers comfort criterion - standard - 2057
The society of the German Engineers comfort criterion - standard 2057 (VDI-2057) defines (Ref.57) comfort index in the frequency range from
0,5 to 80 Hz. It may be expressed as:
K* = ■ j j-.. (6.2.6)
/l+(f/f0 ) 2 '
where: K * = Comfort index defined by VDI-2057
2 2
Z*f = Acceleration in (m/s )
f = Frequency (Hz)
fQ = 10 Hz
a = Constant (For effective value of acceleration,a = 18, and for
peak value of acceleration a = 12,5)
7. Zeller comfort criterion
The Zeller comfort criterion defines (Ref.60) comfort index in the frequen
cy range from 1 to 100 Hz. It may be expressed as:
Kzr= 10 log (6.2.7)
where: K^R = Zeller comfort index
Z = Vibration amplitude (cm)
f = Frequency (Hz)
8 . Random criteria for ride comfort
The comfort criteria defined above primarily referred to harmonic vertical vibration. However, the actual vehicle environment presents whole body vibration to the human in all six-degrees-of-freedom and is random vibra tion characteristics of the vehicle and the road. Therefore, techniques and criteria for ride comfort have been developed to determine ride comfort in random environments (Refs.11,47,48). Some of the random criteria for ride comfort are defined briefly in the chapters that follow.
A. Transfer function
The effects of random vibration environments upon human beings have been
expressed in terms of "transfer function" in the frequency spectrum from 1
to 60 Hz. The transfer function is defined as the ratio of output informa tion to the input which causes the output. The three transfer functions
(Ref.47) of interest are as follows:
1. The transfer function, relating acceleration output to acceleration in put, may be expressed as:
(Z-f2)out
(
6
.
2.
8)
’( a c c n ) ^ (z.f2)
in
2. The transfer function, relating input force of vibration to the output acceleration, may be expressed as:
F.
Gp(s) = .... ... (6.2.9)
(Z*f ) *
v 'out
3. The transfer function, relating force input to acceleration input called "driving point acceleration", may be expressed as:
F.
G r m >(s) = - i a -ö ... ... (6 .2 .1 0)
U ’lj (Z-fZ).
J in
The basis of determining transfer function is the frequency spectrum. The general procedure in simplified form, is to produce a known sinusoidal in put of specified magnitude and frequency and to record the magnitude and phase of the steady-state output. The frequency of the input is then chan ged to another value, and again the output is recorded. This procedure should be conducted at every low frequency and extend in appropriate incre
ments to a frequency level at which the output magnitude is approximately
abscissa. From this relationship, the transfer function may be determined (Ref.47).
The concepts of transfer function have been utilized for analyzing and eva
luating vibration measurement in an on-the-road environment (Ref.11). It
indicates that the transfer function of a man can be determined by taking a ratio of the measurement of comfort (ride sensation or comfort index) over the measure of ride environment (acceleration). More clearly, it can be expressed as:
m r r r Ride sensation Comfort index
Transfer function of a man: 7 ^ - 3--- :---— = ---=----r~.
---Ride environment Acceleration
It must be mentioned here that such ratios can be determined using anyone of the comfort criteria defined previously by reorganizing the data. The common property of all transfer functions is that in each case a ratio of comfort index to level of acceleration is formed. To compute the level of comfort for a given level of acceleration, the transfer function is multi plied by the peak amplitude of acceleration.
B. Absorbed Power
The absorbed power defines human response to vibration in terms of vertical input and man's transfer function. Assuming that the human body responds
like a linear system to vertical vibrations within 0 to 60 cps. frequency
range, the absorbed power has been defined (Ref.48) as:
1 *
P = limit j f F(t)*(Z-f) dt ... (6 .2 .1 1)
w t-* °° 0
where: P^ = Absorbed power
F(t) = Input force as a function of time
(Z*f)(t)= Input velocity as a function of time
t = T ime
The modified equation for absorbed power may also be written as:
P = c*(Z*f2) 2 (6.2.12)
w v ' rms
where: P = Absorbed power
W 2
Z*f = Input acceleration
c = It is a function of frequency, but is constant at anyone
Thus, the power in equation 6.2.12 has been related to the factor c and the square of acceleration.
The comfort indexes, transfer function and absorbed power defined above pro vide most of the information which is at present available on the reaction of human beings to vibration. The results of the investigations that show the variations of a number of measured comfort levels from the threshold level to the level of extreme discomfort with respect to acceleration, amp litude and frequency are shown in Figs.6-9. A comparison of different criteria in terms of vertical acceleration at frequency of approximately 5 Hz is shown in table 2. The different ideas proposed by different inves tigators concerning the influences of different vibration parameters on human sensation for different frequency ranges are presented in table 3.
6.2.3 Methods for determination of ride comfort on a given road
The different methods, that are in frequent use,may be classified into the following two classes:
1. Subjective method
2 . Objective method
A brief review of the background in each of these are as follows:
1. Subjective method
The usual method of evaluation is that of a "jury rating". A group of people are asked to assign a number to their subjective impressions of a particular vehicle over a particular road. An average number is then assigned to that vehicle. This evaluation is often carried out by "pair comparison" of vehicles. The procedure followed is to chose two identical vehicles of the same make and model with similar ride properties. Each member of the jury then rides several times in each vehicle over the same stretch of the road. A composite jury decision of ratio comparisions is then assigned to that road.
2. Objective method
In this method a physical variable that characterizes ride comfort, such as
vertical acceleration of a seat, is measured. It is then correlated with
either of the comfort criteria defined in chapter 6 .2 . 2 in order to assign
the comfort index. It is facilitated by the following techniques:
(a) Determination of ride comfort in the vehicle
(b) Determination of ride comfort through Analogue Computer (c) Determination of ride comfort through car simulator
A c c e l eration V D I - 2057 Sperling - Betzhold Reiher - M eister Z e lle r Dieckm ann / 2
cm/s K* Judgem ent k s b Judgem ent k r m Judgem ent k z r Judgem ent k d i Judgem ent
0 ,2 0,1 Perceptibl e threshold 0 N o t perceptib le 0 0,1 0 ,5 0,1 to 0 ,3 Ba rely perceptib le 1 ,0 V e ry good 0,1-1 Im perceptible to si igh tly uncom fortable 1 2 la W e a k ly perceptib le 0-10 Perce p tib le threshold 0 ,3 to 1 Shaking bearable for hours 1,5 Almost v e ry good 10-20 Ba rely threshold 5 lb Easil y perceptib le 1-10 SI ightl y disagreeable to disagreeable w ith a fatique time o f one hour 1 to 3 Still bearable after hours 20-30 U n a ccep tab le shaking in bu i 1d i ng 10 2 ,0 Almost good Ic ( 7) Strongly perceptibl e 30-40 V ib ra tio n in q u ie tly running v e h ic le 20 3 to 10 U ncom fortable, bearabl e maximum for 1 hour 2/5 Almost good 40-50 V ib ra tio n in v e h ic l e 50 3 ,0 Satisfactory 1 la (10) Unpleasant 10-100 V e ry disagreeable to ex cee d in g ly disagreeable with a fatique time of one minute 100 10 to 3 Bearabl e maximum for 10 minutes 3,5 S till satisfactory 50-60
Bearable for short tim e, h e avy shaking in v e h ic le 4 ,0 O p era b le 200 • 500 60-70 Physical disturbances 30 to 100 Unbearable 4 ,5 N o t operable Mb (12) V ery unpleasant ' 5 ,0 Dang erous to
operate 70-80 s Unb earable
1000
80-100 Unbearable
T ab ell 2. Jäm förelse m ellan o lik a komfortvärden graderade med hänsyn t ill v e rtik a l a c c e le ra tio n v id frekvensen 5 Hz D ifferent comfort valu es compared in terms of v e r tic a l a cce le ra tio n at frequency 5 Hz
Different ideas proposed by differen t investigators concerning the influences of d ifferen t vib ration parameters on human sensation for different frequency ranges
(a) Determination of ride comfort in the vehicle
A block diagram of the procedures is shown in Fig.10. A vehicle itself is used as a measuring elements in this technique. A test vehicle is selected
in which an accelerometer between heap of the driver and seat is mounted. It is then driven on a given road. The accelerometer measures the vertical acceleration of the seat which is spontaneously passed through ride-meter that gives the comfort index.
(b) Determination of ride comfort through analogue computer
A block diagram showing the working procedures is shown in Fig.11. First,
the road surface of a given stretch of road is measured and then comfort index is evaluated in the laboratory with the help of an analog computer. The measured road surface is recorded on a magnetic tape. Mathematical mo del of a test vehicle with driver is developed. The output signal from the tape recorder is used as the input disturbance for the development model. The equations of motion that describe ride motions are solved by the analog computer. The ride evaluation circuit is also developed in the computer. The output signal of the vehicle model is then passed through the ride- meter. The output of the ride-meter gives the comfort index, as seen from
Fig.11.
(c) Determination of ride comfort through car simulator
Apart from tape recorder and analog computer, a car simulator is also used in this technique. A block diagram showing an overall schematic view of this system is shown i Fig.12. The function of a tape recorder is to supp ly actual road profile into the analog computer as an input disturbance on ly to the suspension system. An analog computer is used to simultate the suspension of the vehicle without seat and driver. A car simulator is used to reproduce the car body motions determined by the computer. The simula tor is comprised of a portion of a standard car body and is driven by electrohydraulic servomechanism whose inputs are output voltage from the analog computer. Two passengers may be accomodated in the motion simulator and driver may control the speed of the car by pressing the brake or acce lerator which sends a signal to a small computer which determines the resul ting car speed and which, in turn, sends a speed signal to the tape recor
der. In this fashion the analog computer is used to change the suspension
car body on top of the hydraulic mechanism. As seen from Fig.12, it is possible that the ride comfort can be evaluated both subjectively and ob jectively. Thus, if necessary, the two results can be compared.
6.2.4 Road factors influencing ride comfort
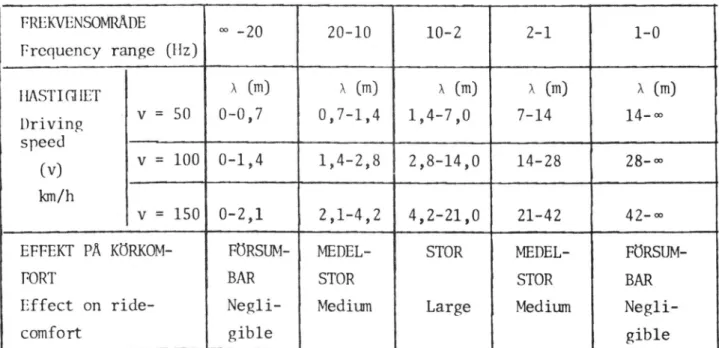
The amplitudes and wave lengths of the road unevenness infleunce not only the road holding but also the ride comfort. The influences of different wave lengths on ride comfort have been investigated (Ref.21) in the driving
speed ranging from 0 to 150 km/h. The amplitude density of the road une
venness used in this investigation has been A ( A ) = 10 ^ (m). It has been
reported that the significant wave lengths for ride comfort lie in between
0,7 and 40 (m). The results are shown in table 4 and in Fig.13. It has
been further reported (Ref.50) that the influences of wave lengths from
1,5 to 2,5 (m) and amplitudes from 5 to 8 (mm) could be considered as un
comfortable. The relationship between amplitude of the road unevenness and frequency at different comfort values as reported in reference 50 is shown in Fig.14.
Tabell 4. Våglängdens ( A ) inverkan på körkomforten vid olika körhastighet
Effect of wave lengths ( A ) on ride comfort at different vehicle
speeds (Ref.21) FREKVENSOMRÅDE Frequency range (Hz) °° - 2 0 2 0 - 1 0 1 0 - 2 2 - 1 1 - 0 HASTICHET Driving speed (v) km/h v = 50 A (m) 0-0,7 A (m) 0,7-1,4 A (m) 1,4-7,0 A (m) 7-14 A (m) 14_oo v = 1 0 0 0-1,4 1,4-2, 8 2,8-14,0 14-28 28-°° v = 150 0-2 , 1 2,1-4,2 4,2-21,0 21-42 42-co EFFEKT PÅ KÖRKOM- FORT Effect on ride- comfort FÖRSUM BAR Negli gible MEDEL STOR Medium STOR Large MEDEL STOR Medium FÖRSUM BAR Negli gible
Further investigations have been made (Refs.12,.3 and 9) from which the following conclusions can be drawn:
All roads having less comfort in the frequency range from 0,7 to 4 Hz. It
has been further reported that the good tar and good cement roads have bet ter comfort than the tar macadam road and bad rough pavement. The results reported (Ref.12) is shown in Fig.15.
6.2.5 Vehicle parameters influencing ride comfort
The ride comfort is mostly influenced by the following vehicle's parame ters: the spring and damping constants of the suspension and the seat. The influences of said parameters on ride comfort have been investigated by many different investigators (Ref.5,12,13,22,42,43,61) and some of their
important results may be summarized as follows:
To improve ride comfort, the spring and damping constants of the suspen sion system should be so correlated that the relative damping of the shock absorber has a value between 0,25 and 0,4 independent of the vehicle load.
In order to maintain this, therefore, suspension spring and dampers with variable load dependent characteristics must be used on vehicle with large difference between laden and unladen body masses.
With regard to seat suspension, an exact accounting of the vibratory mo tions of parts of the passengers' bodies, which are spring-supported in the seat, is very difficult because these motions are coupled with car bo dy motions, that is the two vibratory motions influence one another. However, it is suggested that the seat spring should be such that the na tural frequency of the "seat-man" system should not coincide with those of the vehicle body and axle natural frequencies to avoid resonance effect.
It has been found that in practice the natural frequency of "seat-man"
system should lie in between 2 and 3,5 Hz (Ref.61). In addition to that it
has been further recommended (Ref.61) that the seat damping should be such that the seat's amplification factor at resonance frequency must not ex
ceed the value 2 .
7. ANALYSIS OF THE INFLUENCE OF ROAD UNEVENNESS ON ROAD HOLDING AND
RIDE COMFORT
7.1 Purpose of the research
The purpose of this investigation, as indicated in introduction, is to find a suitable way so that the influences of road unevenness in terms of
analysis may probably be the most suitable one. To do that however, one requires the mathematical model of the system, measuring method and cri teria. Therefore, the main purposes of this investigation are:
Firstly, to develop mathematical model of a "Vehicle - Driver - Road" system.
Secondly, to test the method and criteria adopted for this investigation by means of theoretical road and vehicle models.
Thirdly, to show how the selected criteria for ride comfort and road hol ding can be utilized to characterize a road for it's quality.
Lastly, to show how the parametric values of the road unevenness can be evaluated from safety and comfort view points.
7.2 Scope of the research
It is an analytical investigation carried out with the aid of an analog
computer, therefore, the analysis is made under the following limited
scopes: The physical vehicles under consideration is represented by two
different models. First one is a very simple one-axle, one-wheel model
which is represented by two-degrees-of-freedom system. Second one is a more complicated model which is represented by six-degrees-of-freedom sys
tem. It consists of two-axel, two-wheels and seat with driver. The actual
road is represented by continuous sinusoidal waves of varying amplitudes and wave lengths. The investigation is conducted under the following rest- rictd parametric ranges:
vehicle speeds: 10, 15, 20, 25, 30, 35 (m/s)
wave lengths: 0,5; 1,0; 2,5; 5,0; 10,0; 25; 50; 100 (m)
amplitudes: 0,003; 0,01; 0,02: 0,05 (m)
frequency range: 0,1 to 70 (Hz)
7.3 Road holding index
Different existing criteria for road holding have already been defined in chapter 6.1.2. Apart from those criteria, there is developed a criterion for road holding called "Road holding index" which is going to be applied
for the present investigation. It is, therefore, important to define the
term "Road holding index". An attempt is made in the chapter that follows in order to define the said term.
In words, the Road holding index may be defined as the ratio between the mean value of the effective wheel load and the static wheel load. Consi
Rr r — < 1 ... C7-3-1)
stat 3
where is the mean value of the effective wheel load and is expressed as:
1 T
P'= ± ' Pp dt ... (7.3.2)
T 0 E
where Pg is the effective wheel load and is expressed as:
PE= ' f(t)-dt for f ( t ) £ P stat ... (7.3.3)
The road holding index defined by eq. 7.3.1 indicates the part of the sta tic wheel load that can be utilized during braking on a given road.
7.4 Ride comfort index
Different criteria for comfort defined in chapter 6.2.2 provides most of the information which is at present available on the reaction of human beings to vibrations. To avoid having too many data on one figure, the
results have been presented in Figs.6-9. These figures show the variations
of number of measured comfort levels from the threshold level to the level
od extreme discomfort with respect to vertical acceleration amplitude and
frequency.Comparison of different comfort values in terms of vertical
acceleration at frequency of approximately 5 Hz is shown in table 2. The different ideas proposed by different investigators concerning the influen ces of different vibration parameters on human sensation for different fre
quency ranges are shown in table 3. It can be easily seen from Figs.6-9
that all different criteria do fairly agree with each other. From table
2 , the different permissible vertical acceleration limits, at approximate
ly 5 Hz, by different investigators are found to be nearly the same and are as follows:
VDI-Guide line 2 0 to 1 0 0 cm/s
Reiher-Meister 2 0 to 1 0 0 cm/s^
Spe r1ing-Bet zhoId 50 to 400 cm/s^
Dieckmann 2 0 to 50 cm/s^
Zeller 2 0 to 1 0 0 cm/s^
The newly developed criteria such as transfer function and absorbed power need very expensive electronic instruments. As they were not available,
in this investigation, therefore, the comfort criterion defined by the So ciety of the German Engineers standard 2057 (Ref.57) is adopted. It has already been defined (chapter 6.2.2) and the results are shown in Fig.9.
Mathematical models of vehicle
A mathematical model consists of a series of mathematical expressions that describe the total motion of interest of the physical system. The models of a test vehicle investigated are: the one-wheel, one-axle and represented by two-degrees-of-freedom system,and the two-wheels, two-axle model with seat and driver and is represented by six-degrees-of-freedom system. These models are developed in a generalized form so that the solution can be app
lied to any passenger vehicle. The model descriptions and the equations of motion are presented in the following chapters.
The one-wheel, one-axle vehicle model is depicted in Fig.2. The equations of motion of such simple model are found abundant in literatures and may be rewritten as:
Bounce motion of vehicle body
m Z+K (Z-ZJ + C (Z-ZJ= 0 (7.5.1)
m a m a
Bounce motion of wheel axle:
in Z -K (Z-Z )-C (Z-Z )+K (Z -Zn)+C«.(2 +Zn)=0 .... (7.5.2)
a a m v a ' m a' t v a 0' t a 0
The equation of motion for dynamic wheel load is expressed by equation 6.1.4.
The two-wheel, two-axle vehicle model including seat and driver is depicted in Fig.18. Since the model is complicated, simplifying assumptions are ma de to keep the model workable. The following assumptions are made to deve lop the model:
(a) The engine and the body and its contants are rigidly connected to frame which is rigid.
(b) All the wheels are identical and the tyres contact the ground at points directly below the wheels.
(c) The system is treated as one with six-degrees-of-freedom having rigid mass, stiffness and damping.
(d) The driver is represented by means of two mass points rigidly connected with a weightless rod. The upper portion of driver is supported by spring and damper located horizontally near the back of the seat. The lower por tion of driver is supported by spring and damper located vertically under the seat.
(e) The damping is considered to be proportional to velocity of the mo tion, that is viscous.
(f) The movements of the system elements are constrained and the following motions are considered:
1. Vertical motion of the driver.
2. Longitudinal motion of the driver head.
3. Vertical motion of the center of gravity of the vehicle. 4. Vertical motions of the rear and front axle.
5. Pitching motion of the vehicle body, that is, the structure oscillation about the center of gravity in a vertical plane.
Equations of motion
The motions of the model in question are defined in terms of generalized co-ordinates, since the vehicle's displacement, velocity and acceleration
are assumed to be known function of time. In order to develop the equa
tions of motion for this model, Langrange's Equations in the following form are applied:
d_ dt
9TE 3TE x JV . 3R
+ + r r - = Q ... (7.5.3)
9qi 8qi vi
where: Tp = Total kinetic energy of the system as a function of q. and q.
E X I
V = Total potential energy of the system as a function of q^ R = Viscous dissipation function
= Generalized force
q^ = Time derivative of the generalized co-ordinate
Expressions for the total kinetic and potential energy of the system, the viscous dissipation function and the non-ceonservative generalized forces of the system are as follows:
Kinetic energy of the system
T - 1 m 72Jl t -2* 1 T a2 . 1 f .m ^ 4 2 . 1 m a2 .
TE 2 2 s <p 2 y 2 ^ FI F2^ s 2 hf f
, 1 a2
Potential energy of the system
V - \ K 1 (Zf-Z0)2 * i K2 (Zb-Z') ♦ \ Kj (Z-fe-Zf)2 .
+ I k4 (z+be-zb) +
J
Ks (Zg-Z+ne)2 ++ ^ (de-<p*a*cos<|>g) 2 (7.5.5)
Viscous dissipation function
R =
1
C1 ' W
* * I C2
Wo>2
* I
C3(Z-f5-Zf J2 *
+ I C4 (Z+b0-Zb ) 2 + i Cs (Zs-Z+-ne) 2 +
+ \ Si cos<Pq) 2 (7.5.6)
Substituting equations 7.5.4, 7.5.5 and 7.5.6 into Lagrange's equation 7.5.3 and noting that
h = a cos <Pq (7.5.7)
where <j>q = Initial value of <j> (rad); > ^ = 0 A h =~ a
the following equations of motion for the system shown in Fig.18 are obtained:
Equations of motion
1. Bounce motion of vehicle body
m Z + K3 (Z-fe-Zf ) + K4 (Z+b6-Zb) - Ks (Zg-Z-t-ne) +
+ C3 (Z-fö-É£) + C4 (Z+bé-Zb) - Cg (Zg-Z+ne) = 0 (7.5.8)
2. Pitch motion of vehicle body
J y e - k3- f (z-fe-zf ) + k4- b (z+be-zb) *
+ Kg n(Zg-Z+ne) + d(de-<ph) - C3 f(Z-f0-Z£) +
3. Pitch motion of driver's upper portion
Js<p - h (ed-<ph) - h (éd-qih) = 0 (7.5.10)
4. Bounce motion of driver
(mp^+ n\p2) Zg+K,,(Z-g-Z+n0) + Cg(Zg-Z+né) = 0 .... (7.5.11)
5. Bounce motion of front axle
mhf Zf+Kl (Zf’V + C1 " K3 (z-f0
-zf)-- C3 (Z-fé-Zf) = 0 (7.5.12)
6 . Bounce motion of rear axle
"hb V
K2( V ZP *
C2-
K4 tz*bezb)-- C4 (2*be--Zb) -- 0
(7.5.13)
7. Dynamic wheel load (front)
Ph(dyn) ‘ W
V
* Cl (Zf V
( 7 -5 ' 14>
8 . Dynamic wheel load (rear)
pb(dyn) = ¥ V * P *
V k 4 ?
... ' 7 -s ' 15)
These equations of motion of the system are only valid till there is con tact between the wheel and road. Under no contact case the tyre spring has no effect on the motion. Therefore, simulation of these equations on the computer involves setting up limiting devices to remove the tyre spring effect when the tyre leaves the ground.
7. 6 Road model
The road surface can be described either by simple wave functions of a sinusoidal character or by the random character. The random descriptions of road surface needs considerable skill and expensive electronic instru ments. Therefore, the road surface, for the present investigation, is
assumed to be a continuous sine wave of varying wave lengths and amplitu
des. The geometry of the road is shown in Fig.19. It can be mathemati
Zq = A (cos cat - 1) (7.6.1) and
ZQ = A sin o>t (7.6.2)
where: Zq = Excitation function
ZQ = Time derivative of Zq
A = Amplitude (m)
u) = Angular frequency (rad/s)
t = Time (s)
7.7 Vehicle data
The test vehicle DF1 selected for this investigation is an American
stationwagon, 1963 model Rambler Ambassador. In order to simulate the mo
del, the physical parameters of the test vehicle (such as masses, moment of inertia and spring and damping constants) are needed. Most of the data
presented in table 5 and 6 was supplied by the institute except the spring
and damping constants of the tyre under test. As these two parameters were not available, experiments were carried out by the author to get the-
said parameters. The results of the experiments have been reported in
Different methods for determination of road holding and ride comfort have already been described in chapters 6.1.3 and 6.2.3 respectively. The chosen method of analysis for the present analysis is an "analog simula tion method", where solutions of the equations of motion and computations of the results are made with the aid of an analog computer of type EAI-680 available at the institute. The block diagram of data flow line for deter mination of road holding and ride comfort index is shown in Fig.20.
The analysis is effected in four stages:
(a) Generation of continuous sinusoidal functions.
(b) Programming and solution of the equations of motion.
(c) Obtaining the road holding and ride comfort index computation units. (d) Data processing for road holding index, ride comfort index and impact factor.
Ref.51.
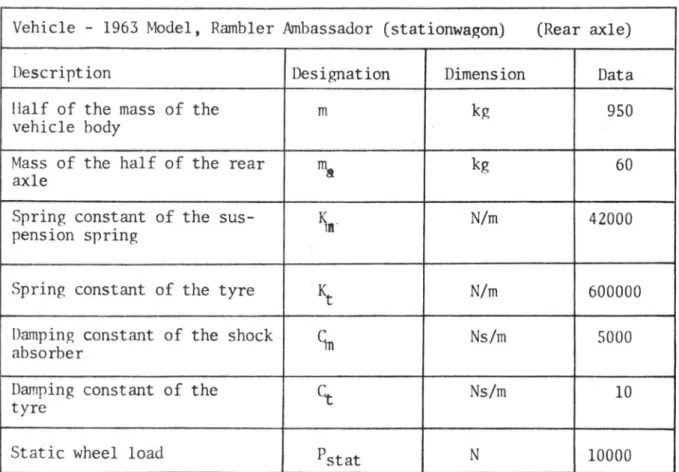
Tabell 5. Data för försöksfordon DF1 (för enaxlig fordonsmodell)
Vehicle data for the test vehicle DF1 (for one axle vehicle model)
Vehicle - 1963 Model, Rambler Ambassador (stationwagon) (Rear axle)
Description Designation Dimension Data
Half of the mass of the vehicle body
m kg 950
Mass of the half of the rear
axle ma
kg 60
Spring constant of the sus
pension spring V
N/m 42000
Spring constant of the tyre
Kt N/m 600000
Damping constant of the shock
absorber Sn
Ns/m 5000
Damping constant of the
tyre Ct
Ns/m 1 0
Static wheel load