Kerstin Robertson
Annika K. Jägerbrand
Georg F. Tschan
Evaluation of transport interventions
in developing countries
VTI r apport 855A | Evaluation of tr ansport interv www.vti.se/publicationsVTI rapport 855A
Published 2015
VTI rapport 855A
Evaluation of transport interventions in
developing countries
Kerstin Robertson
Annika K. Jägerbrand
Georg F. Tschan
Diarienummer: 2011/0469-24 Omslagsbild: Thinkstock
Abstract
International climate policy and the United Nations Framework Convention on Climate Change (UNFCCC) with the Kyoto Protocol include different mechanisms or programmes for actions in developing countries aimed at reducing emissions of carbon dioxide (CO2). To verify compliance, the effects of such actions, including transport measures, need to be measured, reported and verified (MRV).
However, in relation to other sectors very few transport-related projects have been initiated. Potential problems and ambiguities related to the current evaluation methodology were therefore investigated as a possible explanation for the low interest in investments in the transport sector. Other objectives of this study were to analyse the requirements for development and improvement of methods for evaluating the effects of transport policies and measures on emissions of greenhouse gases in developing countries. The analyses includes a review of different climate mechanisms, for example applied within the UNFCCC, evaluation requirements and methodologies used, the general availability of methods for evaluation of traffic and transportation, evaluation data availability, and institutional conditions in developing countries.
The main conclusions are that measuring traffic and transportation is generally a complex and
demanding process, and the potential for misinterpretation of results is significant. In addition, there is a significant risk of rebound effects, especially for transport projects in developing countries aiming at modal shift. Furthermore, it seems that very short time frames are applied for evaluation of project-based mechanisms in the transport sector. Other challenges relate to institutional roles and
responsibilities, the availability of personal and financial resources, and the knowledge and perspectives applied. Based on these limitations regarding transport project evaluations, further development of transport-related climate mechanisms towards a more sectoral and transformational perspective is suggested.
Title: Evaluation of transport interventions in developing countries Author: Kerstin Robertson (VTI, www.orcid.org/0000-0003-1041-1981)
Annika K. Jägerbrand (VTI, www.orcid.org/0000-0001-5322-9827) Georg F. Tschan (VTI, www.orcid.org/0000-0002-5108-9602) Publisher: Swedish National Road and Transport Research Institute (VTI)
www.vti.se Publication No.: VTI rapport 855A
Published: 2015
Reg. No., VTI: 2011/0469-24
ISSN: 0347-6030
Project: MRV (Measurement, Reporting, Verification) of Transport Activities in Developing Countries
Commissioned by: Swedish Energy Agency
Referat
Den internationella klimatpolitiken och Klimatkonventionen (UNFCCC) med Kyotoprotokollet omfattar olika mekanismer eller program för åtgärder i utvecklingsländer som syftar till att minska utsläppen av koldioxid (CO2). För att kontrollera efterlevnaden behöver effekterna av sådana åtgärder, till exempel transportåtgärder, mätas, rapporteras och verifieras (MRV).
I förhållande till andra sektorer har dock ett mycket litet antal transportprojekt genomförts hittills. Därför har tänkbara problem och oklarheter i samband med de tillämpade metoderna för utvärdering undersökts som en möjlig förklaring till det låga intresset för investeringar inom transportsektorn. Syftet med denna studie var att analysera eventuella behov av utveckling och förbättring av dessa metoder för utvärdering av effekterna av åtgärder inom transportsektorn på utsläpp av växthusgaser i utvecklingsländer. Analyserna inkluderar översikter över: olika klimatmekanismer, tillämpade krav och metoder för utvärdering av transportåtgärder och möjligheter och metoder för utvärdering av trafik och transporter generellt samt utvärdering av tillgång till data och institutionella förhållanden i
utvecklingsländer.
De viktigaste slutsatserna från denna studie är: att mäta trafik och transporter är generellt sett en komplicerad och krävande process och risken för feltolkning av resultat är betydande. Det finns därför en betydande risk för rekyleffekter, särskilt för transportprojekt i utvecklingsländer som syftar till förändrade färdmedelsval. Dessutom verkar en alltför kort tidsram tillämpas för utvärderingar av projektbaserade mekanismer inom transportsektorn. Andra utmaningar berör institutionella roller och ansvarsområden, tillgång till personal och ekonomiska resurser, samt den kunskap och de perspektiv som tillämpas. Baserat på dessa begränsningar av möjligheterna att utvärdera transportrelaterade projekt föreslås en vidareutveckling av dessa klimatmekanismer mot ett mer sektoriellt och transformerande perspektiv.
Titel: Utvärdering av transportåtgärder i utvecklingsländer
Författare: Kerstin Robertson (VTI, www.orcid.org/0000-0003-1041-1981) Annika K. Jägerbrand (VTI, www.orcid.org/0000-0001-5322-9827) Georg F. Tschan (VTI, www.orcid.org/0000-0002-5108-9602) Utgivare: VTI, Statens väg och transportforskningsinstitut
www.vti.se Serie och nr: VTI rapport 855A Utgivningsår: 2015
VTI:s diarienr: 2011/0469-24
ISSN: 0347-6030
Projektnamn: MRV (mätning, uppföljning, rapportering, verifiering) av transportåtgärder i utvecklingsländer
Uppdragsgivare: Energimyndigheten
Nyckelord: UNFCCC, MRV, Flexibla mekanismer, CDM, GEF, CTF, NAMA, CO2-emissioner, växthusgaser
Språk: Engelska
Foreword
This is the final report for the project ‘MRV (Measurement, Reporting, Verification) of Transport Measures in Developing Countries’ (project number 35446-1, dnr. 2011-004699) funded by the Swedish Energy Agency’s Climate Policy Research Programme.
Kerstin Robertson, Annika K. Jägerbrand and Georg F. Tschan, the Swedish National Road and Transport Research Institute (VTI), jointly conducted the project by writing separate or joint parts of the report. Hillevi Nilsson Ternström from the Library and Information Centre (BIC) at VTI is highly appreciated and acknowledged for her support and help with the literature search.
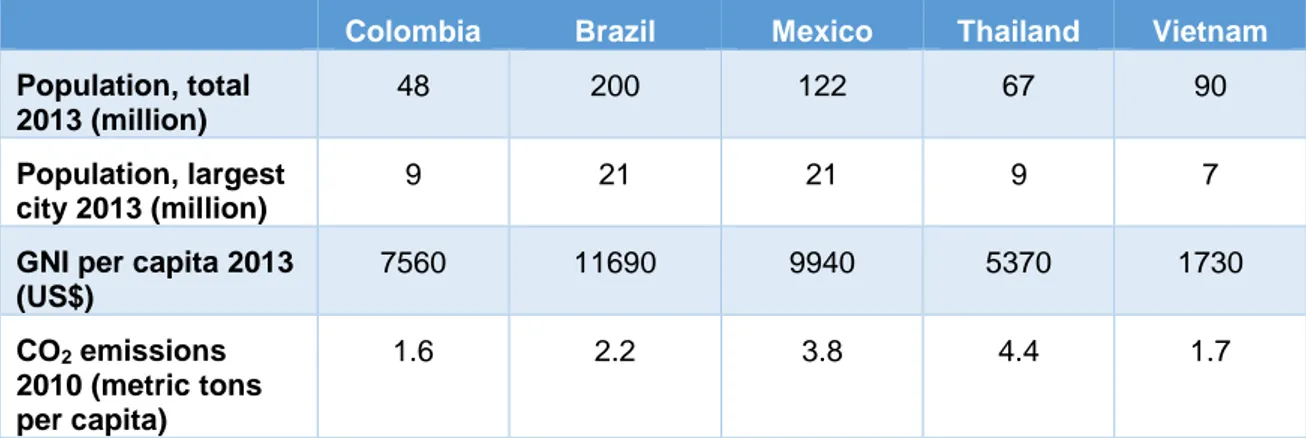
We also gratefully acknowledge help and input from Johan Nylander, Climate Policy and Markets Advisory Sweden, Carlosfelipe Pardo, Despacio, Colombia, Atit Tippichai, King Mongkut's University of Technology Thonburi (KMUTT), Thailand, WRI/EMBARQ Brazil and Mexico, and INTRACO, Vietnam.
Linköping, December 2014
Kerstin Robertson
Quality review
Internal peer review was performed on 3 June 2015 by Rune Karlsson. First author; Kerstin Robertson has made alterations to the final manuscript of the report. The senior research director Tomas
Svensson examined and approved the report for publication on 2 July 2015. The conclusions and recommendations expressed are those of the authors and do not necessarily reflect those of VTI as an authority.
Kvalitetsgranskning
Intern peer review har genomförts 3 juni 2015 av Rune Karlsson. Förste författaren; Kerstin Robertson har genomfört justeringar av slutligt rapportmanus. Forskningsdirektör Tomas Svensson har därefter granskat och godkänt publikationen för publicering 2 juli 2015. De slutsatser och rekommendationer som uttrycks är författarnas egna och speglar inte nödvändigtvis myndigheten VTI:s uppfattning.
Abbreviations used in the text
Abbreviation Term
ACM Approved consolidated methodologies
AM Approved large-scale methodologies
AMS Approved small-scale methodologies
BRT Bus Rapid Transit
CCNUCC Convention-Cadre des Nations Unies sur les Changements Climatiques = UNFCCC
CDE Carbon dioxide equivalent = CO2e
CDM Clean Development Mechanism
CER Certified Emissions Reduction
CH4 Methane
CO2 Carbon dioxide
CO2e Carbon dioxide equivalent = CDE
COP Conference Of the Parties
COP/MOP Conference Of the Parties serving as the Meeting Of the Parties
CTF Clean Technology Fund
CV Coefficient of Variation
DED Deutscher Entwicklungsdienst (German Development Service)
DNA Designated National Authority
DOE Designated Operational Entity
GEF Global Environmental Facility
GHG Greenhouse Gas
GIZ Deutsche Gesellschaft für Internationale Zusammenarbeit
GTZ Deutsche Gesellschaft für Technische Zusammenarbeit
InWEnt Internationale Weiterbildung und Entwicklung gGmbH (Capacity Building International)
IPCC Intergovernmental Panel on Climate Change
LDC Least Developed Countries
LRT Light Rail Transit
LUZ Larger Urban Zone
MDB Multilateral Development Bank
MOP Meeting Of Parties
MRT Mass Rapid Transit
Abbreviation Term
NOS Nitrous oxide, laughing gas = N2O
NTS National Travel Service
PDD Project Design Document
PKM Passenger-kilometre
PoA Programmes of Activities
PT Public Transport
QA/QC Quality Assurance / Quality Control
RE Rebound Effect
SRS (1) Share of Road Space
(2) Simple Random Sampling
UNFCCC United Nations Framework Convention on Climate Change = CCNUCC
Table of contents
Summary ...11
Sammanfattning ...13
1. Introduction ...15
1.1. Background ...15
1.2. Objective and methods ...16
2. International carbon reduction instruments ...18
2.1. Background ...18
2.2. Clean Development Mechanism, CDM ...18
2.3. Global Environment Facility, GEF ...22
2.4. Clean Technology Fund, CTF ...24
2.5. Nationally Appropriate Mitigation Actions, NAMAs ...26
2.6. Summary and conclusions ...28
3. Transport systems ...29
3.1. Transport systems in developing countries ...29
3.2. Reducing CO2 emissions from transport ...30
3.3. Rebound effects ...32
Definition of rebound effects ...33
Rebound effects in the transport sector ...34
Rebound effects in developing countries ...34
3.4. Summary and conclusions ...35
4. Measuring traffic and transportation...36
4.1. Background ...36
4.2. Systems boundaries ...36
4.3. Traffic and transportation data and information in Sweden ...37
Absolute data and information ...38
Sample surveys ...38
Model calculations ...39
4.4. Summary and conclusions ...40
5. Traffic and transportation data availability in developing countries ...41
5.1. Carbon dioxide inventories and reporting ...41
5.2. Vehicle registers, mileage and emissions factors ...42
5.3. Passenger transport data ...45
5.4. Freight transport data ...47
5.5. Summary and conclusions ...48
6. Capacity for greenhouse gas performance tracking in developing countries ...50
6.1. National GHG emissions inventories ...52
6.2. Summary and conclusions ...54
7.5. Methodologies for MRV of CDM transport projects ...58
CDM methodology baselines ...58
CDM transport methodologies ...59
7.6. Methodologies for MRV of GEF transport projects ...60
7.7. Summary and conclusions ...62
8. Discussion and conclusions ...63
References ...67
Appendix 1. Template for transport data/information survey* ...73
Summary
Evaluation of transport interventions in developing countries
by Kerstin Robertson (VTI), Annika K. Jägerbrand (VTI) and Georg F. Tschan (VTI)
International climate policy and the United Nations Framework Convention on Climate Change (UNFCCC) with the Kyoto Protocol include different mechanisms or programmes for actions in developing countries aimed at reducing emissions of carbon dioxide (CO2). To verify compliance, the effects of such actions, including transport measures, need to be measured, reported and verified (MRV).
However, in relation to other sectors very few transport-related projects have been initiated. Potential problems and ambiguities related to the current evaluation methodology were therefore investigated as a possible explanation for the low interest in investments in the transport sector. Other objectives of this study were to analyse the requirements for development and improvement of methods for evaluating the effects of transport policies and measures on emissions of greenhouse gases in developing countries. The analyses included a review of different climate mechanisms, for example applied within the UNFCCC, evaluation requirements and methodologies used, the general availability of methods for evaluation of traffic and transportation, evaluation data availability, and institutional conditions in developing countries. The project applied a highly interdisciplinary perspective based on the fact that transport systems are highly complex. Analyses were based on scientific publications and reports, interviews and data/information collection from five developing countries as case studies. The main conclusions are that measuring traffic and transportation is generally a complex and
demanding process, and the potential for misinterpretation of results is significant. In addition, there is a significant risk of rebound effects, especially for transport projects in developing countries aiming at modal shift. Furthermore, it seems that very short time frames are applied for evaluation of project-based mechanisms in the transport sector. Other challenges relate to institutional roles and
responsibilities, the availability of personal and financial resources, and the knowledge and perspectives applied.
In addition, the Clean Development Mechanism (CDM) programme, for example, has relatively rigorous regulations, with detailed descriptions of project development, implementation and evaluation. Evaluation and delivery of CO2 emissions reductions are also tightly linked to funding. Since transport project types are usually difficult to evaluate, uncertainties with respect to the delivery of CO2 emissions reductions may be important barriers to CDM project initiation and implementation. Data availability and quality are also highly uncertain in the case study countries included in this study, and these results are most likely applicable for other developing countries as well. Furthermore, the fact that regions and households with lower per capita expenditure generally have higher direct rebound effects, due to e.g. a large unmet demand for transportation, makes the application of wider systems perspectives and longer time frames highly relevant. Based on these limitations regarding transport project evaluations, further development of transport-related climate mechanisms towards a more sectoral and transformational perspective is suggested.
Sammanfattning
Utvärdering av transportåtgärder i utvecklingsländer
av Kerstin Robertson (VTI), Annika K. Jägerbrand (VTI) och Georg F. Tschan (VTI)
Den internationella klimatpolitiken och Klimatkonventionen (UNFCCC) med Kyotoprotokollet omfattar olika mekanismer eller program för åtgärder i utvecklingsländer som syftar till att minska utsläppen av koldioxid (CO2). För att kontrollera efterlevnaden behöver effekterna av sådana åtgärder, till exempel transportåtgärder, mätas, rapporteras och verifieras (MRV).
I förhållande till andra sektorer har dock ett mycket litet antal transportprojekt genomförts hittills. Därför har tänkbara problem och oklarheter i samband med de tillämpade metoderna för utvärdering undersökts som en möjlig förklaring till det låga intresset för investeringar inom transportsektorn. Syftet med denna studie var att analysera eventuella behov av utveckling och förbättring av dessa metoder för utvärdering av effekterna av åtgärder inom transportsektorn på utsläpp av växthusgaser i utvecklingsländer. Analyserna inkluderar översikter över: olika klimatmekanismer, tillämpade krav och metoder för utvärdering av transportåtgärder och möjligheter och metoder för utvärdering av trafik och transporter generellt samt utvärdering av tillgång till data och institutionella förhållanden i
utvecklingsländer. Projektet har tillämpat ett tvärvetenskapligt perspektiv baserat på att transportsystemen är mycket komplexa. Analyserna i studien är baserade på vetenskapliga
publikationer och rapporter, intervjuer samt data/informationsinsamling från fem utvecklingsländer som fallstudier.
De viktigaste slutsatserna från denna studie är: att mäta trafik och transporter är generellt sett en komplicerad och krävande process och risken för feltolkning av resultat är betydande. Det finns därför en betydande risk för rekyleffekter, särskilt för transportprojekt i utvecklingsländer som syftar till förändrade färdmedelsval. Dessutom verkar en alltför kort tidsram tillämpas för utvärderingar av projektbaserade mekanismer inom transportsektorn. Andra utmaningar berör institutionella roller och ansvarsområden, tillgång till personal och ekonomiska resurser, samt den kunskap och de perspektiv som tillämpas.
Dessutom har ”Clean Development Mekanism” (CDM)-programmet relativt strikta regler som omfattar detaljerade beskrivningar av projektutveckling, genomförande och utvärdering. Utvärdering och leverans av utsläppsminskningar av CO2 är vidare tätt kopplat till finansieringen. Eftersom effekterna av transportprojekt ofta är svåra att bedöma, kan osäkerheter avseende leveranserna av minskningar av CO2-utsläpp vara viktiga hinder för att CDM-projekt inleds och genomförs.
Datatillgången och datakvaliteten i utvecklingsländer är också mycket osäker i de fallstudieländer som ingick i denna studie. Detta gäller sannolikt även för andra utvecklingsländer. Vidare har det visat sig att länder med lägre ekonomisk omsättning i hushållen generellt sett får högre direkta rekyleffekter av transportåtgärder som till stor del beror på att det finns en stor otillfredsställd efterfrågan på
transporter. Detta gör att det krävs ett bredare systemperspektiv och längre tidsramar både för
genomförande och utvärdering av transportåtgärder. Baserat på dessa begränsningar av möjligheterna att utvärdera transportrelaterade projekt föreslås en vidareutveckling av dessa klimatmekanismer mot ett mer sektoriellt och transformerande perspektiv.
1.
Introduction
1.1.
Background
Transport is a significant contributor to total greenhouse gas (GHG) emissions, generating 25-30% of global energy-related (CO2) emissions (IEA & OECD, 2009; OECD & ITF, 2010). By 2050,
worldwide transport energy use and CO2 emissions are anticipated to increase by nearly 80%
according to the International Energy Agency (IEA) (IEA & OECD, 2009). Some transport activities, such as road haulage, air transport and car ownership, can potentially increase three- or four-fold relative to current levels. Increased transport activities are associated with several serious sustainability problems, e.g. increased dependence on fossil fuels, traffic safety issues, increased environmental and health impacts and congestion problems. Thus, it will be challenging for planners and policymakers to achieve sustainable transport development in the future, especially in
underdeveloped and rapidly growing economies where transport-associated problems are particularly acute (Ribeiro et al., 2007). In addition, sustainable development of the transport sector may contribute to poverty reduction (World Bank, 2006).
It has been estimated that by 2050, freight volumes in non‐OECD countries could increase by four- to five-fold compared with 2000 levels and that passenger mobility could increase from five-fold to more than six‐fold over the same period (OECD, 2011). The rapid urbanisation and sprawl in developing countries puts high pressure on transport systems and the costs of accidents, pollution and congestion are rising (Dalkmann et al., 2011).
The UN Secretary-General’s Five-Year Action Agenda (25 January 2012) includes a number of strategies that aim to mobilise support for global, regional and national building blocks of sustainable development. The aim for the transport building block is to: “Convene aviation, marine, ferry, rail,
road and urban public transport providers, along with Governments and investors, to develop and take action on recommendations for more sustainable transport systems that can address rising congestion and pollution worldwide, particularly in urban areas.” At the World Summit on
Sustainable Development (WSSD) in Johannesburg in 2002, Member States had already agreed to “promote an integrated approach to policymaking at the national, regional and local levels for
transport services and systems to promote sustainable development” (RIO, 2012). The approach
included policies and planning for land use, infrastructure, public transport systems and goods delivery networks, with the aim of increasing energy efficiency, reducing pollution, congestion and adverse health effects, and limiting urban sprawl. So far, however, in relation to other sectors very few transport projects have been initiated (Hayashi & Michaelowa, 2013).
International climate policy, through the United Nations Framework Convention on Climate Change (UNFCCC) and the Kyoto Protocol, include agreements on emissions levels for countries and regions, but also include different mechanisms or programmes for actions in developing countries that will contribute to reduced emissions of greenhouse gases and to sustainable development (Bumpus & Cole, 2010; UNFCCC, 2014a). The Clean Development Mechanism (CDM) and the Global Environment Facility (GEF) are two policy instruments or mechanisms within the UNFCCC which provide incentives for emissions reductions in developing countries (Bakker & Huizenga, 2010; UNFCCC, 2014a). More recently, Nationally Appropriate Mitigation Actions (NAMAs) have been suggested (UNFCCC, 2014b).
To demonstrate reduced carbon dioxide (CO2) emissions and sustainable development, the effects of interventions need to be measured and evaluated. However, there may be a need for further
development of definitions and interpretations of data and for guidelines on estimation and evaluation of transport measures and their application. Transport systems are very complex, which adds to the difficulties in evaluating actions, measures and policies. Depending on the systems limit defined, evaluation may include every geographical scale from local to global and every possible transport mode within the road, rail, sea and air sectors. Even defining the systems limit is complex, since data about local and regional traffic and transport still need to be assigned to traffic and transport generated by vehicles stationed in the area or to total traffic and transportation performed in the area. In addition, there are two main categories of transport – passenger transport and transport of goods. These
subsystems differ in many respects in their composition and design, so in practice there are actually two parallel transport systems that to some extent interact and integrate.
Estimating the effects of interventions (actions, measures, policies, etc.) involves additional
difficulties. First, a baseline (i.e. traffic and transportation before and without the intervention) needs to be defined in order to allow any additionality of the intervention (i.e. an additional effect) to be demonstrated. Baseline definition or setting requires data about traffic and transportation and a projection or a scenario addressing a future situation. Baseline projections may be related to economic growth, but in urban areas decoupling between economic growth and transport may also occur. Furthermore, transport interventions may lead to rebound effects, i.e. secondary effects that counteract the intended primary effects. Measurements, interpretations and evaluations of traffic and
transportation and of the effects of transport interventions therefore require careful definitions of the system under study and the system boundaries.
1.2.
Objective and methods
Measurement, reporting and verification (MRV) is a core requirement for transport interventions in developing countries. Therefore clear definition and understanding of measurement and monitoring is highly important for evaluations. Potential problems and ambiguities related to the current evaluation methodology was therefore investigated as a possible explanation for the low interest in investments in the transport sector. The corresponding aim of this study was to analyse the requirement for
development and improvement of methods for evaluating the effects of transport policies and measures on emissions of greenhouse gases in developing countries. The analyses includes an overview of different climate mechanisms, for example applied within the UNFCCC, evaluation demands and methodologies used, the general availability of methods for evaluation of traffic and transportation, evaluation data availability, and a review of institutional conditions in developing countries.
The analyses presented in this report are based on case studies in a number of developing countries, extensive reviews of relevant literature obtained through literature searches in different databases, including scientific databases, and on interviews with experts in relevant areas. Data/information collection in case studies was based on a template (Appendix 1) and was carried out in collaboration with local experts.
The initial aim of the study needed to be extended during the course of the work since it was clear that a narrow focus on data quality and data availability for measurement and evaluation was not sufficient to develop the understanding of causes of the low interest in transport interventions. Therefore the aim was widened to include a broader systems perspective on data quality and data availability in order to identify requirements for increasing the interest for sustainable traffic and transportation interventions in developing countries.
The report is initiated with an overview of some different international carbon reduction instruments mechanisms and their evaluation requirements in Chapter 2. The transport system concept, including different geographical and temporal perspectives, is elaborated on in Chapter 3, where also the concept
of rebound effects is reviewed and discussed. Different options for measuring and monitoring of traffic and transportation are reviewed in Chapter 4, and data availability in developing countries is evaluated in Chapter 5. The corresponding institutional capacity for greenhouse gas performance tracking is referred in Chapter 6. Finally, the relevance of the currently applied evaluation methods, referred in Chapter 7, are discussed in relation to different systems perspectives, and requirements for further development of evaluation methodology is suggested in Chapter 8.
2.
International carbon reduction instruments
2.1.
Background
There are a number of different types of multilateral climate or carbon reduction instruments applied in international cooperation for promoting sustainable development in developing countries. This chapter provides a brief overview of some available carbon reduction instruments and measures that are relevant for the transport sector, including:
CDM, Clean Development Mechanism1 GEF, Global Environment Facility2 CTF, Clean Technology Fund3
NAMA, Nationally Appropriate Mitigation Actions4.
The focus in this report is on CDM, under which certified emissions reduction credits are possible for projects in developing countries and can be used by industrialised countries to meet their targets under the Kyoto Protocol. The other mechanisms listed are included for reference. None of the instruments focuses exclusively on transport projects, but transport projects are an option in all programmes.
2.2.
Clean Development Mechanism, CDM
The Kyoto Protocol was initiated by the UNFCCC and resulted in binding targets for carbon dioxide emissions for those countries ratifying the protocol (The Kyoto Protocol, 1998). The Kyoto Protocol requires countries to reduce or limit their GHG emissions and it also enables trade of emissions reductions. The Protocol sets binding obligations on many developed countries (Annex I) to reduce their GHG emissions in two commitment periods, 1990-2008/2012 and 2013-2020. Annex I parties must prepare, and submit to the UNFCCC, National Inventory Submissions for monitoring of emissions and targets.
To encourage the private sector and developing countries to contribute to emissions reductions, the Protocol offers means for three market-based mechanisms (Kyoto mechanisms): International
Emissions Trading, CDM and Joint Implementation (JI). The mechanisms aim to stimulate investment and help parties meet targets by cost-effective measures. The CDM arrangements allow developed countries (Annex I parties) to earn certified emissions reduction credits (CER) by investing in project activities that reduce emissions in developing countries5. The CER are each equivalent to one metric ton of CO2. The emissions reduction credits can be included in the binding targets under the Kyoto Protocol for the developed country, but they can also be traded and sold.
The aim of the CDM is to encourage sustainable development and emissions reductions in developing countries, while providing an instrument that is standardised and offers flexibility to meet the binding targets for emissions reductions in developed countries. CDM projects can be performed in various sectors and can be of various sizes6, but the methodology for CDM projects to be accepted comprises similar processes. A key requirement is that the emissions reductions are additional, including real and measureable (Article 12 of the Kyoto Protocol). Additional means that they provide emissions
reductions compared with what would have otherwise occurred, i.e. in the business as usual scenario,
1 https://cdm.unfccc.int/about/index.html 2 http://www.thegef.org/gef/ 3 https://www.climateinvestmentfunds.org/cif/node/2 4 http://unfccc.int/focus/mitigation/items/7172.php 5 http://unfccc.int/kyoto_protocol/mechanisms/clean_development_mechanism/items/2718.php 6 http://www.cdmpipeline.org/cdm-projects-type.htm#1
and that the emissions reductions achieved in the CDM project would not have happened without that project (for further information, see e.g. Schneider, 2011).
The CDM projects must go through a rigorous project cycle and process of validation overseen by the CDM Executive Board. Approval for CDM projects is granted by the Designated National Authority (DNA) and subsequent CER issuance is carried out by the CDM Executive Board. The CDM project cycle consists of the following seven steps7:
1. Project design by the project participant.
2. National approval by the Designated National Authority (DNA). 3. Validation by the Designated Operational Entity (DOE).
4. Registration by the Executive Board. 5. Monitoring by the project participant. 6. Verification by the DOE.
7. CER issuance by the Executive Board.
For each sector and/or size of project, there are specially developed methodologies8, but there are also possibilities to apply for new methodologies to be accepted9. At present, there are 90 different CDM methodologies approved10. The CDM projects in the pipeline (both approved and newly submitted) are listed in the UNFCCC Registry11, while the UNFCCC website provides information and support regarding the flexible mechanisms.
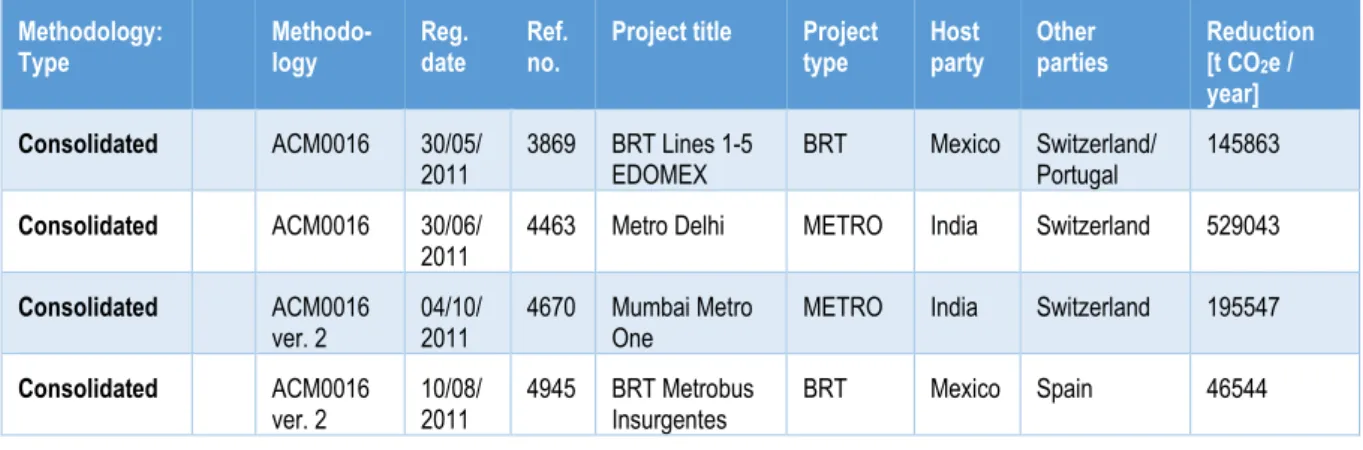
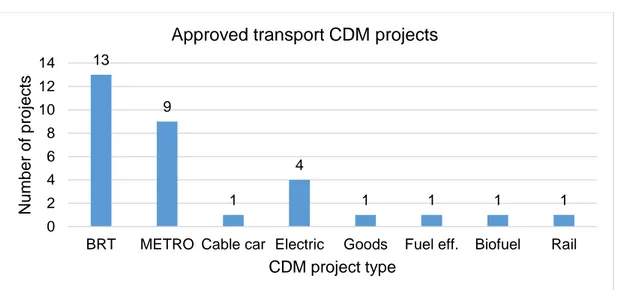
Concerns have been raised about the functioning of the CDM, particularly regarding its support for sustainable development (Olsen, 2007; Bumpus & Cole, 2010), but also regarding uneven regional and sectorial distribution (Bakker et al., 2011). For example, 95% of CDM projects are situated in Asian and Latin American countries, and there are very few CDM projects in the transport and building sectors. There are also concerns regarding the contributions of CDM projects to offsetting global carbon emissions (e.g. Chung, 2007; Schneider, 2009) and the difficulties in showing additionality (Bakker et al., 2011). Out of a current total of 7931 CDM projects (29 Dec 2014), there are only 32 transport CDM projects (0.4%) in the UNFCCC registered project cycle search12 (Table 1, Figure 1), of which 29 have been approved (Figure 1).
Table 1. Registered CDM projects in the transport sector13. Methodology: Type Methodo-logy Reg. date Ref. no.
Project title Project type Host party Other parties Reduction [t CO2e / year] Consolidated ACM0016 30/05/
2011 3869 BRT Lines 1-5 EDOMEX BRT Mexico Switzerland/ Portugal 145863
Consolidated ACM0016 30/06/ 2011
4463 Metro Delhi METRO India Switzerland 529043
Consolidated ACM0016 ver. 2 04/10/ 2011 4670 Mumbai Metro One
METRO India Switzerland 195547
Consolidated ACM0016
ver. 2 10/08/ 2011 4945 BRT Metrobus Insurgentes BRT Mexico Spain 46544
Methodology: Type Methodo-logy Reg. date Ref. no.
Project title Project type Host party Other parties Reduction [t CO2e / year] Consolidated ACM0016 ver. 2 12/09/ 2012 5735 Metro Line 12, Mexico City
METRO Mexico Switzerland 136983
Consolidated ACM0016
ver. 2 22/11/ 2012 6430 Mode shift of passengers to MRTS for Gurgaon metro
METRO India Switzerland 105863
Consolidated ACM0016
ver. 2 Rejected 6814 Busan Metro Line 1 Dadae METRO Republic of Korea
10619
Consolidated ACM0016
ver. 2 Rejected 6818 Daegu Metro 3th Urban Railroad METRO Republ ic of Korea Switzerland 60350 Consolidated ACM0016 ver. 2 Reject ed 6820 Incheon Metro Line 2 METRO Republ ic of Korea Switzerland 48064 Consolidated ACM0016 ver. 3 24/09/ 2012 7235 BRT Metrobus 2-13 BRT Mexico Switzerland 134601 Consolidated ACM0016 ver. 3 19/12/ 2012 7574 LRT System in Tunis Rail Tunisia 29193 Consolidated ACM0016
ver. 3 25/02/ 2013 8149 Guiyang MRTS Line I Project METRO China 335188
Large-scale AM0031 07/12/
2006 672 BRT Bogotá: TransMilenio Phase II-IV
BRT Colom
bia Switzerland/ Netherlands 246563
Large-scale AM0031
ver. 3 19/10/ 2010 3760 BRT Chongqing Lines 1-4, China BRT China Switzerland/ Germany 218067 Large-scale AM0031 ver. 3 07/06/ 2011 4744 BRT Zhengzhou, China BRT China Switzerland/ Portugal 204715 Large-scale AM0031 ver. 3 10/02/ 2012 5437 BRT Macrobus Guadalajara BRT Mexico Spain 54365 Large-scale AM0031 ver. 3 16/12/ 2011 5513 BRT Transmetro Barranquilla BRT Colom bia Spain 55828 Large-scale AM0031 ver. 3 13/03/ 2012 5618 BRT Metroplus Medellin BRT Colom bia Switzerland 123479 Large-scale AM0031 ver. 3 12/03/ 2012
5852 MIO Cali BRT Colom bia
Netherlands 242187
Large-scale AM0031
ver. 3 10/08/2012 6351 MEGABUS, Pereira BRT Colombia Netherlands 33956
Large Scale AM0031 ver. 3 03/07/ 2012 6455 BRT in Guatemala City BRT Guate-mala 536148 Large-scale AM0031 ver. 3 23/07/ 2012 6796 Lanzhou Bus Rapid Transit (BRT) BRT China Sweden 12621 Small-scale AMS-III.AQ./ AMS-II.AO. 31/01/ 2013 8358 Demo. Project; Biogas from organic waste, Anyang City
Biofuel China UK, Northern Ireland
Methodology: Type Methodo-logy Reg. date Ref. no.
Project title Project type Host party Other parties Reduction [t CO2e / year] Small-scale AMS-III.AT. ver. 2 28/09/ 2012 7455 Nittsu fuel efficiency for freight transport
Fuel eff. Malays ia Japan 239 Small-scale AMS-III.C. ver. 10 29/12/ 2007 1351 Low GHG emitting rolling stock
METRO India Japan 41160
Small-scale AMS-III.C.
ver. 11 04/02/2011 4066 Modal shift to rail transport Goods India 23001
Small-scale AMS-III.C.
ver. 13 02/11/2012 6708 Lohia Auto Ind. electric vehicles Electric India Switzerland 25518
Small-scale AMS-III.C. ver. 13 27/09/ 2012 6711 Hero electric vehicles
Electric India Switzerland 37647
Small-scale AMS-III.C. ver. 13 02/11/ 2012 6712 Electrotherm electric vehicles
Electric India Switzerland 36175
Small-scale AMS-III.C.
ver. 13 27/09/2012 6713 EKO electric vehicles Electric India Switzerland 24563
Small Scale AMS-III.T. 17/12/
2010 3291 Plant-oil production for use in vehicles
Biofuel
Para-guay Switzerland 17188
Small-scale AMS-III.U. 26/04/
2010 3224 Cable car metro Medellín Cable car Colombia Switzerland 17290 The uneven distribution of projects and countries that has been identified by others (see above) can also be seen in Table 1 and Figure 1:
1. There are some very dominant project types (BRT, MRT), whereas some, e.g. promotion of walking and cycling are absent and several methodologies have not been covered in proposed projects (Table 1; Figure 1).
2. There are also some very dominant host countries (India, Colombia, Mexico) among a total of only nine host countries and one dominant supporting country (Switzerland) among a total of only eight supporting countries (denoted ‘Host party’ and ‘Other party’ in Table 1).
The causes of this uneven distribution are not further analysed in this report.
The low number of transport CDM projects is suggested to be a side-effect of the strict requirements of the CDM methodologies and the fact that the requirements do not suit the transport sector. For transport projects, for example, it is very difficult to establish a realistic baseline for a CDM project, since transport operates in complex environments and consists of many small mobile emissions sources that are highly challenging to calculate, measure or estimate (Eichhorst et al., 2010). One consequence of this is that it may be difficult to demonstrate additionality, which is a requirement of CDM projects. In some cases therefore, UNFCCC methodologies use standardised indicators if there is a lack of data for the project. These uncertainties may be important barriers to CDM project implementation, since funding of the projects is tightly linked to the delivery of CO2 emissions reductions.
Figure 1. Summary of approved transport CDM projects: project types and number of projects of each type in the UNFCCC CDM registry database.
Improvements to the conditions for transport CDMs have been suggested, for example simplifying the methodologies, modifying the requirement on demonstrating additionality and reducing the amount of data needed for approval of CDM projects (Bakker & Huizenga, 2010). It might also be possible to develop the CDM methodology so as to allow transport projects with a more broad design or application (such as a sectoral approach) to be created and to view transport as a system, instead of only dealing with limited parts. Adopting a sectoral approach for transport CDM would allow scaling up of activities and would perhaps be in better agreement with sustainable development (Wittneben et al., 2009). The CDM transport methodologies are further discussed and analysed in Chapter 6 of this report.
It is also possible to register coordinated implementation of a policy, measure or goal that leads to emissions reductions in the programme of activities (PoA) within the CDM14. The CDM
methodologies and project standard, procedure, additionality and verification must still be applied, but the PoA provides possibilities for co-ordinated efforts to be made and offers an unlimited number of component project activities (CPA). There are many benefits of PoAs15, but since the CDM
methodology must be used for the broad approach of the PoA, it may be difficult to fulfil the requirements on data availability and quality.
2.3.
Global Environment Facility, GEF
Global Environment Facility (GEF) was established in 1991 and helps developing countries finance activities that protect the global environment. GEF addresses global environmental issues by serving as a financial mechanism for several conventions, including the Convention on Biological Diversity (CBD), the UNFCCC, the Stockholm Convention on Persistent Organic Pollutants (POPs), the UN Convention to Combat Desertification (UNCCD) and the Minamata Convention on Mercury. It also supports the implementation of the Montreal Protocol (MP) on Substances That Deplete the Ozone Layer (MP) for countries with economies in transition (GEF, 2014b). GEF serves as a partnership for collaboration with institutions, organisations and the private sector and provides funding in grants. GEF partner agencies are listed in .
14 http://cdm.unfccc.int/ProgrammeOfActivities/index.html 15 http://cdm.unfccc.int/ProgrammeOfActivities/index.html 13 9 1 4 1 1 1 1 0 2 4 6 8 10 12 14
BRT METRO Cable car Electric Goods Fuel eff. Biofuel Rail
N umber of proj ects CDM project type
Table 2. List of GEF partner agencies.
GEF Partner Agencies
Asian Development Bank (ADB) African Development Bank (AfDB) Conservation International (CI)
Development Bank of Southern Africa (DBSA)
European Bank for Reconstruction and Development (EBRD)
Food and Agriculture Organizaton of the United Nations (FAO)
Inter-American Development Bank (IADB) International Fund for Agricultural
Development (IFAD)
International Union for Conservation of Nature (IUCN)
United Nations Development Programme (UNDP)
United Nations Environment Programme (UNEP)
United Nations Industrial Development Organization (UNIDO)
The World Bank Group
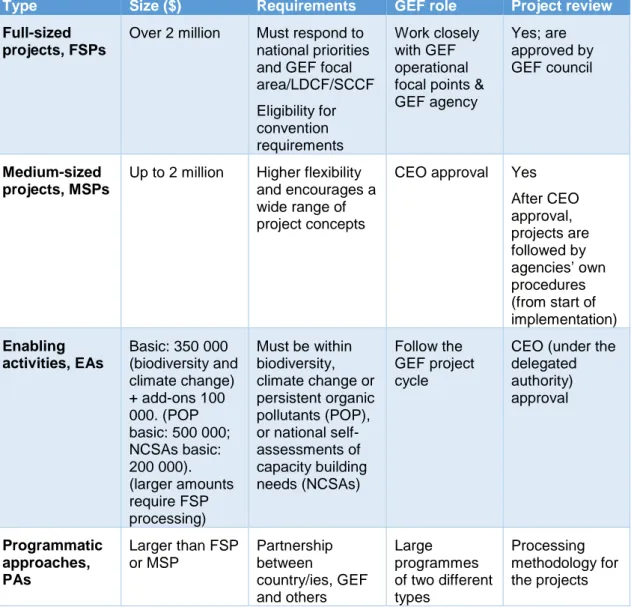
GEF provides funding in four different project types (GEF, 2014c): Full-sized Projects (FSPs), Medium-sized Projects (MSPs), Enabling Activities (EAs) and Programmatic Approaches (PAs). These different project types and their GEF requirements are shown in .
In addition, projects falling under the area of adaptation of climate change can also apply for funds from the Special Climate Change Fund (SCCF), the Least Developed Countries Fund (LDCF) and the Adaptation Fund (GEF, 2014c). The GEF corporate programme (SGP) is funded by GEF but
implemented by the United Nations Development Programme (UNDP) and executed by the United Nations Office for Project Services (UNOPS).
Regarding transport projects, GEF has the possibility to fund these within the UNFCCC and by July 2012 it had funded 50 urban transport projects (GEF, 2013). GEF also has a programme aimed at creation of sustainable cities, where transport will play an important role (GEF, 2014d). In total, about 800 projects have received funding through the GEF programme. GEF project financing takes place before the project is implemented, and GEF funding is not revoked if emissions targets are not reached (ITDP, 2014). GEF projects are less rigorous and riskier but also more flexible, in that it is possible to support many different kinds of transport project types.
Table 3. The different GEF project types and their requirements (GEF, 2014c).
Type Size ($) Requirements GEF role Project review Full-sized
projects, FSPs
Over 2 million Must respond to
national priorities and GEF focal area/LDCF/SCCF Eligibility for convention requirements Work closely with GEF operational focal points & GEF agency Yes; are approved by GEF council Medium-sized projects, MSPs
Up to 2 million Higher flexibility
and encourages a wide range of project concepts
CEO approval Yes
After CEO approval, projects are followed by agencies’ own procedures (from start of implementation) Enabling activities, EAs Basic: 350 000 (biodiversity and climate change) + add-ons 100 000. (POP basic: 500 000; NCSAs basic: 200 000). (larger amounts require FSP processing) Must be within biodiversity, climate change or persistent organic pollutants (POP), or national self-assessments of capacity building needs (NCSAs) Follow the GEF project cycle
CEO (under the delegated authority) approval Programmatic approaches, PAs Larger than FSP or MSP Partnership between country/ies, GEF and others Large programmes of two different types Processing methodology for the projects
GEF transport projects are grouped into three categories: technology solutions, urban transport systems and integrated urban systems (ITDP, 2013). Technology solutions focus on the energy efficiency of engines and motor fuels, while urban transport systems focus on transportation systems with the aim of reducing travel in single-occupancy vehicles and increasing lower-carbon modes of travelling (e.g. by PT and non-motorised transport (NMT)). The urban transport system is the most dominant category of transport GEF projects. The integrated urban system has four components; green buildings, low carbon components, green transport and green energy schemes (ITDP, 2013).
Until 2005, GEF transport projects were dominated by those of a mixed character (55%), hydrogen vehicles (22%), and BRT/NMT. There was then a slight change in direction, so that in 2009 the most dominant GEF transport project types were BRT, NMT (29% each), travel demand management (TDM) (8%), engine technology (6%) and others (ITDP, 2013). For further details on funded GEF transport projects, see ITDP (2013).
2.4.
Clean Technology Fund, CTF
Clean Technology Fund (CTF) is one of four key programmes in Climate Investment Funds (CIF). The other programmes are: Forest Investment Program, Scaling Up Renewable Energy Program, and
Pilot Program Climate Resilience. CIF helps 63 developing countries with the challenges of climate change and GHG emissions reductions. CIF has financial resources from contributor countries and is also financed through external resources (private or government).
There are three main principles for CIF projects; delivering investment to stimulate transformation, fostering partnership through a programmatic approach and learning by doing to achieve results (CIF, 201416). Delivering investment to stimulate transformation involves partnership with multilateral development banks (MDBs), co-financing with MDB and also co-financing with the private sector. Fostering partnership through a programmatic approach involves country-led approaches with multiple stakeholders to develop and implement investment plans based on policies and initiatives. Learning by doing to achieve results is a way to use previous findings on what works in order to improve results, scale up implementation and replicate successful projects or programmes.
CTF was established in 2008 and is the main programme that contains transport projects, but besides sustainable transport also has other types of projects, such as low carbon technologies, renewable energy and energy efficiencies. The programme provides funding for developing and middle income countries for “demonstration, deployment and transfer of low carbon technologies with significant
potential for long-term greenhouse gas emissions savings”17.
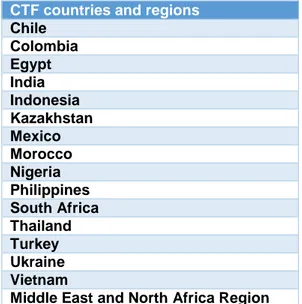
The CTF has 134 projects and programmes amounting to $6.1 billion in its pipeline and expected co-financing of $51 billion from other sources (December 2014).17 Financing has been approved for 70 projects to deliver 16.6 GW of renewable energy capacity, and the projects are anticipated to result in 1.7 billion tons of CO2 reductions (during their life cycle). CTF differs from other multilateral climate instruments in that it focuses on larger transactions in a few countries or regions, see Table
Table 4. Countries and regions included in CTF.
CTF countries and regions Chile Colombia Egypt India Indonesia Kazakhstan Mexico Morocco Nigeria Philippines South Africa Thailand Turkey Ukraine Vietnam
Middle East and North Africa Region
CTF encourages participation from the private sector, but also aims to decrease technology costs and to catalyse change that can be replicated. In 2013, CTF started the Dedicated Private Sector Programs (DPSP) to reduce barriers to private financing and to generate financing for projects and operations
whereby MDBs collaboratively find private sector funding openings. The DSPS have six thematic areas: geothermal power, mini-grids, mezzanine finance, energy efficiency, solar photovoltaic power and early stage renewable energy19.
CTF funds projects within the areas of renewable energy, sustainable transport and energy efficiency, see Table 5. Areas and project types within CTF funding.
Table 5. Areas and project types within CTF funding.
Area Project types
Renewable energy Concentrating solar power, solar
photovoltaic, geothermal, wind, small hydro Sustainable transport Bus rapid transit, public transport,
high-efficiency vehicles, modal shifts
Energy efficiency Industry, building, district heating, municipal, lighting, appliances
CTF projects, and funding agents, within the transport area include:
Market transformation through introduction of an energy-efficient electric vehicle project for the Philippines: Government of the Philippines and the Asian Development Bank (ADB) Cebu bus rapid transit project in the Philippines: Government of the Philippines and the
International Bank for Reconstruction and Development (IBRD)
Nigeria urban transport project: Abuja Mass Transit, Government of Nigeria and AfDB (Africa Development Bank)
Technological transformation programme for Bogota´s integrated public transportation system: Government of Colombia and Inter-American Development Bank (IDB).
CTF projects are evaluated through standard ex-poste evaluations and some projects also have built-in impact evaluations, for example as specified by the MDBs. CTF aims to include evidence-based evaluation approaches into the project cycle, although ex-poste evaluations in terms of core indicators for the projects have been in use since 201320. The core indicators for transport projects consist of calculations of tons of CO2 equivalents avoided or reduced per year, number of passengers (as a result of CTF), annual energy savings (as a result of CTF intervention) and development indicators.
2.5.
Nationally Appropriate Mitigation Actions, NAMAs
Nationally Appropriate Mitigation Actions (NAMAs) have been discussed and referred to in the meetings of the UNCCC in Bali, Copenhagen and Doha.21 NAMAs include any action to decrease GHG emissions (in relation to business-as-usual emissions in 2020) and are organised by a national governmental initiative21. NAMAs can be policies or can have a national focus, making them broader in their scope, but must be “nationally appropriate”. The NAMA framework is intended to help increase the demand for public policies and public sector investment, as well as strongly encouraging private sector investment (Cheng, 2010).
NAMAs are separated into two groups: 1. At the National Level
Parties (countries) are invited to communicate their NAMAs by a formal submission declaring an intent to mitigate GHG emissions. The mitigation of GHG emissions is performed in accordance with the capacity of these countries and with national development goals.
19 https://www.climateinvestmentfunds.org/cif/content/ctf-dedicated-private-sector-programs
20 https://www.climateinvestmentfunds.org/cif/measuring-results/evaluation
2. Individual Action Level
NAMAs at the individual action level will help countries to meet their mitigation objectives and are diverse, from sectoral programmes or policies to project-based actions in stages of preparation or implementation. Again, the NAMAs are intended to take place within the context of development goals. Individual action-level NAMAs can be registered in the NAMA Registry22.
There have been previous discussions on how to formalise the design of NAMAs and it has been suggested that they be divided into three basic effort-sharing arrangements (Linnér & Pahuja, 2012): binding commitments for all; voluntary commitments for all; or partly binding commitments (binding commitments for Annex I parties and voluntary commitments for others).
The methods for evaluation of NAMAs, NAMA MRV and NAMA guidelines are still under discussion. The supported NAMAs will eventually be subject to international MRV. Nevertheless, countries can register NAMAs in a database (UNFCCC registry22) and seek international support according to sessions 16 and 17 at the Conference of Parties (COP). The database and its prototype were presented in 201223. There is also an Ecofys NAMA database24 that registers NAMAs being developed worldwide and contributes information and makes data available in an open standard format to promote collaboration and knowledge transfer.
The NAMA database included 118 NAMAs in 2014, but only seven were under implementation (van Tilburg et al., 2014). The annual status report on nationally appropriate mitigation actions (NAMAs) for 2014 noted increasing NAMA activity, but also found that finance for implementation is too slow and identified a great need for different improvements in NAMAs. For example, the monitoring of NAMAs, as well as reporting and verification of NAMAs, needs more detailed guidelines, some of which are already planned. Furthermore, more pragmatic MRV processes for NAMAs are being discussed, to enable flexible metrics of GHG emissions and reductions. The particular need for developing countries to develop capacity for MRV processes and systems is also mentioned. The transport sector has been identified as being particularly interesting for NAMA initiatives. As of January 2014, the transport sector had the second highest number of NAMA activities of all economic sectors (Binsted et al., 2014). There is a special transport NAMA database within the Ecofys database and its prototype was launched in October 2013. As stated above, the main aim or key element of the transport NAMAs is to reduce GHG emissions, but the relevance of “wider benefits” or co-benefits has also been raised and discussed, since these may help achieve the UNFCCC aim of sustainable development (Binsted et al., 2012). Such co-benefits include economic development, improved quality of life and lower environmental impact.
Transport NAMAs have four basic building blocks (GIZ, 2014): 1. Designing mitigation measures.
2. Measuring, reporting and verification. 3. Financing.
4. Registration.
These four elements can also be intermixed in cross-sectional approaches. A typical feature of all NAMAs is the national appropriateness, giving rise to NAMAs of different size, scope and scale. Thus, NAMAs can be tailor-made development processes and each NAMA process can be different. However, due to the individual processes of NAMAs and their national appropriateness at the national level, there seems to be a current lack of practical information on the MRV process in the
2.6.
Summary and conclusions
A number of different types of multilateral climate or carbon reduction instruments are applied in international co-operations promoting sustainable development in developing countries, for example Clean Development Mechanism (CDM), Global Environment Facility (GEF), Clean Technology Fund (CTF) and Nationally Appropriate Mitigation Actions (NAMAs). This comparison showed that there are many similarities between these programmes, e.g. they largely address the same or similar areas. However, there are also some differences with respect to the regulation of project development, evaluation and funding schemes. The CDM programme has the most rigorous regulations, with detailed descriptions of project development, implementation and evaluation. Evaluation and delivery of CO2 emissions reductions are also tightly linked to funding. Since transport project types usually are difficult to evaluate, uncertainties with respect to the delivery of CO2 emissions reductions may be important barriers to CDM project initiation and implementation.
The GEF, CTF and NAMA programmes have less rigorous CO2 emissions evaluation demands, and also provide funding through grants. This is one possible explanation why transport projects are more frequent in these programmes.
3.
Transport systems
The term ‘transport system’ is used in in this report to denote all different components related to transport, i.e. infrastructure, vehicles (traffic), passengers and goods (freight haulage). Transport systems can further be classified and defined in relation to a larger physical, economic and social system.
3.1.
Transport systems in developing countries
Developing countries are defined according to their Gross National Income (GNI) per capita and year25. According to the World Bank (2013)25, countries with a GNI of US$ 11,905 and less are defined as developing. Low GNI is usually accompanied by a varying proportion of poverty and a wide income gap.
The transport system in developing countries may vary widely with respect to both the availability and the quality of e.g. road and railroad infrastructure and traffic, but both the availability and the quality are usually much lower than in developed or industrialised countries. The current state of the transport system may for example be explained by population growth and income/motorisation rates, but is also dependent on political history (Gwilliams, 2003). For example, rich countries have high motorisation rates but can also afford mass rapid transport (MRT) systems, while poor countries with fast
population growth are less likely to have MRT systems. Generally, large, dense cities, such as
megacities, have high levels of congestion and severe environmental impacts. Developing cities differ from industrialised/developed cities in terms of four main characteristics; premature congestion, a deteriorating environment, low safety and security, and declining transport for the poor (Gwilliams, 2003).
While development of the transport system is usually defined as a key factor for further economic development, the best strategy may not necessarily be to follow in the path of developed/industrialised countries, at least not regarding urban transport. While many other conditions improve with economic growth, urban transport has proven to be a challenge from the environmental, social and economic sustainability perspectives. The situation in many cities in developing countries can be illustrated with the following quote26: “Traffic jams; polluted air; dangerous roads; funding crises; absence of parks,
walkways and public spaces; spiraling car and motorcycle use; ever-greater burdens on the poor; and less livable cities: these are all increasingly familiar to people living in developing cities. Moreover, these problems are getting worse, rather than better, with economic development.”
While economic growth as such may lead to improved quality of life in some respects, other aspects may need a more people-centred planning perspective in order to be identified and prioritised in urban planning. High quality sidewalks and pedestrian streets, plazas and parks may be crucial for the development of local communities and social harmony (GIZ SUTP, 2010). In general, it is important that planning and development is based on wide perspectives and a sound understanding of
requirements and conditions in every specific city, whether it is located in a developing or industrialised country.
The characteristics of cities and urban transport in developing countries may of course also be very variable, but there are some general characteristics that may differ from cities in industrialised countries (GIZ, 2004; GIZ SUTP, 2010; Santos et al., 2010; Cervero, 2011; Cervero, 2013; GEF, 2013):
Rapid population growth and dense population
“Sprawl” due to unregulated growth of informal settlements
Transport infrastructure for such informal settlements is usually very limited, resulting in people living in such areas either having difficulties travelling and/or having to spend a comparatively large part of their income on daily travel.
Unregulated collective-ride services provided by informal transport operators make up a large fraction of the “public transport”
Infrastructure for walking and cycling is often lacking and the use of motorised transport is high even for short journeys, which leads to unnecessarily high travel costs for poor people Poorly designed road networks and spatial mismatches between housing and jobs.
3.2.
Reducing CO
2emissions from transport
Decoupling the expected growth in global transportation from the corresponding increase in GHG emissions is one challenge for the international community, as is decoupling transport from economic growth (GEF, 2013). An overview of different types and categories of traditional interventions (measures, activities, policies) to promote reduced emissions of CO2 from transport is presented below. CO2 efficiency is one aspect of a sustainable transport system in accordance with e.g. the definition by CST (2005), which states that a sustainable transport system:
Allows the basic access needs of individuals and societies to be met safely and in a manner consistent with human and ecosystem health, and with equity within and between generations Is affordable, operates efficiently, offers choice of transport mode and supports a vibrant
economy.
Limits emissions and waste within the planet’s ability to absorb these, minimises consumption of non-renewable resources, limits consumption of renewable resources to the sustainable yield level, reuses and recycles its components, and minimises the use of land and the production of noise.
Some examples of policies and measures in local and regional use for reducing negative effects in the transport system, such as congestion and environmental effects, and for improving sustainability are: promotion of public transport (PT) and bicycle use, use of alternative fuels and/or vehicles, regulations and economic instruments, and infrastructure development.
Furthermore, the focus has recently shifted from moving goods and people to ensuring access to goods and services, as exemplified by the Avoid‐Shift‐Improve (ASI) approach (Dalkmann & Brannigan, 2007; RIO, 2012; IEA, 2013), which aims to:
Avoid the need for unnecessary travel by providing improved access to goods and services, for example by integration of land use and transport policies
Shift travel to the most efficient mode, which in most cases will be either non‐motorised or public transport for passenger transport, and to rail or water transport for freight
Improve existing forms of transport through technological improvements to make engines and fuels less carbon intensive.
Therefore, the concept of transport policy and measures also needs to be addressed, since there are different types of policies and measures that may affect the transport system. Policies and measures “within” the transport sector with the objective of changing and improving transport infrastructure and the conditions for transportation with different modes are commonly expected to result in changes in the transport system. However, there are many additional planning sectors within urban and regional planning that may have an influence over land use and therefore also indirectly over the transport sector and the transport system (see e.g. Robertson et al., 2013).
In this report, however, the main focus is on transport sector policies and measures, i.e. “Shift” and “Improve”, since in practice these are still in many cases the dominant measures applied to improve transport sustainability in cities. Some common Transport Demand Management (TDM) strategies aiming to reduce energy consumption and pollutant emissions from passenger and freight transport (Santos et al., 2010; Litman, 2014) are presented in Table 6. The inter-sectoral perspective, i.e. “Avoid”, is raised again in the discussion in Chapter 8. Possible and potential rebound effects of different policies and measures are discussed in Section 3.3.
Table 6. Examples of policies and measures applied to improve energy efficiency and to reduce emissions from transport.
Passenger traffic and transportation
Freight traffic and transportation Distance-based emission
fees
Gives motorists with higher polluting vehicles a greater incentive to reduce their mileage and, conversely, gives motorists who drive high mileage a greater incentive to choose low polluting vehicles.
Fuel tax increases and carbon taxes
Raising fuel price has two effects, it causes modest reductions in vehicle mileage, and over the long term encourages
motorists to choose more fuel-efficient vehicles Road pricing Examples of road pricing are toll roads and congestion
charges Freight transport
management
For example improved scheduling and routing. Non-motorised
transportation improvements and encouragement
Cycling and walking can be particularly effective for energy efficiency and emissi-ons reductiemissi-ons by reducing short motor vehicle trips Transit improvements and
incentives
A variety of strategies can encourage transit use, inclu-ding increased service, more convenient and comfortable service, transit priority traffic management, lower fares, improved marketing, commu-ter incentives (such as employee transit benefits), improved pedestrian and bicycle access to transit stops.
Ridesharing and high occupancy vehicle (HOV) priority
High Occupancy Vehicles (HOVs) include carpools, vanpools and transit vehicles. Parking management and
parking pricing
Are effective ways to reduce automobile travel.
As indicated above, for a number of years there has been growing consensus that developing infrastructure for motorised transport will lead to increased travel in any city (GTZ, 2004; Litman, 2014). Therefore, increased accessibility to road infrastructure and increased speed of travel may even reduce accessibility to destinations in the long run. Another consequence may be increasing travel distances, which may be referred to as a rebound effect (see further below).
Consequently, the spatial structure of urban areas, for example the density and mix of use and the spatial distribution of residential, work, shopping and leisure areas, will have a significant effect on the need for travel and travel distances (IEA, 2013; UN-Habitat, 2013). Trip generation is highly related to land use, as is modal choice, i.e. the choice to travel by e.g. car, public transport or a non-motorised mode (Robertson et al., 2013). Other relevant factors are the attractiveness of different transport modes and neighbourhood qualities.
Alleviating poverty is another complex and urgent requirement in any form of sustainable
development including sustainable transport, especially in developing countries. According to Starkey & Hine (2014), there is evidence of significant benefits to e.g. agricultural production, public health, education and poverty alleviation from improving rural access, although no clear statistics are available. On the other hand, while rural road construction can directly benefit poor communities, urban transport development (such as new roads, metros, BRT) is primarily designed to reduce urban congestion caused by car use. The urban poor may benefit from transport investment, but they may also to a relatively high degree experience adverse effects from resettlement caused by road construction, as well as traffic-related pollution.
According to Bräuninger et al. (2012), policies and measures work differently in developed and developing countries. As an example, “Avoid” strategies can be more successful in developing countries, whereas in developed countries “Shift” strategies may be more relevant, since car use is already widespread. Furthermore, low income countries may endure financial restrictions and a lack of resources. Some examples of different city characteristics that may need different strategies for
developing sustainable traffic and transportation according to Bräuninger et al. (2012) are presented in Table 7.
Table 7. Examples of city typologies that may require different strategies for development of sustainable traffic and transportation (as suggested by Bräuninger et al., 2012).
City typology Example
Walking/Non-motorised cities Shanghai in the 1980s
Motorcycle cities HaNoi
Traffic-saturated motorcycle cities Ho Chi Minh
Walking/Bus/Transit cities Seoul, Manila in the 1970s Traffic-saturated Bus/Transit cities Bangkok, Jakarta, Manila
Transit cities Hong Kong, Seoul, Singapore
Car cities Houston
3.3.
Rebound effects
Reducing GHG emissions or energy consumption within the transport sector is associated with achieving higher energy efficiency, reduced transport demand, changed transport habits or transport modality. Such transport changes will in general lead to lower energy consumption when other variables are kept constant and are therefore calculated to yield lower GHG emissions, for example in CDM or GEF projects. Unfortunately, measures, subsidies or policies implemented to reduce energy