Performance Monitoring, Analysis, and Real-Time
Introspection on Large-Scale Parallel Systems
XAVIER AGUILAR FRUTO
Doctoral Thesis
Stockholm, Sweden 2020
TRITA-EECS-AVL-2020:1 ISBN 978-91-7873-354-5
SE-100 44 Stockholm SWEDEN Akademisk avhandling som med tillstånd av Kungl Tekniska högskolan framlägges till offentlig granskning för avläggande av teknologie doktorsexamen i datalogi tors-dagen den 9 januari 2020 klockan 10.00 i F3, Sing–Sing, Kungl Tekniska högskolan, Lindstedtsvägen 26, Stockholm.
© Xavier Aguilar Fruto, January 2020 Tryck: Universitetsservice US AB
iii
Abstract
High-Performance Computing (HPC) has become an important scientific driver. A wide variety of research ranging for example from drug design to climate modelling is nowadays performed in HPC systems. Furthermore, the tremendous computer power of such HPC systems allows scientists to simulate problems that were unimaginable a few years ago. However, the continuous increase in size and complexity of HPC systems is turning the development of efficient parallel software into a difficult task. Therefore, the use of per-formance monitoring and analysis is a must in order to unveil inefficiencies in parallel software. Nevertheless, performance tools also face challenges as a result of the size of HPC systems, for example, coping with huge amounts of performance data generated.
In this thesis, we propose a new model for performance characterisation of MPI applications that tackles the challenge of big performance data sets. Our approach uses Event Flow Graphs to balance the scalability of profiling techniques (generating performance reports with aggregated metrics) with the richness of information of tracing methods (generating files with sequences of time-stamped events). In other words, graphs allow to encode ordered se-quences of events without storing the whole sequence of such events, and therefore, they need much less memory and disk space, and are more scal-able. We demonstrate in this thesis how our Event Flow Graph model can be used as a trace compression method. Furthermore, we propose a method to automatically detect the structure of MPI applications using our Event
Flow Graphs. This knowledge can afterwards be used to collect performance
data in a smarter way, reducing for example the amount of redundant data collected. Finally, we demonstrate that our graphs can be used beyond trace compression and automatic analysis of performance data. We propose a new methodology to use Event Flow Graphs in the task of visual performance data exploration.
In addition to the Event Flow Graph model, we also explore in this thesis the design and use of performance data introspection frameworks. Future HPC systems will be very dynamic environments providing extreme levels of parallelism, but with energy constraints, considerable resource sharing, and heterogeneous hardware. Thus, the use of real-time performance data to or-chestrate program execution in such a complex and dynamic environment will be a necessity. This thesis presents two different performance data introspec-tion frameworks that we have implemented. These introspecintrospec-tion frameworks are easy to use, and provide performance data in real time with very low overhead. We demonstrate, among other things, how our approach can be used to reduce in real time the energy consumed by the system.
The approaches proposed in this thesis have been validated in different HPC systems using multiple scientific kernels as well as real scientific applica-tions. The experiments show that our approaches in performance character-isation and performance data introspection are not intrusive at all, and can be a valuable contribution to help in the performance monitoring of future HPC systems.
v
Sammanfattning
HPC (högpresterande datorer) har idag blivit ett nödvändigt verktyg för stora forskningsprojekt inom olika områden såsom läkemedelsdesign, klimat-modellering mm. Den enorma datorkraften hos HPC-system har dessutom gjort det möjligt för forskare att simulera problem som var otänkbara för en-dast några år sedan. Det finns dock ett problem. Den ökande komplexiteten hos HPC-system medför att utvecklingen av effektiv mjukvara kapabel att ut-nyttja dessa resurser blir utmanande. Användningen av prestandaövervakning och mjukvaruanalys måste därför spela en viktig roll för att avslöja prestand-aproblem i parallella system. Utveckling av prestandaverktyg står dock också inför liknande utmaningar och måste kunna hantera allt växande mängder genererade data.
I denna avhandling föreslår vi en ny modell för prestandakaraktärisering av MPI applikationer för att försöka lösa problemet med stora datamängder. Vår metod använder sig av “Event Flow” grafer för att balansera mellan skal-barheten av profileringsmetoder, dvs prestandadata av aggregerade mätvär-den, med informationen från spårningsmetoder, dvs filer med tidsstämplade händelser. Dessa grafer tillåter oss att koda händelserna och därmed minskar behovet av lagring, vilket leder till utnyttjande av mycket mindre minne och diskutrymme, och slutligen till ökad skalbarhet. Vi demonstrerar även i denna avhandling hur vår “Event Flow” grafmodell kan användas för spårkompri-mering. Dessutom föreslår vi en ny metod som använder “Event Flow” grafer för att automatiskt undersöka strukturen hos MPI-applikationer. Denna kun-skap kan i efterhand användas för att samla in prestandadata på ett smartare sätt och minskar mängden redundanta data som samlas in. Slutligen visar vi att våra grafer kan användas inom andra områden, utöver spårkomprime-ring och automatiskt analys av prestandadata, dvs för att utforska visuella prestandadata.
Förutom ”Event Flow” grafer undersöker vi i denna avhandling även de-signen och användningen av ramverk för introspektion av prestanda. Framtida HPC-system kommer att vara mycket dynamiska miljöer kapabla till extrema nivåer av parallelism, men med en begränsad energikonsumtion, betydande resursfördelning och heterogen hårdvara. Användningen av realtidsdata för att orkestrera exekvering av program i så komplexa och dynamiska miljöer kommer att bli en nödvändighet. Den här avhandlingen presenterar två oli-ka ramverk för introspektion av prestandadata. Dessa ramverk är enkla att använda, ger prestandadata i realtid och kräver få resurser. Vi demonstrerar bland annat hur vårt tillvägagångssätt kan användas för att i realtid minska systemets energikonsumtion.
De metoder som föreslås i denna avhandling har bekräftats på olika stor-skaliga HPC-system med många kärnor såväl som gentemot nutida vetenskap-liga applikationer. Experimenten visar att våra metoder, när det gäller pre-standakarakterisering och introspektion av prestandadata, inte är resurskrä-vande och kan bidra till prestandaövervakning av framtida HPC-system.
Acknowledgments
First and foremost, I would like to thank my supervisor Prof. Erwin Laure for his guidance, and for providing me of enough freedom during my whole Ph.D to drive my research towards where I wanted. I would also like to express my deepest gratitude to my co-supervisor Dr. Karl Fuerlinger for their guidance, help, and good advise under my Ph.D time. My thanks also go to Prof. Jens Lagergren for his constructive feedback during my Ph.D studies.
I want to thank Prof. Jesus Labarta for being the opponent, and Prof. Christoph Kessler, Prof. Per Stenström, and Associate Prof. Elena Troubit-syna for being in the grading committee. Many thanks for participating in my
defence, for your questions, comments, and rewarding discussion. I also want to thank the advance reviewer Prof. Tino Weinkauf for his constructive feedback on my thesis.
I would also like to thank my colleagues at PDC for a friendly work environment, and for many interesting discussions under lunch and fika time. Special thanks to my colleagues Dr. Henric Zazzi and Dr. Thor Wikfeldt for helping me with the Swedish abstract. Finally, I would like to thank my family, especially Marta, for their continuous support and patience. It has been a long road that I would not have been able to travel without you.
Contents viii 1 Introduction 1 1.1 Thesis Outline . . . 5 1.2 List of Publications . . . 6 2 Preliminaries 9 2.1 Parallel Programming . . . 9 2.1.1 Amdahl’s Law . . . 9
2.1.2 Parallel Programming Models . . . 10
2.2 Performance Analysis . . . 12
2.2.1 Performance Metrics . . . 14
2.2.2 Performance Data Collection . . . 15
2.2.3 Profile-based tools . . . 16
2.2.4 Trace-based tools . . . 20
2.2.5 Expert Systems and Online Introspection . . . 26
2.3 Exascale Computing . . . 28
2.3.1 Overall Challenges . . . 28
2.3.2 Challenges for Performance Tools . . . 29
2.4 Our Approach . . . 30
I
Event Flow Graphs for Performance Data Compression
33
3 Trace Compression with Event Flow Graphs 35 3.1 Motivation . . . 353.2 Contributions . . . 36
3.3 Definition of Event Flow Graphs . . . 36
3.4 Trace Reconstruction using Event flow Graphs . . . 38
3.5 Implementation . . . 39
3.6 Evaluation . . . 39
3.6.1 Overhead . . . 40
3.6.2 Trace Compression Ratios . . . 41 viii
CONTENTS ix
4 Advanced Trace Compression with Event Flow Graphs 43
4.1 Contributions . . . 43
4.2 Wavelet Transform and EZW-coding for Trace Compression . . . 44
4.3 Implementation . . . 44
4.4 Evaluation . . . 45
4.4.1 Overhead . . . 45
4.4.2 Data Compression Ratios . . . 45
4.4.3 Quantitative Evaluation of the Reconstructed Data . . . 46
4.4.4 Qualitative Evaluation of the Reconstructed Data . . . 48
5 Future Work 55
II Event Flow Graphs for Performance Characterisation
57
6 Automatic Detection of Application Structure with Event Flow Graphs 59 6.1 Motivation . . . 596.2 Contributions . . . 60
6.3 Automatic Analysis of Event Flow Graphs . . . 60
6.3.1 Loops in Event Flow Graphs . . . 60
6.3.2 Detection of Loops at Run Time . . . 63
6.4 Detecting Process Similarity with Clustering . . . 64
6.5 Implementation . . . 65
6.6 Evaluation . . . 65
6.6.1 Overhead . . . 66
6.6.2 Automatic Selection of Performance Data . . . 66
6.6.3 Clustering Processes of a Real Application . . . 67
7 Performance Visualisation with Event Flow Graphs 71 7.1 Motivation . . . 71
7.2 Contributions . . . 72
7.3 Using Event Flow Graphs for Application Performance Exploration . 72 7.3.1 Loop Detection and Compression . . . 72
7.3.2 Graph Colouring . . . 73
7.4 Graph Visualisation in a Real Test Case Scenario . . . 74
8 Future Work 79
III
Online Performance Data Introspection
81
9 MPI Online Performance Data Introspection with IPM 83 9.1 Motivation . . . 839.3 The Performance Introspection API . . . 84
9.3.1 User-defined Regions . . . 84
9.3.2 Activities . . . 85
9.4 Evaluation . . . 86
9.4.1 Overhead . . . 86
9.4.2 Application Test Case . . . 88
10 An Online Performance Introspection Framework for Task-based Runtime Systems 93 10.1 Motivation . . . 94 10.2 Contributions . . . 94 10.3 AllScale Overview . . . 94 10.3.1 Vision . . . 94 10.3.2 Architecture . . . 95
10.4 The AllScale Monitor Component . . . 95
10.4.1 Performance metrics . . . 96
10.4.2 Data Collection . . . 97
10.4.3 Performance Reports . . . 98
10.4.4 Introspection and Real-time Visualisation . . . 99
10.5 Evaluation . . . 103 10.5.1 Overhead . . . 103 10.5.2 Use Case . . . 106 11 Future Work 109 12 Conclusions 111 Bibliography 115 Glossary 127
Chapter 1
Introduction
Computers have become a cornerstone in science. Disciplines such as earth sciences, life sciences, chemistry, physics or engineering use computers to model processes that would be difficult, or even impossible, to reproduce in a laboratory. However, many of these problems require a vast amount of computational power in order to be solved.
High-Performance Computing (HPC) is the field within Computer Science that studies, designs, and deploys parallel computing systems that offer huge computa-tional power. According to the TOP500 list [120], a list of the 500 most powerful computers in the world, the three most powerful computers at the moment of writing this thesis can provide over 70 petaflops (1015 floating point operations per
second). Although these systems offer an immense amount of computational power, there are still unsolvable scientific problems. Therefore, HPC is working towards its next milestone, Exascale Computing. Exascale systems will be able to provide an unprecedented amount of computing power, that is, an exaflop, or 1018 floating
point operations per second. Exascale computing introduces new challenges and exacerbates current ones though, for example, strong power constraints, the use of complex memory architectures, an increase in the failure rate of the system, and extreme levels of concurrency and parallelism to cope with.
If we look into the present state of HPC, current parallel systems provide already today a considerable amount of computational power, however, they are expensive to operate, and therefore, applications running in such systems have to be as effi-cient as possible. Writing effieffi-cient seffi-cientific software often becomes a heroic task. HPC systems are complex machines composed of multicore processors with deep memory hierarchies interconnected with complex network topologies. Furthermore, HPC systems are growing in size and becoming more heterogenous, often combin-ing multicore processors with accelerators, thereby, addcombin-ing an additional layer of parallelism and complexity. Therefore, program developers have to write intricate parallel software that communicates through complex networks, using several pro-gramming models to utilise the different layers of parallelism present in the system.
All these reasons make the use of performance tools of utmost importance in order to completely understand the performance behaviour of parallel programs, unveiling performance problems and providing insight on how to solve them.
Performance tools in HPC face several challenges on their own as well, the biggest of them being the data challenge. Current performance monitoring and analysis techniques will not be able to cope with the huge amounts of performance data that upcoming HPC systems will produce. For instance, storing fine-grain information for the whole execution of a program will be unfeasible. However, without detailed data on the execution of a program and with the increase in program complexity, it will be even harder to discern the root causes of certain performance problems. Furthermore, the big data issue exacerbates other problems as well such as application perturbation and slow down due to the high pressure put onto the I/O system.
In this thesis, and its related papers, we propose the use of Event Flow Graphs to mitigate the scalability problems present in classical performance data collec-tion and analysis techniques. Our Event Flow Graphs balance the amount of data collected with the amount of valuable information in such data. The nature of the graphs makes possible to store temporal information about the inherent order of the events performed by the application without storing the whole sequence of such events, and thus, they can be used to collect detailed data using less space than regular traces. In addition, as we will see later in this thesis, the use of Event
Flow Graphs goes beyond simple data compression. Event Flow Graphs can be
used to automatically detect the structure of iterative applications, characterising their loops and their hierarchical relations. This knowledge can be used, among other things, to drive smart collection of performance data, or to help the analyst in the task of performance analysis, pointing him/her to certain program spots or generating automatic reports.
We made the following contributions to address particular research questions: 1. How can we improve the scalability of performance data monitoring and
anal-ysis techniques? How could we reduce the amount of data collected while keep-ing as much information as possible in the data? We propose a disruptive
method to capture the performance of MPI applications in Chapter 3 and
Paper II [5] using Event Flow Graphs. This method combines the scalability
of profiling (generating performance summaries) with lossless information ca-pabilities of tracing (generating time-stamped sequences of events). To that aim, we present a formal definition of our Event Flow Graphs, and provide an implementation atop a real performance profiler. Thereafter, we evaluate our approach with several mini-applications from the NERSC-8 benchmark suite. We demonstrate that our graphs can capture the same amount of information as regular event traces while requiring much less storage space.
2. How could we overcome an initial limitation of our model that prevented us to
char-3
acterisation of the application? We further explore in Chapter 4 and Paper
VI [9] the compression of trace files using Event Flow Graphs, providing a
new approach that overcomes a limitation of our previous model, that is, the use of continuous data series in the model. This new approach com-bines wavelets and Embedded Zerotree Wavelet (EZW) encoding with Event
Flow Graphs to compress the data in situ while the application runs. By
doing so, we reduce the pressure on the I/O system because less flushes to disk are needed. Thereby, minimising application perturbation due to buffer flushing, and reducing the bias introduced into the application caused by such process. We demonstrate our approach with two real-world applications, Gro-macs and MILC. We perform a detailed study on the overhead introduced by our method as well as the error introduced into the compressed data. In ad-dition, we demonstrate how our compressed traces are indistinguishable from real ones in an analysis test case.
3. Could Event Flow Graphs be used beyond data storage? Could we use the
graphs to drive the collection of data in a smarter way to reduce the amount of redundant data collected? We propose in Chapter 5 and Papers III [6]
and V [8] a new approach using Event Flow Graphs to perform automatic analysis of performance data. We formalise and implement a mechanism that uses Event Flow Graphs to automatically detect the loop structures in parallel applications. This structure knowledge is very useful both in post-mortem and real-time scenarios, and therefore, we show an example for each case. First, we show how we can automatically generate post-mortem statistics on loop data. Second, we show a test case where the loop structure of a stencil code is detected during run time, and this information is used to automatically collect only a few representative iterations. We demonstrate that our reduced set of automatically collected iterations captures the same behaviour as a profile for the whole run obtained with a different tool. We also define and implement a method to use Event Flow Graphs together with clustering to detect MPI processes with the same behaviour within an application.
4. How could we improve the task of performance analysis performed by humans?
What techniques could be developed in order to use Event Flow Graphs with such a purpose? In Chapter 6 and Paper IV [7], we propose a new method
using Event Flow Graphs together with automatic graph analysis and colour-ing to support the task of application performance exploration. This new approach fills the gap between profiling and tracing. On one hand, graphs are very small in size and can contain statistics about the execution of the application as in profiling. On the other hand, graphs also show temporal causality of events and their sequential relations as in tracing. We demon-strate our approach by performing an analysis of a finite-element application. Our technique allows us to have a quick overview of the behaviour of the application and find several hotspots that could be improved.
In addition to the problem of tackling big data sets generated by upcoming par-allel systems, parpar-allel environments are getting more dynamic, highly concurrent, and with more resource sharing, as we will see in the following sections. In such a highly concurrent and dynamic scenario, real-time data to help the orchestration of system resources and in-situ analysis of data will become a necessity. Therefore, we have also worked in real-time performance introspection frameworks. In this matter, we provide several contributions trying to answer the following research questions:
5. How do we develop an API that provides real-time introspection capabilities
for MPI parallel applications? We present in Chapter 7 and Paper I [11]
an API implemented atop a state-of-the-art performance tool that provides access to the performance data in real-time while collected. We show the use of the API, and prove that the level of perturbation of our tool is minimal. We also demonstrate the benefits and usability of the API with a real test case where it is utilised to reduce the power consumption of an MPI application.
6. How do we develop a monitoring infrastructure providing real-time
introspec-tion with very low overhead within a multi-threaded task-based runtime sys-tem? What metrics are useful to characterise the performance behaviour of an application in real time? What real-time data can help a multi-objective optimiser in its decision-making process? We present in Chapter 8 and
Pa-per VII a monitoring infrastructure implemented within the AllScale
Run-time System, a task-based parallel runRun-time system for extreme scale. We de-sign and implement the monitoring infrastructure using a producer-consumer model with double buffering. We demonstrate why our approach is better in terms of overhead than other classical approaches where all threads store per-formance data in per-process structures. We also show how the perper-formance data generated by our framework are used to minimise the energy used by an application.
In summary, this thesis is divided into three blocks where we propose different approaches to tackle some of the challenges previously introduced, that is, big performance data volumes, and the requirement to have instant performance data for resource management. In the first two parts, we propose and develop a data model to characterise the performance behaviour of MPI applications using less data than in regular tracing approaches. The first part focuses on the definition of the model as well as using it for data compression. The second part deals with using this model for automatic analysis of performance data and smart data collection. Finally, in the third part of the thesis, we present our work in real-time data introspection of performance data for runtime systems.
1.1. THESIS OUTLINE 5
1.1
Thesis Outline
This thesis is structured as follows.
• Chapter 2: Preliminaries introduces the concepts of parallel computing, parallel programming, performance tools, and exascale computing. The chap-ter starts with an introduction to parallel computing, and describes the differ-ent parallel programming models used in HPC. Afterwards the chapter gives a detailed explanation on what performance analysis is, its importance, and its key concepts, for example, profiling, trancing or sampling. The chapter also includes a detailed literature review on the state-of-the-art tools in the field. Finally, the chapter introduces exascale computing, and enumerates the challenges that it entails.
• Part I: Event Flow Graphs for Performance Data Compression presents the work we have done in event trace compression using Event Flow
Graphs.
– Chapter 3: Capturing Data Temporality with Event Flow Graphs
formalises our graph model. The chapter also discusses the implementa-tion aspects of our approach, and shows first results with the NERSC-8/Trinity Benchmark Suite.
– Chapter 4: Advanced Trace Compression with Event Flow Graphs proposes a new method using wavelets for trace compression
that overcomes some limitations of the work presented in Chapter 3. We start motivating the work, then introduce the method we propose, and finally, we provide a detailed study on the overhead, error, and compression gains of our approach with two real-world applications. • Part II: Event Flow Graphs for Performance Characterisation presents
the work we have done using Event Flow Graphs for automatic analysis of performance data as well as for performance visualisation.
– Chapter 5: Automatic Detection of Application Structure with Event Flow Graphs proposes an approach that uses Event Flow Graphs
to detect the structure of iterative MPI applications. The chapter presents how graphs can be used to detect loops within applications, and to de-tect similarities among MPI processes via clustering. An evaluation of the proposed approach using a real application is also shown.
– Chapter 6: Performance Visualisation with Event Flow Graphs
proposes the use of our Event Flow Graphs for performance visualisa-tion. The chapter presents a combination of automatic graph analysis together with graph colouring techniques to enhance the exploration of performance data. We demonstrate our approach showing a complete performance analysis of a finite-element application.
• Part III: Online Performance Data Introspection presents the work we have done in real-time introspection, in other words, collecting and using performance data in real time while the application runs.
– Chapter 7: MPI Online Performance Introspection with IPM
presents an API built atop the Integrated Performance Monitoring tool (IPM) to access MPI performance data in real time while the application runs. We present a complete evaluation of the API as well as a real test case where it is used to reduce the energy consumed by a molecular dynamics application.
– Chapter 8: An Online Performance Introspection Framework for Task-based Runtime Systems proposes a full software stack
con-sisting of a compiler, an API and a runtime system for extreme scale. The Chapter gives an overview of the full system, and afterwards, focuses in the monitoring framework with real-time introspection capabilities in-cluded in the system. We give a detailed view as well as an evaluation of such monitoring framework. We evaluate its overhead with several benchmarks and a real application. We also present how the real-time data is useful to help the runtime scheduler to reduce the energy con-sumed by the system.
• Chapter 10: Conclusions concludes the thesis and highlights its key points.
1.2
List of Publications
Paper I Xavier Aguilar, Karl Fürlinger, and Erwin Laure. "Online Performance Introspection with IPM". In High Performance Computing and Com-munications & 2013 IEEE International Conference on Embedded and Ubiquitous Computing (HPCC_EUC), 2013 IEEE 10th International Conference on, pp. 728-734. IEEE, 2013.
I co-developed the software with the other authors. I designed and performed all the experiments. I wrote the main text of the paper.
Paper II Xavier Aguilar, Karl Fürlinger, and Erwin Laure. "MPI Trace
Compres-sion Using Event Flow Graphs". In European Conference on Parallel Processing, pp. 1-12. Springer, Cham, 2014.
I wrote the software presented in the paper atop previous work by Dr. Karl Fürlinger. I performed the experiments, and wrote most of the text of the paper.
Paper III Xavier Aguilar, Karl Fürlinger, and Erwin Laure. "Automatic On-line Detection of MPI Application Structure with Event Flow Graphs". In European Conference on Parallel Processing, pp. 70-81. Springer, Berlin, Heidelberg, 2015.
1.2. LIST OF PUBLICATIONS 7
I wrote the software presented in the paper. I designed and conducted the experiments, as well as analysed the collected data. I wrote the text of the paper.
Paper IV Xavier Aguilar, Karl Fürlinger, and Erwin Laure. "Visual MPI
Perfor-mance Analysis using Event Flow Graphs". In Internation Conference on Computational Science (ICCS), Procedia Computer Science, vol. 51, pp. 1353-1362. Elsevier, 2015.
I wrote parts of the software used in the paper. Particularly, I wrote the software related to the techniques used with Event Flow Graphs to enhance the task of performance analysis. I performed the experiments, the performance analysis of the code presented in the paper, and wrote most of the text for the paper.
Paper V Xavier Aguilar, Karl Fürlinger, and Erwin Laure. "Event Flow Graphs
for MPI Performance Monitoring and Analysis". In Tools for High Per-formance Computing 2015, pp. 103-115. Springer, Cham, 2016. I wrote parts of the software presented in the paper, performed the experiments, and wrote the text of the paper.
Paper VI Xavier Aguilar, Karl Fürlinger, and Erwin Laure. "Online MPI Trace
Compression using Event Flow Graphs and Wavelets". In International Conference on Computational Science (ICCS), Procedia Computer Sci-ence 80 (2016): 1497-1506.
I wrote the software presented in the paper. I designed and conducted the experiments. I wrote the text of the paper.
Paper VII Xavier Aguilar, Herbert Jordan, Thomas Heller, Alexander Hirsch,
Thomas Fahringer, and Erwin Laure. "An On-line Performance Intro-spection Framework for Task-based Runtime Systems". In International Conference on Computational Science, pp. 238-252. Springer, Cham, 2019.
I developed parts of the software stack presented in the paper. More concretely, the whole AllScale Monitoring Component, which is the cen-tral topic of the paper. I designed and performed the experiments, as well as wrote the text of the paper.
The following papers were also published during my PhD studies, although they are not included in this thesis. The first two papers present a performance study and optimisation of a chemistry code using state-of-the-art tools. This work helped us to understand the complexity of the performance analysis task, as well as the challenges that performance tools face when used to analyse real-world problems. The remaining publications address the design and use of runtime systems for HPC.
Paper VIII Xavier Aguilar, Michael Schliephake, Olav Vahtras, Judit Gimenez,
and Erwin Laure. "Scaling Dalton, a Molecular Electronic Structure Program." In Seventh International Conference on e-Science, e-Science 2011, 5-8 December 2011, Stockholm, Sweden, pp. 256-262. IEEE conference proceedings, 2011.
Paper IX Xavier Aguilar, Michael Schliephake, Olav Vahtras, Judit Gimenez, and
Erwin Laure. "Scalability Analysis of Dalton, a Molecular Structure Program." In Future Generation Computer Systems 29, no. 8 (2013): 2197-2204.
Paper X Michael Schliephake, Xavier Aguilar, and Erwin Laure. "Design and Implementation of a runtime System for Parallel Numerical Simulations on Large-Scale Clusters." In Internation Conference on Computational Science (ICCS), Procedia Computer Science 4 (2011): 2105-2114.
Paper XI Stefano Markidis, Michael Schliephake, Xavier Aguilar, David Henty,
Harvey Richardson, Alistair Hart, Alan Gray et al. "Paving the Path to Exascale Computing with CRESTA Development Environment." In Exascale Software and Applications Conference. 2013.
Paper XII Peter Thoman, Khalid Hasanov, Kiril Dichev, Roman Iakymchuk,
Xavier Aguilar, Philipp Gschwandtner, Pierre Lemarinier et al. "A Taxonomy of Task-Based Technologies for High-Performance Comput-ing." In International Conference on Parallel Processing and Applied Mathematics, pp. 264-274. Springer, Cham, 2017.
Paper XIII Peter Thoman, Kiril Dichev, Thomas Heller, Roman Iakymchuk,
Xavier Aguilar, Khalid Hasanov, Philipp Gschwandtner et al. "A Taxonomy of Task-Based Parallel Programming Technologies for High-Performance Computing." In The Journal of Supercomputing 74, no. 4 (2018): 1422-1434.
Chapter 2
Preliminaries
In this chapter we establish the thesis background by introducing parallel ing, reviewing the performance monitoring field, and introducing exascale comput-ing. Our work focuses on performance monitoring and analysis of MPI applications, as well as runtime systems for exascale. The first section of this chapter introduces parallel computing and summarises the programming models commonly used to write parallel applications. In the second section, we discuss performance analysis in HPC, and why it is important. We also provide an extensive characterisation of performance metrics, data collection techniques, and existing work on performance tools. Finally in the last two sections, we discuss exascale computing, its motivation and main challenges, the specific challenges for performance tools in exascale, and our approach to address some of those challenges.
2.1
Parallel Programming
2.1.1
Amdahl’s Law
Parallel programming, as opposed to traditional serial programming, consists of solving a problem concurrently using several computing elements. In other words, in a parallel application the work is split in chunks that can be processed in parallel by multiple processing units. Optimally, the speedup between a serial program and its parallel counterpart should be linear, that is, an application using N processing elements should run in 1/N of the duration of the serial code. For example, using twice the number of resources should halve the execution time. Nevertheless, more often than not this is not the case. Amdahl’s law [13] states that the theoretical maximum speedup (S) achievable when running an application with N processors depends on the portion of the algorithm that has been parallelised (P):
S(N ) = 1
(1 − P ) + PN (2.1)
As can be seen in the equation, the portion of the code that remains serial (1 − P ) determines the maximum speedup achievable. Therefore, it is of utmost importance to minimise such serial sections and maximise the parallel ones. Nev-ertheless, increasing the parallel part of a program is not sufficient to achieve good speedup. Program speedup also depends on how efficient the parallel sections of an application are, and hence, the use of performance analysis tools is of utmost importance to optimise such parallel parts and use resources efficiently.
There are many languages and libraries that enable the implementation of par-allel algorithms in current computer architectures. The following subsections give an overview of the most common models present in HPC, i.e. Message-Passing and Shared-Memory models. Accelerators are out of the scope of our work and will not be addressed in this thesis.
2.1.2
Parallel Programming Models
In the message passing model, processes have their own memory space and they communicate with each other using messages. These messages serve to transfer data from the local memory of one process to the local memory of another process. The message passing paradigm is widely used in distributed memory systems in-terconnected by high-speed networks, and in clusters of servers. There are many message passing standards such as CORBA [58], Java Remote Method Invocation (Java RMI) [33] or Remote Procedure Call (RPC) [88]. However, the de facto com-munication standard in HPC is the Message Passing Interface standard (MPI) [48]. The MPI standard provides a rich range of capabilities such as point-to-point operations, collective operations, and derived data types. Point-to-point operations involve communication between two processes and can be blocking or non-blocking. In blocking operations, the communication call cannot return until the buffer is free for reuse, whereas a non-blocking operation returns immediately. The most basic point-to-point operations are MPI_Send and MPI_Recv, which send and receive data to and from another process. The operations are composed of a buffer of a certain data type, a tag used to identify the operation, and a communicator as shown in Listing 2.1. The communicator is a logical object that connects groups of processes within an MPI application. Each MPI application has two default communicators. One that includes all the processes of the application, and one that contains each process itself.
Listing 2.1: Basic MPI point-to-point communication routines
i n t MPI_Send ( const void ∗ buf , i n t count ,
MPI_Datatype d a t a t y p e , i n t d e s t , i n t tag , MPI_Comm comm)
i n t MPI_Recv ( void ∗ buf , i n t count , MPI_Datatype d a t a t y p e , i n t s o u r c e , i n t tag , MPI_Comm comm ,
2.1. PARALLEL PROGRAMMING 11
The other type of communication provided by the MPI standard is collective operations, which involve communication among processes within a communicator, for example, all the processes of the application or a subset of them. The MPI standard defines a broad range of collective operations that can be divided into three categories: synchronisation, data movement, and collective computations (re-ductions) [18]. Synchronisation operations are used to synchronise all members participating in the collective in a certain point of the application. Data move-ment operations (broadcast, scatter, and gather) serve to distribute data within a group of processes as depicted in Figure 2.1. Broadcast sends one message from one process to all the others. Scatter distributes different messages from a root process to all the other processes in the group. Gather collects distinct messages from each process into a destination process. Finally, reduction operations serve to gather all data to one process and perform an operation with such data, for instance, maximum value, minimum value, product, addition, etc.
Figure 2.1: MPI collective operation models for data movement.
In addition, MPI also provides a mechanism to define derived data types that can be used in cases where the data to be sent is not homogeneous or contiguous in memory.
In opposite to the message-passing model, the shared-memory model allows multiple processes to exchange data via a unique shared memory space. This model is naturally suited for shared-memory architectures, and is more efficient
than message-passing because multiple processes can access the shared memory area as a regular working memory. In addition, it is easier to program because the software developer does not need to specify explicitly the communication be-tween tasks. There are many programming models based in the shared-memory paradigm, for example, OpenMP [34], Pthreads [94], Cilk [24], Threading Building Blocks [103], or OmpSs [40]. In addition, there are also other programming mod-els such as Unified Parallel C (UPC) [41], Co-Array Fortran [97], or Chapel [27], in which there is a global address space partitioned and each of those portions is local to each processing element, i.e. processes, threads, etc. Even though there is a broad range of shared-memory based models, OpenMP is the most widely used model in HPC.
OpenMP is a set of compiler directives, together with library routines and en-vironment variables, used to describe shared-memory parallelism in Fortran and C/C++. OpenMP offers an incremental approach, that is, the programmer only adds some directives in the parts of the program that can be parallelised. By following this approach, program development becomes simpler because one serial program can be parallelised by adding just a few directives, in contrast to MPI where the programmer has to re-design the program to distribute and communi-cate the data accordingly across processes. Nevertheless, OpenMP applications do not scale as well as MPI programs due to the fact that shared-memory architectures do not scale to large number of cores.
The execution model implemented by OpenMP is based on threads, the smallest unit of execution that can be scheduled by the operating system. Threads exist within a process and share the process state and data. OpenMP uses threads in a fork-join fashion as depicted in Figure 2.2. Applications start with a master thread that runs sequentially until it encounters a parallel region construct. When such construct is found, the master thread creates a group of parallel threads that execute the region in parallel. When the team of threads finish executing the parallel region, they synchronize and terminate, leaving the master thread alone again.
OpenMP was initially designed to exploit parallelism in loops, for instance, sharing loop iterations across teams of threads. However, since OpenMP 3.0, the model allows expressing more irregular parallelism through the use of the task construct. Tasks are work units that can be executed by the thread that created it, or can be deferred to be executed by any other thread of the team. Task execution and scheduling is decided by the OpenMP runtime.
2.2
Performance Analysis
As computing power grows in HPC, software developers need to keep pace with the growing complexity of parallel systems in order to use resources efficiently. Tuning applications to current technology leads to a better use of the resources and a shorter time to solution, thereby, allowing scientists to resolve bigger and more complex problems faster. Nevertheless, optimising an application without
2.2. PERFORMANCE ANALYSIS 13
Figure 2.2: OpenMP fork-join execution model.
the proper tools can become a daunting task. Developers can approach this task for example by measuring the execution time of the application or some of its parts after certain code modifications. While this method can provide some quantitative evaluation, using solely measurements does not shed any light into the root cause of a performance problem.
Performance analysis is a field in computer science that develops tools and methodologies for the collection and examination of data to understand the per-formance of computer software. Perper-formance analysis is important in order to not waste resources such as computational time, power, or human working force, which translates in the end into money. In addition, understanding the performance be-haviour of software is of utmost importance to make proper design decisions for future systems.
Performance analysis tools assist software developers in the task of understand-ing software behaviour as well as findunderstand-ing program bottlenecks. Such tools provide detailed metrics on the execution of the application and the underlying system. They also provide means to explore such performance data as well as to compare it against theoretical models or previous experiments. There are several aspects that can help us to classify performance analysis tools. The first of them is how data is stored and presented to the user. Tools either store the performance data in sum-maries with aggregated statistics, or in logs with time-stamped events, known as trace files. Even though performance summaries have a smaller memory footprint, they lack the temporal information about the events monitored as well as their time-dependent issues. Therefore, it is more difficult to spot certain performance problems such as the late sender problem with only performance summaries. In contrast, performance trace files contain all program events ordered in time with their corresponding timestamps, thus, giving the very detailed picture of what hap-pened with the application. However, collecting very fine-grained event traces is almost unfeasible with very large-scale runs due to the huge amount of data
gener-ated and the excessive I/O use that it requires. A second factor that can be used to classify performance tools is the mechanism used to collect the information: instrumentation and sampling. Instrumentation allows to inject hooks (or moni-tors) into specific program locations, thereby providing detailed information about such instrumented parts. In contrast, with sampling, the application is interrupted periodically and samples on the state of the application are collected.
2.2.1
Performance Metrics
The performance of an application is influenced by many factors: the applica-tion itself, the system software stack, and the hardware underneath. Therefore, the number of different parameters that can be measured is large, for example, measurements taken from the programming model used such as bytes transferred between processes, or measurements taken from the system layer such as time spent in I/O operations, or hardware performance counters depicting the performance of the hardware running the application.
One of the simplest values to measure performance is time, for instance, time spent in certain functions of an application. Time can easily be obtained using operating system facilities such as gettimeofday(), clock_gettime(), getrusage(), or by directly accessing the Time Stamp Counter (TSC) register. Besides time, there are many other valuable metrics related to program execution, for example, the number of times a certain function is executed, the number of bytes read and written from disk by POSIX-IO calls or the amount of memory used by the program. In the case of parallel applications, workload balance is an important metric to detect whether there are processors that do more work than others. In message-passing applications, other typical measurements collected are the number of messages sent and received, and the size of such messages.
As previously introduced, information from the hardware in the form of perfor-mance counters is of outmost importance when evaluating the perforperfor-mance of an application. The Performance Application Programming Interface (PAPI) [91] is an extensively used user interface that provides uniform access to such hardware coun-ters across multiple platforms. Hardware performance councoun-ters are special-purpose registers built on most modern microprocessors that count hardware events related to the execution of the program, e.g., number of instructions completed, number of floating point operations, number of cache misses, or cycles stalled for a cer-tain resource. In addition to these processor-specific counters, the emergence of new hardware has fostered the appearance of counters beyond the CPU, for in-stance, Myrinet and Infiniband network counters [116], Cray Gemini Performance Counters [98], or GPU counters [86].
In recent years, power has turned into a hot topic in HPC in order to reduce carbon footprint and system costs. Furthermore, in the road to Exascale, power has become one of the main constrains. The US DOE, for example, has set the maximum feasible power barrier for an Exascale machine to 20 MW [113]. Thus, most performance tools nowadays incorporate support for the collection of energy
2.2. PERFORMANCE ANALYSIS 15
consumption. Intel introduced a new technology called Running Average Power Limit (RAPL) with their Sandy Bridge microarchitecture [66]. RAPL provides a set of counters to measure power and energy consumed. These are not real analog measurements but measurements based on a power model. This software model simulates the power consumed using hardware performance counters and I/O models. Since RAPL counters are easily accessible through the PAPI library and the
/sys filesystem, many tools can provide such energy information. Cray introduced
in their XC systems new power measurement and control features, making it very easy to measure the power consumed [59].
All the metrics presented above are very useful to understand the performance flaws of an application, however, a correlation between application performance and source code is essential too. Such correlation allows software developers to better understand where the performance problems lie and what parts of the application can be improved. Therefore, performance tools also provide the means to relate collected metrics to specific parts of a program. These program locations can range from simple program counter PC values to complete call-stacks provided by libraries such as libunwind [118].
2.2.2
Performance Data Collection
Performance tools use code injection to collect performance information, in other words, monitoring code that is executed by the running process. There are two methods to invoke such monitors: instrumentation and sampling. Instrumentation consists in inserting monitoring hooks at specific points of the application, for example, functions or loops. When the application reaches one of those points, the monitor is executed and the performance data collected. Due to the nature of this method, it is very easy to associate the performance information collected to the location within the application where it was collected. There are several approaches when it comes to instrumentation:
Source code modification. This is the simplest method and consists in
in-troducing calls to the monitors directly in the source code. Calls can be inserted at any desired point in the application, however, this method requires to have the source code available as well as the need to recompile it. In addition, this method also requires some understanding of the application source code to know where to place the monitor probes.
At compilation time. Most compilers such as GCC [51], Intel [32], Clang [100]
or IBM XL [31] can insert instrumentation hooks at compile time. Although such instrumentation hooks could be inserted anywhere by the compiler, since compilers have full control of the instructions generated, they commonly offer callbacks at the entrance and exit of user functions. Other source-to-source translation tools such as OPARI[90] and the Program Database Toolkit (PDT) framework[81] can insert monitoring probes at instrumentation time too.
At the linking stage. Performance tools can make use of weak (overridable)
modify the source code nor recompile the application. Runtimes in the form of libraries such as MPI or OpenMP can be easily instrumented using this procedure. For example, the MPI standard provides two symbols for each of its calls. One weak symbol that can be used to inject code and one strong symbol that implements the real MPI call.
Shared library interposition. This mechanism can be used when the
appli-cation uses shared libraries. A shared library is an object code file that can be used by several programs without the need of including the code of the shared library in the program code. The shared library is loaded into memory with the executable file, and the unresolved symbols in the executable are resolved using the shared li-brary symbols. Most modern operating systems offer the possibility to load shared libraries into the process space before the executable is loaded, thereby being able to overwrite symbols from another library. In other words, the unresolved symbols in the executable will be resolved with the symbols from the first library that pro-vides it, in our case, the pre-loaded library injecting the monitoring hooks. From within these hooks, the original functions can be called using the dynamic loader API.
Binary modification. With binary modification the instrumentation code
gets injected directly into the binary file by modifying the sequence of byte-code instructions in the binary. These binary alterations can be done while the binary is loaded into memory or they can be saved into a new binary for repeated use. This approach is more complex than the previous ones but it allows the injection of hooks without having access to the source code nor having to recompile or link the application again. Dyninst[26], and Intel PIN[84] are tools that provide mechanisms for binary rewriting.
As mentioned previously, another method for performance data collection is sampling. In contrast to instrumentation, sampling consists in taking performance measurements when a recurring event such as a timer alarm is triggered, indepen-dently of application activity. Sampling is less intrusive than instrumentation as long as the frequency of sampling is not too high, because the monitored program is only interrupted when the samples are taken. However, sampling can lead to loss of microscopic effects that can happen between samples. In addition, the run-ning time of the application has to be long enough to obtain a number of samples statistically relevant.
2.2.3
Profile-based tools
Profile-based tools, also known as profilers, store the collected performance data into profiles, that is, summaries with aggregated statistics about the execution of the application. Profiles can be generated with very low overhead because the amount of data needed to generate them is small. Whereas in traces the tool keeps all the events of a certain category, with a profile the tool only needs to keep the amount of times the event happened and the total amount of time spent in such event. Although profiles are much more light-weighted and scalable than traces,
2.2. PERFORMANCE ANALYSIS 17
Figure 2.3: Gprof’s flat profile.
they lack the temporal order of the collected data needed for understanding certain performance problems.
One of the most widespread profilers included by default in many operating sys-tems and compilers is gprof[57]. Gprof can show statistics on function execution as well as call-graphs, i.e. trees showing the relation between function calls. Figure 2.3 shows a flat profile of the bt.S benchmark from the NAS benchmark suite [16] run on a Intel Xeon E5-2623v3 Haswell, and compiled with GNU compilers 4.8.5. The profile shows a list of functions and for each one of them, several metrics such as the time spent in the function itself, the cumulative time or the number of times the function has been called.
Perf [38] is a profile-based tool for Linux systems that provides information on processor events through the Performance Monitoring Unit (PMU). The Perfor-mance Monitoring Unit is a specialised hardware implemented in modern processors that counts processor events accessible via a software interface, for example, num-ber of instructions retired, cycles, L1 cache misses. In addition, perf also provides information on kernel events such as context-switches for example.
Figure 2.4: Example of a profile generated with TAU. The plot shows the time spent per function in every thread. Image obtained from the Paraprof User Guide.
The Integrated Performance Monitoring (IPM) tool [49] is a light-weight profiler for parallel applications. It generates rich reports containing statistics for several program events such as MPI operations, OpenMP regions, or POSIX-IO opera-tions. mpiP [123] is another profiling library for MPI applicaopera-tions. It focuses its attention on MPI communication and provides statistics on the MPI calls, number of messages sent, or message sizes, among others. In addition, mpiP also provides information on the MPI I/O activity.
Open|Speedshop [107] provides several profiles depending on a set of experi-ments defined by the user. Furthermore, Open|Speedshop also impleexperi-ments mecha-nisms to compare experiments from different runs.
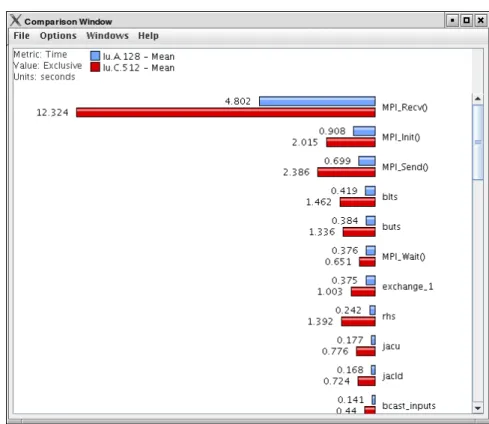
TAU [109] is a performance tool that provides a rich variety of instrumenta-tion and sampling capabilities together with a large number of different perfor-mance reports, for example, profiles with aggregated statistics on program events, statistics on the different call-paths executed by the application, or statistics on different application phases marked explicitly by the user. TAU comes together with Paraprof [21], a visualisation framework that provides charts to explore the data collected with TAU. Figure 2.4 shows a Paraprof screenshot with statistics on the time spent in several functions per thread. Paraprof also allows to compare performance across several runs of the same application using the PerfDMF [63] framework. Figure 2.5 shows a comparison of execution times between two runs of the same application using different input and number of processors.
The Scalasca tool[53] uses instrumentation to generate call-path profiles. These profiles contain metrics about the call-paths executed by the application, for
in-2.2. PERFORMANCE ANALYSIS 19
Figure 2.5: View comparing TAU performance data collected from multiple exper-iments of the same application. Image extracted from the Paraprof User Guide.
stance, execution times, call-path counts, hardware counters, MPI statistics, and OpenMP metrics. Scalasca’s CUBE[52] is the visualisation tool for the interac-tive exploration of the Scalasca profiles. CUBE divides the performance space in three dimensions shown in three different panels within the visualiser main window. These three hierarchical dimensions are metrics, call-tree (program), and system, as shown in Figure 2.6. The metric tree in the leftmost part of the picture presents metrics such as performance counters and timings from general to specific, for ex-ample, it starts with execution time, and then this time can be further divided into MPI and OpenMP time. The center panel (call tree view) shows the call paths executed by the application. Finally, the system tree view, the right panel in the display, shows the performance data mapped on the resources involved in the ex-ecution, i.e. threads and processes. All three panels are linked and contain boxes coloured with a gradient color, shown in the bottom part of the display, to help in the task of detecting hotspots.
HPCToolkit[3] is a suite of tools for the performance analysis of programs that provides measurements on resource consumption, program’s work, and
inefficien-Figure 2.6: Scalasca’s CUBE Visualiser. Left panel shows metrics, center panel shows the program call tree, and right panel presents program resources. Image extracted from CUBE 4.2.3 user guide.
cies, correlating such metrics with the program source code. HPCToolkit uses sampling and performance counters together with a sophisticated stack walk to correlate the provided metrics to their full calling context. HPCToolkit includes
hpcviewer [4] for the interactive exploration of the collected performance data. It
allows to explore call-path profiles correlated to program structure, compare met-rics from more than one run, and compute derived metmet-rics expressed as formulae of other existing metrics. Figure 2.7 shows a caption of the hpcviewer interface. The view contains a navigation pane (lower left) that presents a hierarchical tree-based view of program entities: procedures, loops, inline coded, etc. To the right of this view, hpcviewer presents several metrics associated with the entities in the naviga-tion pane on the left. Finally, the upper part of the window contains the source code associated with the current entity selected in the navigation pane.
2.2.4
Trace-based tools
Trace-based tools, also known as tracers, generate log files with time-stamped events, thereby, giving a very detailed picture of what happened in the applica-tion. Traces offer very fine-grain information about the time varying behaviour of
2.2. PERFORMANCE ANALYSIS 21
Figure 2.7: hpcviewer main panel.
the application, however, they lack in terms of scalability due to their huge size. In addition to the time-stamped events, traces usually include additional information such as performance counters or links to the source code.
Extrae [117] from the Barcelona Supercomputing Center (BSC) is an instrumen-tation and sampling tool that generates traces from several programming models such as MPI, OpenMP, CUDA, OpenCL, or Pthreads among others. Extrae traces are analysed with Paraver [99], a flexible data browser that offers a wide range of displays and performance metrics. Such performance metrics are not hardcoded into Paraver but programed, in other words, the user can compute any metric according to the semantics of the trace explored.
Paraver provides several types of views: timelines, profiles and histograms. Timelines are 2D charts where time is represented along the X-axis, computing abstractions such as processes or threads in the Y-axis, and the plot is coloured regarding the activity of the thread/process during that time interval. Figure 2.8 shows a Paraver timeline for MiniGhost [19], a stencil mini-application from the Mantevo project [119]. In this case, the timeline represents the state of each MPI process along time. Each color is a different process state, for example, blue is running, red is blocked waiting for a message, etc. The yellow lines in the timeline represent the communication between processes.
Figure 2.8: Paraver timeline. Time is represented along the X-axis and MPI pro-cesses along the Y-axis. Colors are the state of the MPI process, i.e., blue is running, red is blocked waiting a message, and orange is in collective communication. Yellow lines are communication between processes.
Timelines are very useful to explore in detail the evolution of processes over time, however, as the number of processes grows, extracting any conclusions from such a view becomes harder. For instance, it is extremely difficult to deduce any information from a timeline displaying hundreds of communication lines on top of thousands of processors. Therefore, trace visualisers provide other means to explore the data collected. Paraver can generate tables (matrices and histograms) with statistics computed from the trace. In such views, the rows of the table represent processes or threads, and columns represent the metrics computed. Figure 2.9a shows a Paraver table with the percentage of time spent in each MPI call over total MPI time for the MiniGhost application. Table rows are processes and columns are the different MPI calls. Table cells are coloured with a gradient color from light green to dark blue depending on the severity of the value stored in the cell. Figure 2.9b shows a Paraver histogram of the distribution of computational bursts per process. On the Y-axis we have again MPI processes, but now columns contain ranges of duration instead of single values as in Figure 2.9a. Each table cell is coloured with a gradient color according to the time spent in that range of duration for that thread in particular. If there is no value in a certain cell, then the cell is coloured in grey. In brief, each table line is a histogram of the different durations between MPI calls in every thread. If the application is well balanced, the plot should show pretty well defined columns because all processes have similar execution times between MPI calls, as shown in Figure 2.9b.
Score-P [76] is a performance analysis framework for parallel applications that generates trace files in OTF2 format [43]. OTF2 is a binary trace file format that uses different encoding techniques to reduce trace size and memory footprint. Traces generated with Score-P can be analysed afterwards with several tools such as Scalasca [53], Periscope [22], Vampir [74], and TAU [109].
2.2. PERFORMANCE ANALYSIS 23
(a) Paraver function profile view.
(b) Paraver histogram.
files generated by Score-P. Vampir provides displays such as timelines and prede-fined statistical charts, references to the source code, and filtering techniques to reduce the size of the data explored. In addition, Vampir is also implemented in a distributed manner, having multiple parallel processes driving the visualisation, thereby providing increased scalability and faster response than tools implemented with a sequential approach. Figure 2.10 shows several displays that can be gener-ated with Vampir. Figure 2.10a is a timeline with processes in the Y-axis, and the function calls along the X-axis. Figure 2.10b shows the accumulated time across functions and processes, and Figure 2.10c shows the communication pattern of the application, that is, statistics on the messages sent between MPI processes.
hpctraceviewer is a trace viewer included in HPCToolkit to explore sampled
data collected in a timeline manner. hpctraceviewer displays samples for process and time, call path depth and time, and call path of a specific process and time as shown in Figure 2.11. In the upper part of the figure, hpctraceviewer shows a timeline with processes or threads in the Y-axis and time in the X-axis. The timeline is coloured regarding the function executed by the process at that certain point in time. In the bottom part of the figure, we have the Depth View. This view shows for a specific process selected in the timeline, its call-paths (Y-axis) across samples (X-axis). Finally, in the right part of the figure, we have the Call Path view. This view shows the specific call path for a selected point of the timeline.
Pajé [37] is a visualisation tool designed to allow performance analysts explore execution of programs with a large number of threads. Pajé provides multiple filtering and zooming mechanisms to help software analysts to cope with the large amounts of information collected, for example, grouping of events, selection and removal of events, repositioning of events, creation of synthetic views abstracted from the data, and changes in the graphical representation of the events within its GUI.
Jumpshot [129] is another graphical tool for the postmortem study of parallel applications. It is based in the SLOG-2 trace file format, which allows to store a large number of drawable objects efficiently for their visualisation.
Scalatrace [96] provides on-the-fly lossless trace compression of MPI communi-cation traces. It uses regular section descriptors (RSDs) [61] to encode single loops and achieve intra-node compression. These RSDs are made of tuples in the form of
< length, event1, ..., eventn > where length is the loop count and events are MPI
routines. For example, < 100, M P I_Send, M P I_Recv > would be a simple loop with 100 iterations of alternating send and receive calls. Inter-node compression in Scalatrace is achieved by merging similar calls across processes. Scalatrace provides also a replay mechanism for the later analysis of compressed traces. Furthermore, Bahmani et al. [15] implemented a clustering mechanism within Scalatrace to detect representative processes and generate traces from only such representative entities. First, the tool classifies processes regarding their MPI call-paths using a bit sig-nature value. Afterwards, the tool applies another level of clustering to further sub-divide those main clusters into sub-clusters regarding the parameters used in the MPI calls.
2.2. PERFORMANCE ANALYSIS 25
(a) Vampir timeline view.
(b) Vampir function summary.
(c) Vampir communication matrix.
Figure 2.11: hpctraceviewer main panel.
Knüpfer et al. use Complete Call Graphs (CCGs) to compress trace files ac-cording to the call stack [75]. Their approach substitute similar sub-trees in a call graph with a reference to a single instance of such a call graph, thus, reducing the memory footprint of trace analysis tools. Krishnamoorthy et al. [78] create context-free grammars from the sequence of MPI calls using SEQUITUR.
2.2.5
Expert Systems and Online Introspection
As we have seen in previous sections, performance tools can collect a wide range of performance metrics. Thus, the performance tools community has been exploring the use of data analytics to help the user in the task of performance exploration and analysis, for example, looking for patterns of interest in the data, or automatically detecting application structure or program bottlenecks.
The EXPERT system [126, 127, 128] included in Scalasca searches for patterns in trace files to detect execution inefficiencies of MPI/OpenMP programs. EXPERT organises the performance properties in a hierarchical manner where upper levels represent general aspects such as time in MPI, and lower levels correspond to more concrete problems such as the late sender problem. These properties are defined using Python [122] and are stored in an extensible class repository. The performance properties automatically found in the trace by EXPERT can be visualized in CUBE. EXPERT was also extended in [54] with a parallel implementation to reduce the amount of time required for the automatic trace analysis. In addition, Böhme et
2.2. PERFORMANCE ANALYSIS 27
al. [25] extended Scalasca to automatically identify delays and the cost of wait states in MPI traces.
AutoAnalyzer [82] automatically investigates the existence of performance bot-tlenecks in SPMD programs using clustering algorithms. First, it divides the ap-plication into different program phases using source-to-source instrumentation. Af-terwards it collects performance data for each one of such program phases, and thereupon, the program phases are clustered regarding their performance to dis-cover dissimilarity and disparity performance problems. Dissimilarity bottlenecks are different performance behaviour among processes, in other words, process im-balance. These bottlenecks are detected when the program phase ends in different clusters depending on the MPI process. Disparity bottlenecks, on the other hand, are detected when certain program phases contribute significantly different to the overall performance of the application. Finally, AutoAnalyzer also tries to unveil the root causes of the performance problems found using rough sets and decision tables.
KappaPI [44] and KappaPI 2 [68] analyse traces from MPI and PVM programs to detect patterns that cause performance inefficiencies. In KappaPI 2, the set of rules used to detect such performance problems can be extended using the APART Specification Language (ASL) [45]. In addition, KappaPI 2 also uses source code analysis to relate performance problems to the source code, as well as providing suggestions to improve the performance.
The SCALEA [121] toolkit provides automatic analysis and classification of overheads, multi-experiment analysis, and storage of the performance data in a database. Aksum [47] is an automatic multi-experiment analysis framework that uses a set of problems and machine sizes to perform its automatic analysis. Aksum uses the SCALEA monitoring framework and encodes its performance properties with JAVAPSL [46].
The work of Cases et al. [28, 29] automatically unveils the iterative behaviour of parallel programs by converting performance traces into signals, and analysing them with spectral analysis techniques (wavelets). Thereby, the tool is able to generate chunks of traces that are more easily manageable than the trace for the whole execution.
The work of Gonzalez et al. [55, 56] uses hardware counters together with den-sity based clustering to identify different computational phases in parallel applica-tions. This technique is used by Llort et al. [83] over a distributed system using MRNet [105] to filter the performance data while it is being collected.
Paradyn [89, 106] utilises a set of agents over MRNet to perform a distributed search of performance problems of an application during run time. The search starts evaluating general performance properties, and depending on the outcome of such evaluation, it creates new experiments to evaluate more refined hypothesis. Periscope [22] implements the same principle as Paradyn.
Nickolayev et al. [95] use K-means statistical clustering with the Pablo Per-formance Environment [102] to select some representative processors and generate event traces only from such selected representatives.