Methodologies for calculating the overall heat release rate
of a vehicle in an underground structure.
Rickard Hansen
Mälardalen University
Box 883, S-721 23 Västerås, Sweden
KEYWORDS: Heat release rate, critical heat flux, vehicle fire, tunnel, underground structure
INTRODUCTION
Most common type of object involved in fires in underground structures such as underground mines are vehicles [1-3]. A major concern is the lack of documented fire experiments in vehicles/mobile equipment, which is especially the case for working vehicles such as loaders, drilling rigs etc. The resulting heat release rate (HRR) curves are essential knowledge when designing new tunnel or mine sections and overlooking existing sections, thus there is a great need for HRR curves.
This paper encompasses the measurement of the HRR for two full-scale fire experiments with vehicles representative for underground structures and the reconstruction of the measured HRR by investigating what methodology that fits the measured values best. The main purpose of the methodologies is to provide HRR curves without having to perform full-scale fire tests of the vehicles, which would be of considerable value.
INVESTIGATED METHODOLOGIES
This paper describes the application of potential methodologies to calculate the overall HRR of a vehicle in a tunnel or in an underground structure. The methodologies basically sum up the individual HRR curves from each object of the vehicle by estimate when ignition between objects occurs. The HRR for each object is represented by an exponential function of time. The exponential curves used originate from the work by Numajiri and Furukawa [4]. Ingason [5] [6] has further developed the concept and introduced the design parameters: maximum HRR (Qmax), total energy content (
E
tot) and the retard index (n), which is an arbitrarily chosen parameter with no physical meaning. Based on these parameters the time to maximum HRR (t
max) and the fire duration (t
d) can be calculated. Other parameters that are used in the model include the amplitude coefficient (r) and the time width coefficient (k), which are calculated based on the information given.The choice of methodology will vary depending upon what ignition criterion that is used - either a critical heat flux or an ignition temperature – and whether longitudinal ventilation is present or not. In this paper the critical heat flux ignition criterion is used for a case with longitudinal ventilation (where the heat transfer mechanism includes radiation as well as convection) and a case without longitudinal ventilation (where the primary heat transfer mechanism is radiation). The results are validated against experimental data obtained from two full-scale experiments.
More detailed information on the methodologies can be found in Hansen and Ingason [7] [8].
DRLLING RIG FIRE
The site of the full-scale fire experiments was the underground mine of Björka Mineral AB on the outskirts of Sala, Sweden. The drilling rig in question was an Atlas Copco Rocket Boomer 322. The initial fire consisted of a diesel pool fire in a circular container with a diameter of 1 m, placed right beside the rear tyres. A longitudinal ventilation velocity was established in the mine drift throughout the entire experiment. During the fire experiment it was observed that after approximately two minutes both rear tyres are ignited and the fire is spread further to hydraulic hoses and electrical cables in the
rear, upper part. Within the first ten minutes the cab is fully engulfed in flames and after approximately 12 minutes the right, forward tyre is ignited. It is assumed that the left, forward tyre is ignited at about the same time.
Figure 1. The Rocket Boomer 322 drilling rig. Photo: Andreas Fransson.
The burn off time of the diesel pool fire was calculated to ~17 minutes.Assuming a maximum HRR per unit area of 1.33 MW/m2 the maximum HRR of the diesel pool fire was calculated to 1.04 MW. The peak HRR was assumed to occur after ~8 minutes and the heat release rate was constructed based upon the peak value data and energy content:
t t
e e
Q 10403.12.26(1 0.0022)2.1 0.0022 [kW] (1) When calculating the maximum HRR of the fire in the tyre, a maximum HRR per exposed surface area – presented by Ingason [9] - of 0.20 MW/m2
was used. The total outer surface of each drilling rig tyre was calculated to approximately 3 m2. Assuming that the longitudinal ventilation velocity would increase the maximum HRR with a factor 2 [10] as the tyre thread was relatively deep, the maximum HRR of each drilling rig tyre was calculated to 1.5 MW. In an earlier tyre fire experiment the
maximum HRR occurred after approximately 30 minutes [11], but due to the longitudinal ventilation – leading to faster fire behaviour - the maximum HRR was assumed to occur after 10 minutes instead when studying the HRR curves by Lönnermark and Ingason [10]. The energy content of each tyre was estimated at ~1050 MJ, which was obtained by multiplying the weight of the tyre with its heat of combustion value, resulting in the following HRR curve:
t t
e e
Q 150092.56(1 0.00366)8 0.00366 [kW] (2) Based upon the visual observations the rear tyres are assumed to be ignited 2 minutes after the start of the diesel pool fire.
Underneath the drilling rig the fire gases and the flames from the pool fire and the fires in the tyres will be pushed along the bottom of the drilling rig towards the front tyres. Using a critical heat flux as ignition criterion for the front tyres and using the following expression for the incident heat flux, average gas temperature and average temperature at the fire [12]:
)
(
)
(
4 4 '' a avg a avg c fluxh
T
T
F
T
T
q
[kW/m2] (3) Where:c
h
is the convective heat loss coefficient [kW/m2∙K] avgT is the average gas temperature [K] a
T
is the ambient temperature [K]F is the view factor
is the emissivity factor
is the Stefan-Boltzmann constant, 5.67∙10-11 kW/m2∙K4
macp hPx f avge
T
x
T
(
)
(4) Where: ) ( f a f T T T is the average excess temperature at the fire location [K]
h is the lumped heat loss coefficient [kW/m2K]
P is the perimeter [m]
x is the location of interest [m] a
m
is the massflow [kg/s] pc is the specific heat of air [kJ/kg∙K]
p a a f
c
m
Q
T
T
3
2
[K] (5)In the calculations only the massflow in the lower region of the drift was accounted for (i.e. up to the bottom of the vehicle, ~0.3 m), as the total massflow would lead to too low temperatures and heat fluxes but only using the segment underneath the vehicle would overestimate the heat flux as the bottom of the drilling rig is not entirely enclosed and thus fire gases will escape on the sides and delay the ignition of the front tyres. Assuming a critical heat flux of 17.1 kW/m² [13] - which applies to natural rubber – the time of ignition of the front tyres was calculated to approximately 10 minutes, which is fairly closed to the visually observed 12 minutes.
The cab is assumed to be ignited mainly due to the flame radiation from the rear tyres, as the cab will protect the interior from the convective flow. The delay of ignition due to the influence of the windows was not accounted for in the calculations. Applying Heskestad flame height correlation [14] for the tyre fires:
D
Q
L
f
0
.
235
1
.
02
5 / 2
[m] (6) Where:D
is the diameter of the fire [m]When calculating the incident radiant heat flux to the cab interior from the flames it is assumed that the boundaries of the flames of a tyre fire have the shape of a rectangle.
F A A Q q depth width rad flames 2 '' [kW/m2] (7) Where: widthdepth
A is the area of the flame along the side of the tyre [m²]
is the atmospheric transmissivity, assumed to be 1The distance between the tyres and the cab interior was estimated to ~1.8 m. Assuming a critical heat flux of 1.3 kW/m2 for the cab interior – which was obtained through cone calorimeter tests – the ignition of the cab was calculated to occur after approximately 9 minutes. The average HRR per unit area of the cab interior was measured to 158 kW/m2 and the duration of the cab fire was estimated to approximately 10 minutes based upon the results from cone calorimeter tests. The surface of the flammable surfaces in the cab interior was estimated to 7 m2. The maximum HRR of the cab interior was calculated to 1106 kW and assumed to occur 5 minutes after ignition of the cab interior.
t t
e e
Q 11063.12.26(1 0.00377 )8 0.00377 [kW] (8) Approximately 300 meters of electrical cable participated in the fire, with an average outer diameter of 25 mm. The electrical cables were assumed - for simplifying the calculations – to be uniformly
distributed along the body of the vehicle. Using the results of a report by Axelsson et al. [15] the flame spread along the electrical cables was estimated to ~2 mm/s, applicable to a horizontal fire scenario with a longitudinal ventilation velocity of 0.6-0.7 m/s (assuming that the cable fires will be shielded by the vehicle construction) and a mixture of halogen and halogen free cables. Using the results of cone calorimeter experiments the average HRR per unit area was set to 190 kW/m2 and the fire duration to ~10 minutes – i.e. the fire duration of a small segment of electrical cable; the addition of all cable segments would lead to the overall fire duration of the cable fires. The electrical cables are assumed to ignite as the rear tyres are ignited. The fire is assumed to start in one cable, after one minute doubling the amount of cables on fire, after two minutes doubling yet again the amount of cables on fire etc. The maximum value of 1100 kW is assumed to occur approximately 20 minutes after the ignition of the electrical cable (i.e. when the fire has reached the maximum amount of fuel surface being burned).
t t
e e
Q 11003.32.29(1 0.000994 )2.3 0.000994 [kW] (9) The hydraulic hoses and the hydraulic oil inside the hoses are assumed to ignite at the rear tyres at the time of ignition of the tyres. One hydraulic hose is assumed to be ignited first and after each minute doubling the amount of hoses that are on fire. The total length of the hydraulic hoses on the drilling rig is approximately 900 meters, the hydraulic hoses have an average outer diameter of 22 mm and the amount of hydraulic oil per meter hose is 0.17 litres. The fire in the hoses is regarded as a continuous line fire along uniformly distributed hoses. No applicable flame spread data for the hydraulic hose was found during a search, but when studying pictures from the experiment it was estimated that the fire in the hoses reached the waist after approximately 6 minutes and resulting in an approximate flame spread velocity of 7 mm/s. Using the flame spread velocity, the average HRR per unit area of 152 kW/m2 and fire duration time of ~8.5 minutes based upon the results from the cone calorimeter experiments and assuming that the duration of the fire in the hydraulic oil is the same as for the hose, the maximum HRR was estimated to ~10220 kW and to occur approximately 20 minutes after the ignition of the hydraulic hose (same as for the electrical cable fire). Using the data above, excluding the hydraulic hoses in the forward part of the boom that did not participate in the fire, the HRR of the fire in the hydraulic hoses and the hydraulic oil within the hose was reconstructed.
t t
e e
Q 1022015.92.63(1 0.0023)14.9 0.0023 [kW] (10) The hydraulic oil tank will be emptied when a suction hose burns off. The tank is situated right behind the waist and a hose is assumed to burn off 8.5 minutes after the fire reaches the waist (i.e. the fire duration time of the hydraulic hose) and a pool fire is started. The inner diameter of the hose is 12 mm. Calculating the flow rate through the hose (assuming an initial liquid height of 0.7 m in the tank) using an expression by Ingason [16]:
h
k
t
k
A
q
2000
T
1
[l/s] (11) T vA
g
D
C
k
8
2
2
(12) Where: TA
is the horizontal surface area (m²), is assumed to be 0.8 m²D is the hole diameter (m) 1
h
is the initial height of fluid (m) vC is the flow contraction coefficient, is set to 0.7
Assuming a thick fuel bed – as the uneven structure of the road will form deep puddles - a HRR per unit area of 2.2 MW/m2 is used [17]. The regression rate of the thick fuel bed is then calculated to 0.051 kg/s∙m². Calculating the maximum spillage area using an expression by Ingason [16]:
'' max 1000 m q A
[m2] (13) Where:
is the density of fluid (kg/m³) ''m is the spillage burning rate (kg/s∙m²), setting it at 0.051 kg/s∙m²
The calculations resulted in an average maximum spillage area of ~3.5 m² and a maximum average HRR of 7.7 MW. The peak value was assumed to occur after ~5 minutes from the ignition of the pool.
t t
e e
Q 77001.531.75(1 0.00118)0.53 0.00118 [kW] (14) The remaining diesel in the tank was not assumed to have participated in the fire as the electrical valve on the tank was closed.
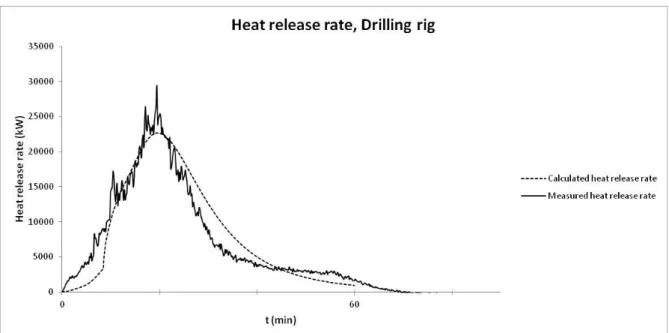
The resulting calculated HRR curve for the drilling rig together with the measured curve is shown in figure 2. As can be seen the calculated HRR curve matches the measured HRR curve very well. In both cases the total amount of energy – which was obtained by calculating the area underneath each curve – was ~31 GJ.
Figure 2. The measured versus the calculated HRR of the drilling rig.
BUS FIRE
Hammarström et al. [18] presented HRR measurements of a Volvo bus for 49 passengers. The scenario was a fire in the engine compartment in the rear end of the bus. The fire source was a propane burner with a steady state HRR of 100 kW. The fire was free to develop into the passenger compartment and continue to the rest of the bus. Due to overflow in the measuring system the measurement had to be cancelled at the time 19 minutes and 12 MW. It was predicted that a HRR of 15-20 MW would occur after 20 minutes.
The initial phase of the bus fire took place in the rear compartment; a propane burner was placed in the compartment. After 8 minutes and 50 seconds from ignition the left side panel of the compartment – with an area of approximately 1 m2 - fell off. When studying photographs taken at the experiment it can be seen that when the panel fell off a flashover occurred in the compartment with flames coming out from the opening. It can also be seen that fire gases at an early stage started to leak into the adjacent compartments and that flashover occurred in the centre compartments 20-30 seconds after the flashover in the rear compartment. It is assumed that the rear compartment encompassed a total fuel surface of approximately 7 m2 and that the centre compartments encompassed a total fuel surface area of approximately 27 m2 (the area of the panels were not included as the PVC flooring did not cover the panels). Using an average HRR per unit area of 130 kW/m2 for the PVC flooring based upon the results of Johansson et al. [19] and assuming that after 8 minutes and 50 seconds after ignition 7 m2 of PVC flooring and after 9 minutes and 15 seconds an additionally 27 m2 of PVC flooring will participate in the fire, resulting in a HRR of 910 kW and 3510 kW respectively. The duration of the fire in the compartments was estimated to last for 16 minutes before decaying based upon the results from ISO 5660 tests. Verifying the above calculated HRR of the compartments with respect to the stoichiometric HRR [20]: 0 0
1500
A
H
Q
stoichiometric
[kW] (15) Where: 0A is the opening area [m²] 0
H is the opening height [m]
The height of the panel of the rear compartment was estimated to 1 m and the area to 1 m2, resulting in a stoichiometric HRR of 1500 kW. The height of the panel to the centre compartment – which was
open during the entire test – was estimated to 0.5 m and the area to 2.5 m2, resulting in a stoichiometric HRR of approximately 2700 kW. Thus the fire in the rear compartment was fuel controlled and set to 910 kW and the fire in the centre compartment was ventilation controlled and set to 2700 kW. Resulting in the following heat release rate expressions:
t t rear e e Q 9103.162.27(1 0.00236 )2.16 0.00236 [kW] (16) ) ) 1 ( 53 . 1 76 . 4 ) 1 ( 654 . 1 5 . 1 ( 2700 0.0004t 0.5 0.0004t 0.00028t 3.76 0.00028t centre e e e e Q [kW] (17) During the experiment the rear, left tyre was observed to be ignited after approximately 12 minutes from ignition and the right, rear tyre after approximately 14 minutes from ignition [18]. Using the tyre dimensions in question the maximum HRR of the fire in the tyre was calculated to ~0.43 MW and was assumed to be attained after approximately 30 minutes [11]. The weight of the tyre was estimated to ~57 kg. Using a heat of combustion of 27 MJ/kg [9], the energy content of a tyre is calculated to ~1.54 GJ. The HRR of the tyre results in the following expression:
t t
e e
Q 4303.12.26(1 0.00063)2.1 0.00063 [kW] (18) The fire in the passenger compartment was regarded as an enclosure fire with some ventilation
openings, i.e. front and middle door and eventually some windows that are broken. Thus the primary fire spread mechanism will be radiant heat transfer from the flames and the upper gas layer. The passenger compartment is simplified by assuming that it consists of thirteen rows of seats with four seats in each row and with an average distance of ~0.2 m between each row, wall panel of ABS plastic, PVC flooring and needle felt on the walls.
The critical heat flux of a bus seat is assumed to be 7.8 kW/m2 [21]. For simplicity it is assumed that when the row of seats are ignited the section of wall panel and flooring at the row is ignited as well, as the HRR of a row of seats is much higher than for the wall and flooring section.
A HRR curve – presented by Johansson and Axelsson [19] - was used for each bus seat.
Reconstructing it mathematically – subtracting the 30 kW from the burner – resulting in the following expression:
t t
busseat e e
Q 2322.122.04(1 0.0075)1.12 0.0075 [kW] (19) The HRR per unit area of the ABS wall panel, PVC flooring and the needle felt was obtained through a report by Johansson and Axelsson [19]. Assuming that the fire environment of the passenger
compartment is a two layer equivalent, the calculations of the total heat flux from the fire to adjacent seat rows are separated into two parts:
- Radiant heat flux to the seats from the upper gas layer. - Radiant heat flux to the seats from the flames.
The two radiant heat fluxes are added to receive the total heat flux.
When calculating the radiant heat flux to the seats from the upper gas layer the following assumptions were made:
- All surfaces are grey, i.e. the emissivity – ε – is set to 0.9.
- The upper gas layer is gray and non-reflective, i.e. the emissivity of the upper gas layer – εg – is set to 0.19.
- The lower layer is transparent to thermal radiation.
- The ceiling and upper parts of the walls (above interface) are at the same temperature as the gas temperature.
- The radiation loss out doors and windows are ignored.
analysis.
The view factor – from interface plane to floor - is calculated assuming identical, parallel, directly opposed rectangles.
We are facing a pre-flashover situation, thus we will use the correlation of McCaffrey, Quintiere and Harkleroad (MQH) [22] in order to calculate the upper gas layer temperature, Tg . The correlation assumes a two zone approximation (a hot zone with an upper, hot gas layer and fire plume and a cool zone with a lower, cool gas layer) and that the zones are uniform.
Assuming a two layer ventilation flow and mass conservation, the position of the interface layer was calculated using the following expression for the mass flow rate of fire gases out from openings [22]:
2 / 3 0 2 / 1 0 0 2 1 1 3 2 H X T T T T g H A C m N g a g a a d g
[kg/s] (20) Where: dC
is the ventilation flow coefficient, which is set to 0.68 NX
is the neutral plane height [m]Using the plume mass flow rate equation of McCaffrey for the plume region [23] as a near-field plume model would be applicable in this case (i.e. a large fire in a small compartment):
895 . 1 5 / 2 124 . 0 Q z Q mp [kg/s] (21) Where:
z is the interface height [m]
This leaves us with the following expression if assuming mass balance for the fire gas layer, where the interface height is solved by iteration:
2 / 3 0 2 / 1 0 0 895 . 1 5 / 2 2 1 1 3 2 124 . 0 H X T T T T g H A C Q z Q N g a g a a d
(22)When calculating the incident radiant heat flux to the seats from the flames the same equation was used as for the cab fire in the case of the drilling rig. When calculating the flame area along the full width and on the sides of the seat row, the flame height was obtained through the McCaffrey correlation for the mean flame height [24]:
5 / 2 2 / 5 2 / 1
3
.
2
D
g
T
c
Q
D
h
a p a f
[m] (23)Using a spreadsheet when calculating the incident heat flux from the upper gas layer and the flames and assuming a depth of 0.4 m for each row, an effective width of 2 m and that both doors (height: 2 m and width: 1 m) and three windows (height: 1 m and width: 2.3 m) are open, the following matrix displays the ignition times of the various rows of bus seats (the rows are numbered starting with the row in the far back and the first row to be ignited is row number six):
Row # Ignition time (s) 1 315 2 273 3 225 4 169 5 100 6 0 7 100 8 169 9 225 10 273 11 315 12 352 13 387
The calculated maximum HRR of the passenger compartment was 20.4 MW. Verifying the calculated maximum HRR of the passenger compartment with respect to the stoichiometric HRR, results in a maximum HRR of approximately 20 MW. Thus the fire in the passenger compartment was during short interval ventilation controlled and the maximum HRR was adjusted in accordance to this.
Figure 3. The calculated and the measured HRR curve of the bus fire experiment.
The resulting calculated HRR curve for the bus together with the measured curve is shown in figure 4. As can be seen the calculated HRR curve matches the measured HRR curve very well up to the point where the experimental fire was extinguished. The calculated HRR was ~19 MW after 20 minutes, which is within the predicted interval of 15-20 MW.
DISCUSSION
The calculated HRR curve of the bus fire matches the measured HRR curve very well up to the point where the experimental fire was extinguished. The front tyres were not accounted for in the
calculations and were not ignited during the full-scale experiment, it is unclear at what point the front tyres would ignite and if they would ignite at all. Also, other flammable components such as fluids and hoses were not accounted for in the calculations, but the calculated results manages to effectively match the measured results and is most likely due to the successful reconstruction of the compartments fire and foremost the passenger compartment fire which will clearly dominate the HRR curve.
The calculated HRR curve of the drilling rig matched the measured HRR curve very well and the energy contents of the two curves were almost identical. During the calculations it was noticed that the
fire in the hydraulic hoses and the hydraulic oil clearly dominated appearance of the curve.
The results show the potential of the methodologies but additional tests will have to be made in order to be able to develop overall HRR curves for vehicles representative for underground structures, such as flame spread experiments along hydraulic hoses. The work also demonstrates that time observations, photos etc. from actual fires are valuable when developing a HRR curve for a vehicle. Additional work is also needed with respect to the influence of the construction of the vehicle in question - for example the time of failure of a component leading to the fire spread to an adjacent compartment or component – as this will greatly influence the ignition time of the individual components and thus also the overall HRR.
REFERENCES
[1] GRAMKO annual report 2005, Swemin, 2005
[2] De Rosa M.I., “Analysis of mine fires for all US metal/non-metal mining categories, 1990-2001”, NIOSH, 2004
[3] Thyer A.M., “Development of a fire and explosion risk assessment methodology for underground mines”, Health&Safety Laboratory, 2002
[4] Numajiri F. and Furukawa K., “Short Communication: Mathematical Expression of Heat Release Rate Curve and Proposal of ‘Burning Index’”, Fire and Materials, 22, 39-42, 1998 [5] Ingason H., “Design fire curves for tunnels”, Fire Safety Journal, 44, 259-265, 2009 [6] Ingason H., “Fire Development in Large Tunnel Fires”, 8th Fire Safety Science Proceedings,
1497-1508, 2005
[7] Hansen R. and Ingason H., “An Engineering tool to calculate heat release rates of multiple objects in underground structures”, Fire Safety Journal, 46, 194-203, 2011
[8] Hansen R. And Ingason H., “Heat Release Rates of Multiple Objects at Varying Distances”, Fire Safety Journal, present status: submitted, 2010
[9] Ingason H., “Fire test with a front loader”, SP report P801596, 2008
[10] Lönnermark A. and Ingason, H., “The Effect of Air Velocity on Heat Release Rate and Fire Development during Fires in Tunnels”, Fire Safety Science, 9, 701-712, 2009
[11] Hansen P.A., “Fires in Tyres – Heat Release Rate and Response of Vehicles”. SINTEF – Norwegian Fire Research Laboratory, 1995
[12] Ingason H., “Model Scale Tunnel Fire Tests”, SP report 2005:49, Swedish National Testing and Research Institute, 2005
[13] Babrauskas V., Ignition Handbook, Fire Science Publishers, Issaquah, 2003
[14] Heskestad G., Fire Plumes, Flame Height, and Air Entrainment, in The SFPE Handbook of Fire Protection Engineering, 3rd edition (eds P J DiNenno et al.), NFPA, Quincy, USA, 2002 [15] Axelsson J., Van Hees P. and Blomqvist P., “Cable Fires in difficultly accessible areas”, SP
report 2002:12, Swedish National Testing and Research Institute, 2002
[16] Ingason H., “Small scale test of a road tanker fire”, International Conference on Fires in Tunnels, 238-248, Borås, Sweden, 1994
[17] “Memorial Tunnel Fire Ventilation Test Program - Test Report", Massachusetts Highway Department and Federal Highway Administration, 1995.
[18] Hammarström R., Axelsson J., Försth M., Johansson P. and Sundström B., “Bus Fire Safety”, SP report 2008:41, SP Technical Research Institute of Sweden, 2008
[19] Johansson P. and Axelsson J., “Fire Safety in Buses – WP2 report: Fire safety review of interior materials in buses”, SP report 2006:59, Swedish National Testing and Research Institute, 2006
[20] Drysdale D., An introduction to Fire Dynamics, 3rd edition, Wiley, Chichester, 2011 [21] Chen F.F., “Radiant Ignition of New Zealand Upholstered Furniture Composites”, The
Department of Civil Engineering, The University of Canterbury, Christchurch, New Zealand, 2001
[22] Walton W.D. And Thomas P.H., Estimating Temperatures in Compartment Fires, in The SFPE Handbook of Fire Protection Engineering, 3rd edition (eds P J DiNenno et al.), NFPA, Quincy, USA, 2002
Bureau of Standards, NBSIR 79-1910, 1979
[24] McCaffrey B., Flame heights, in The SFPE Handbook of Fire Protection Engineering, 2nd edition (eds P J DiNenno et al.), NFPA, Quincy, USA, 1995