Feed-in from Distributed Solar Thermal Plants in District Heating Systems
5
0
0
Full text
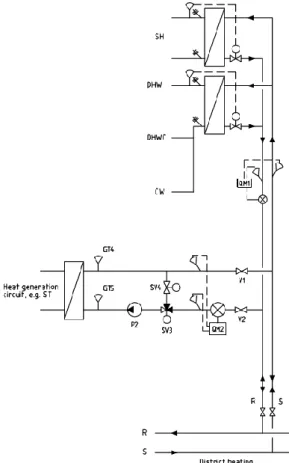
(2) production as fast as the feed-in variations of heat power, which caused the central pumps a hard time to follow the feed-in flow. The feed-in flow variations were a bigger problem than the variations in heat power feed-in. This was the first time a DH company had complaints on a feed-in plant in Sweden and the message was very clear; stop the oscillations or otherwise the feed-in plant must stop. Noisun is not connected to a specific customer or installed together with a load substation. To get a correct feed-in temperature a 3-way valve, SV3 in the figure 1, was used. To work properly, a 3-way valve needs about the same pressure difference on the two regulating ports. Two pressure sensors and one 2-way valve, SV4, are included in the feed-in station to give a good function on SV3. These extra control functions were not enough to eliminate the feed-in flow variations. To stop the oscillations in the feed-in flow, the control system was modified. The temperature up to the solar collectors, at sensor GT5, was set to be a function of the solar irradiation. This solved the problem.. 2.3 Ödåkra R/S feed-in system 36 apartments in 7 buildings were built in a small community outside Helsingborg, Ödåkra in 2009. The buildings have passive house standard and should to a large extent be heated by an ST system. The ST system would interact with a DH system. The first attempt was to only use ST on the DH substation secondary side but there was no space for storage tanks and it was not possible to change the drawings. Instead an ST R/S feedin plant was built. The heat power and temperature variations were identified already during the system test run but no action was taken. A simplified drawing of the feed-in system is shown in figure 2. The feed-in pump, P2, should work together with a 2-way valve, SV2, to get a correct feed-in temperature at GT4. There are about 10 ST feed-in plants in Sweden with the same feed-in substation layout and control system function.. Figure 2. Simplified drawing of the feed-in station at Ödåkra. The feed-in pump, P2, should work together with a 2-way valve, SV2, to get a correct feed-in temperature. Figure 1. Simplified drawing of the feed-in substation at Noisun. The feed-in pump P2 is given a speed relative to the DH differential pressure and SV3 is supposed to give the correct feed-in temperature and flow. SV4 and two pressure sensors give SV3 the possibility of work properly.. Some experiments have been performed at the Ödåkra plant. The differential pressure has been measured with a mobile test unit. Measurement from 5 days are shown in figure 3. The minimum difference occurred in the evening of 7 November and maximum difference occurred in the morning of 11 November. The most common difference was between 1,8 and 2,5 bars (18- and 25-meter water pillars)..
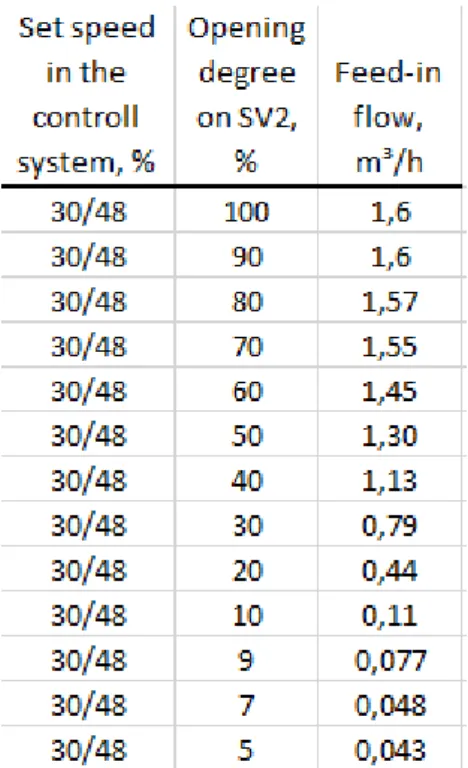
(3) Figure 3. Differential pressure, DP, at the Ödåkra R/S feed-in plant. The differential pressure was measured with 10 seconds resolution. In the graph DP is shown from 7 November 2014 until 12 November 2014. The minimum DP difference was 1,75 bar and the maximum difference is 3,15 bar but most of the time the difference was between 1,8 and 2,5 bar (or 18- until 25-meter water pillar). Table 1. The flow test with SV2 100 % open. The speed is changed from the control computer with an on/offdigital signal and an 0 – 10 V analogue signal for speed variation. The feed-in flow is measured with the feed-in station flow meter. The theoretical maximum feed-in flow is 1,6 m³/h. A flow test with pump speed variation was performed on the 17 March 2016. SV2 was 100% open and the flow was measured with the flowmeter in the heat meter that is integrated in the feed-in station. The used flow meter needs some time to show the correct flow as it has an integrated function. The theoretical maximum feed-in flow is 1,6 m³/h. Measured values are shown in table 1. The dominant pressure drop of feed-in pump P2 is the differential pressure. The DP is not flow dependent and P2 must exceed DP in order to generate a flow. When the speed and flow were indicated in the pump flow chart it became very clear that there is no flow before the DH network DP is exceeded. The numbers are shown in table 1. The pump is controlled by a 0 – 10 V signal from the control computer. The standard is that the pump is started by a digital signal, on/off, and if the 0 – 10 V analogue speed signal is at 0 V the pump starts on the lowest recommended speed, 25 %. It is almost impossible to get a correct feed-in flow with only pump-speed regulation. The higher the pressure drop (eg DP) the more difficult it is to get a correct flow if the flow is low. In the third test the pump speed was fixed. The pump speed was so high that the DP was exceeded, the pump could make a feed-in flow if SV2 was 100 % opened. Instead of reducing the P2 speed, SV2 was closed. Even if SV2 was not dimensioned for this function it was possible to get a correct flow. In table 2 the speed of P2 and the opening degree of SV2 is shown. The amount of extra electricity the pump needs is not calculated. Most important with this test was to see if it was possible to get a correct feed-in flow with this function and the result is very clear. It is easier to get a correct flow with controlling the opening degree on a 2way valve than with a pump speed control..
(4) Figure 4 shows a simplified drawing of a temperature controlled feed-in system. The pressure drop over SV4 is balancing the DP so that a correct feed-in flow can be obtained. P2 only needs to give a high enough pressure head so that it is possible to obtain a feed-in flow. The pump speed can be fixed or obtained from a set point given by the DP. A pressure sensor is then needed.. Table 2. P2 is given a fixed speed, high enough to exceed DP. The flow is controlled with SV2. It is much easier to get a correct flow with a change of the opening degree on SV2 than with P2, especially at high DP and low flows. 3 CONCLUTIONS 3.1 Two R/S feed-in possibilities A feed-in system needs to deal with these two conditions. The system must know how much flow and/or heat power to feed-in. The control system must be able to feed in the correct flow and/or heat power. The first part is solved in ST system by measuring the solar irradiation and some temperatures. Heat power or flow can then be determined by calculations. For other types of local heat sources than solar, it can be more difficult. For the second part, how the feed-in system can give the correct feed in flow, two base concepts have been developed, on the basis of the two plants reported above: Temperature controlled system with a shunt flow Flow controlled system with no shunt flow. 3.2 A temperature controlled system In a temperature controlled system, it is important that there is always a shunt flow. The feed-in flow has two alternative flow paths, through the shunt or as a feed-in flow. The DP is the dominating pressure drop for the feed-in flow and the easiest way to balance this pressure drop in the shunt pipe is with a 2-way valve.. Figure 4. Simplified drawing of the feed-in substation with a temperature control layout. SV4 balances the DP pressure and can give the correct feed in flow. P2 only needs to give high enough pressure head so that it is possible to get a feed in flow. One disadvantage with a temperature controlled system, is that the temperature at GT5 is always higher than the DH return temperature This in turn means that the cold temperature on the other side of the heat exchanger is a little bit higher than necessary. One advantage with a temperature controlled system is that P2 can work with a better and acceptable flow. 3.3 A flow controlled system In a flow controlled system no shunt flow is used. A correct feed-in flow is created with speed variations on P2, a fixed speed on P2 and variated varied opening degree on SV2 or a combination of the two alternatives. The largest disadvantage is that P2 must, for a shorter or longer time, work with a flow lower than what the pump.
(5) manufacturer has recommended. If the time operated at a low flow is long, it could affect the guarantee. As there is no shunt flow the temperature at GT5, se figure 2, is always the same as the temperature on the DH return line. The cold temperature at the other side of the heat exchanger can be colder in a flow controlled system than in a temperature controlled system. 3.4 A mixed feed in system It is possible to design a feed-in system with a mixture of a temperature and a flow controlled systems. When the heat-power production is low the feed-in system can work as a temperature controlled system with a high enough flow on P2 with help of a shunt flow. When the feed-in flow is high enough the control system can switch to a flow control system. To make a combination system running in a real plant can be difficult. 4. FUTURE WORK 4.1 Test plant in Düsseldorf A test plant with a solar collector area of little more than 200 m² is under construction in Düsseldorf. The feed-in substation with the control unit is prepared to test different R/S feed-in possibilities. More information and results will be reported in the coming year. 4.2 Rebuilding of Swedish feed-in plants The Swedish ST feed-in plants do not [1] perform as well as expected. A possible reason for this is the poor feed-in function. One plant is already under discussion of reconstruction and others are going to be informed about the new findings. How many that will be rebuilt before summer 2017 is uncertain.. 4.3 New plant in south of Sweden A new ST feed-in plant is planned in southern Sweden. The collector area is a little more than 200 m². The R/S feed-in system is not yet decided, but this plant will be using both R/R and R/S connections. 4.4 Summary There is still a lot of research on feed-in systems needed. A longer article that more fully describes the basic principles is under way. The field tests that will be done during summer 2017 can provide a deeper understanding of the feed-in problem. Already performed tests show that the local circumstances can affect the feed-in layout and control system considerably. REFERENCES (The references here are enclosed to serve as an example of Reference formatting in various cases) [1] Dalenbäck, J.-O. et al., 2013. Solvärme i fjärrvärmesystem - utvärdering av primärinkopplade system, Svensk fjärrvärme AB. [2] Lennermo, G., Lauenburg, P. & Brange, L., 2016. Små värmekällor, Available at: http://www.energiforsk.se/program/fjarrsyn/rapporter/sma -varmekallor-kunden-som-prosument/. [3] Lennermo, G., Lauenburg, P. & Brand, L., 2014. Decentralized heat supply in district heating systems implications of varying differential pressure. 14th International Symposium on DH and Cooling ..
(6)
Figure

Related documents
Från den teoretiska modellen vet vi att när det finns två budgivare på marknaden, och marknadsandelen för månadens vara ökar, så leder detta till lägre
40 Så kallad gold- plating, att gå längre än vad EU-lagstiftningen egentligen kräver, förkommer i viss utsträckning enligt underökningen Regelindikator som genomförts
Regioner med en omfattande varuproduktion hade också en tydlig tendens att ha den starkaste nedgången i bruttoregionproduktionen (BRP) under krisåret 2009. De
Generella styrmedel kan ha varit mindre verksamma än man har trott De generella styrmedlen, till skillnad från de specifika styrmedlen, har kommit att användas i större
Parallellmarknader innebär dock inte en drivkraft för en grön omställning Ökad andel direktförsäljning räddar många lokala producenter och kan tyckas utgöra en drivkraft
I dag uppgår denna del av befolkningen till knappt 4 200 personer och år 2030 beräknas det finnas drygt 4 800 personer i Gällivare kommun som är 65 år eller äldre i
Generell rådgivning, såsom det är definierat i den här rapporten, har flera likheter med utbildning. Dessa likheter är speciellt tydliga inom starta- och drivasegmentet, vilket
Detta projekt utvecklar policymixen för strategin Smart industri (Näringsdepartementet, 2016a). En av anledningarna till en stark avgränsning är att analysen bygger på djupa
