Bachelor Thesis in Business Administration
DUSSOULIER Hannah
&
ISHAC Patrick
The impact of Big Data on companies and a lack of
skills as the origin of the challenges they are facing
An investigation aimed to understand the origin of the challenges companies are facing with Big Data
Dussoulier Hannah - 950402 - T149 Ishac Patrick - 950629 - T153
1
Abstract
The 21st century saw the rise of internet and with it, the digitalization of our world. Today, many
companies rely on technology to run their businesses and Big Data is one of the latest phenomenon that arose from technological evolution. As the amount of data is constantly increasing, ranging from business intelligence to personal information, Big Data has become a major source of competitive advantage for companies who are able to implement it efficiently. However, as with every new technology, challenges and issues arise. What’s more, the learning curve is steep, and companies need to adapt quickly, so as to follow the pace of innovation and develop the skill-set of their employees to remain competitive in their respective industries. This paper investigates how Big Data is impacting companies, the main challenges they are facing within its implementation and looks to determine if these challenges originate from a lack of skills from the current workforce. A qualitative study has been conducted, interviewing nine respondents over eight interviews of 54 minutes on average.
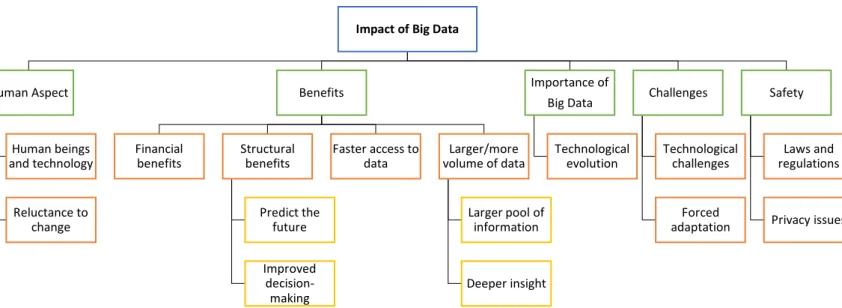
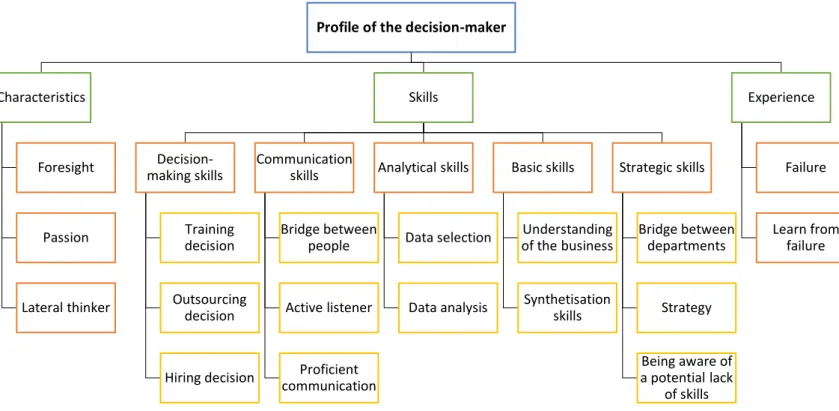
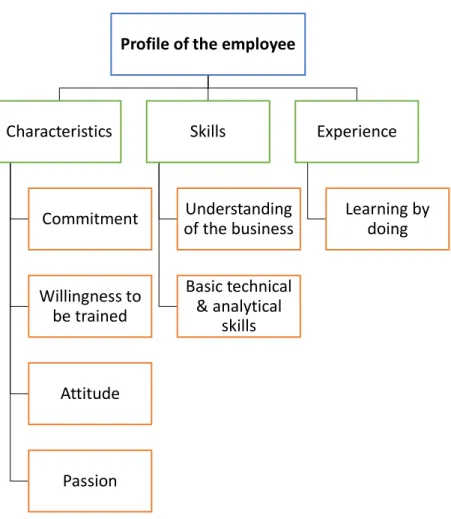
Three main ideas have been outlined through the interviews conducted by the authors. The first is the impact of Big Data in companies with mainly the benefits, challenges, regulations as well as the cohabitation of human beings and technology. The second and third are the optimal profile of a decision-maker and the ideal profile of the employee in companies working with Big Data. The profiles of the decision-maker and employee are composed of characteristics, skills and experience. The decision-maker, in this paper, was defined as a key actor in the success or failure of a company and of great influence on the profile of the employee. His skills, such as strategic, basic, analytical, communication and decision-making were developed, and their correlation was demonstrated. Ultimately, the lack of skills in companies today, often regarded as a challenge by numerous scholars, was shown to be the origin for many of the challenges companies are facing, mainly through bad decision-making and lack of communication.
The authors finally outlined steps for a successful implementation of Big Data in companies and future trends such as regulations and increased technological evolution to carefully and actively pursue for people and businesses alike.
2
Acknowledgements
We would like to express our gratitude to Rudrajeet Pal, our thesis tutor for providing unwavering guidance and sharing precious time and expertise.
We also extend our appreciation to Anders Melander, our course examiner as well as all associate teachers and lecturers: Adele Berndt, Charlotta Mellander, Naveed Akhter, Lucia Naldi, Kristofer Månsson and Mikaela Backman for their seminars and lectures throughout the semester.
A special credit goes to all of our interviewees who kindly agreed to discuss this topic with us and without whom we would never have been able to write this paper: Gilles Yvetot, Frederique Stumm, Mark Eid, Simon Werner Zankl, Gilbert Salhani, Antonio Boulos, Yvette Madi, Mario Montag and Delphine Genin. Thank you again for your time, support and passion.
We would also like to thank Peter Trummel, Marina Bau and Kristin Klinge for their considerable help and support.
Above all, we are immensely grateful and forever thankful to our families who supported us in every possible fashion during our studies and the writing process of this paper.
3
Table of content
Part 1: Introductory Chapter ... 6
1.1 Background ... 6
1.2 The problem ... 7
1.3 The purpose ... 7
Part 2: The state of the literature ... 9
2.1 The definition of Big Data ... 9
2.2 The opportunities of Big Data ... 11
2.3 Big Data Challenges ... 14
2.4 The challenge “lack of skills” ... 17
2.5 Definitions ... 20 Part 3: Methodology ... 22 3.1 Research Design ... 22 3.1.1 Philosophical perspective ... 22 3.1.2 Research Approach... 23 3.1.3 Research Strategy ... 23 3.2 Methodology ... 24 3.3 Method ... 24 3.3.1 Sampling Method ... 24 3.3.2 Interview Design ... 27 3.4 Data Collection ... 29 3.5 Data Analysis ... 29
3.6 Description of Analysis Strategy ... 30
3.6.1 Analysis Procedure ... 30
3.6.1.1 Transcripts ... 30
4
3.6.1.3 Identified categories ... 31
3.6.2 Creation of sub-categories ... 31
Part 4: Ethics and Trustworthiness ... 33
4.1 Ethics ... 33
4.2 Trustworthiness & quality of research ... 34
4.2.1 Credibility ... 34
4.2.2 Transferability ... 35
4.2.3 Dependability ... 35
4.2.4 Confirmability ... 35
Part 5: Empirical Findings ... 37
5.1 Impact of Big Data... 37
5.2 Profile of the decision-maker... 39
5.3 Profile of the employee ... 41
Part 6: Analysis and Interpretation of Findings... 43
6.1 Impact of Big Data... 43
6.1.1 Humans and Technology ... 43
6.1.2 Data Safety ... 45
6.2 Profile of the decision-maker and employee ... 46
6.2.1 Characteristics and Experience ... 47
6.2.2 Skills ... 48
Part 7: Discussion ... 53
7.1 Findings correlated to the literature ... 53
7.2 Findings adding new insights to the literature ... 55
Part 8: Conclusion ... 57
Part 9: Managerial implications ... 59
9.1 Further managerial implications related to our research question ... 59
5
Part 10: Limitations ... 63
10.1 Inherent challenges ... 63
10.2 Methodological challenges ... 64
10.3 Data collection challenges ... 64
Part 11: Further Research ... 66
References ... 67
Appendices ... 72
Appendix 1: Interview Design Table ... 72
Appendix 2: Consent Form ... 73
6
Part 1: Introductory Chapter
1.1 Background
The 21st century has seen the rise and fast development of new technologies through companies
such as Alphabet, Microsoft, Apple and Amazon. Technology has completely blended into our lives and became ubiquitous through our smartphones, laptops and all the Internet of Things (IoT) devices i.e. connected devices available in the market.
In the last decade, we have transitioned to what is widely called today the digital era, where data has become the new raw material (Berners-Lee & Shadbolt, 2011) and digital oil (Yi, Liu, F., Liu, J., & Jin, 2014). As data is generated through every interaction by any individual, be it through an online action or a physical contact, the amount of information generated and collected every second is constantly rising, ever so quickly.
During the last few years, due to the large amount of data available and the rapid increase in data creation, the phenomenon has been generically called Big Data. It mainly emerged from the combination of widespread internet access, growing number of consumer products and services, powerful computing power and large data warehouses. This pool of data is now used in both the public realm and the business world (Cukier & Mayer-Schöneberger, 2014). In the business world in particular, Big Data is regarded as a tool that provides companies with more information, faster than ever before. Big Data is at the core of many firms today as they build their businesses around the phenomenon and is also used as strategy guidance and influences their decision-making activity.
Big Data is however, quite a recent phenomenon as scholars widely started investing it after 2010 (Gandomi & Haider, 2014). The development rate of the technologies Big Data is based on, coupled with the newly developed interest from scholars and companies alike, translates into a broadly unknown field. However, as tech-companies through innovation, and not scholars through researches, are moving the phenomenon forward, the business community has not been able to efficiently adapt. This ultimately resulted in numerous challenges faced by companies when implementing Big Data partly due to a mere lack of time.
7 As with every innovation and technological progress, there is a learning curve and due to the fast growth of Big Data, companies had little time to develop the skill-set needed to proficiently use this new tool. Now that the business environment has radically shifted to become digital and data-enabled, it requires deep understanding and adaptation from companies and people.
1.2 The problem
Based on the reviewed literature about Big Data, we identified that many companies face various barriers in its usage and understanding. The difficulty for many firms is to know how to select only the valuable data and how to use all this information effectively. Big Data can bring many new opportunities to companies, but this is only possible if the firm has the necessary resources to process all the available data (Marr, 2016).
Indeed, many researches exists about the barriers of Big Data. However, no research has been focused on one particular challenge in order to help companies overcoming it. Existing literature within that field highlights that more investigation on the various issues that Big Data brings to organizations should be done (Chen, & Zhang 2014) and that considerable research efforts are needed to improve the efficiency of data usage and analysis (Chen, Mao, Zhang, & Leun, 2014). Also, some authors ask for deeper investigation on how organizations should restructure themselves in order to embrace Big Data and provide precise recommendations for new strategies implementations (Mauro, Greco, Grimaldi & Ritala, 2017).
The problem in this research paper is studied from a management’s perspective where Big Data is used as a strategic tool influencing decision making.
1.3 The purpose
Big Data is a relatively new phenomenon which impacts almost every company nowadays (Slessor, 2017) and even if literature exists within that field, many questions are still not answered and Big Data remains a vague concept for many people.
With this research paper, we aim to study Big Data and its impact on businesses as well as discover the challenges these companies face, how they arose and where they originate from. We have chosen to investigate one specific issue which is the lack of skills within companies as the potential origin for the challenges.
In this regard, our research should be relevant for companies who seek to understand why and how a potential lack of skills will affect their business performance and how to address. This
8 research should also be of interest to business students who will most probably work in a data-enabled company in the future.
Existing literature defines lack of skills as the challenges companies face, related to the lack of knowledge and understanding, that translates into an inefficient use of Big Data (Marr, 2016). In this sense, lack of skills represents the challenges that employees face by not understanding Big Data because of their limited knowledge and due to potential lack of training in that field. The term lack of skills is also related to management and leadership not able to align knowledge transmission between the different departments of the company (McAfee & Brynjolfsson, 2012). The lack of technical abilities results in a bad understanding of data that directly impacts a company’s performance. The impact is on the one hand, errors in decision making and on the other hand, not using Big Data as an opportunity for growth.
In this sense, our research questions are:
How is the implementation of Big Data impacting companies today?
What challenges arise from the implementation of Big Data and do they
originate from a lack of skills?
9
Part 2: The state of the literature
This part of the paper presents an analysis of the stream of research on Big Data, the opportunities and main barriers that companies face, based on 55 articles published on internet as well as in various books, between 2001 and 2018. The used articles come exclusively from scientific and academic entities.
2.1 The definition of Big Data
During the last decade, the term “Big Data” has started to emerge rapidly within the academic literature (Mauro, Greco & Grimaldi, 2016). However, scholars are struggling to agree on a formal definition of Big Data, emphasizing the fragmented discourse on what constitutes it and what metrics define it (Sivarajah, Kamal, Irani & Weerakkody 2017). The main reason behind this academic condition is the fast adoption of Big Data by public and private sectors which left little to no time for academics to develop and settle on a formal definition (Gandomi & Haider, 2014). This is partly due to Moore’s Law that states that the number of transistors doubles approximately every 2 years, implying that the computing power doubles as well, thus attesting that technology is constantly moving forward. As of 2018, the majority of scholars still argue on an “official” description of this phenomenon.
However, this same majority shares a common ground through Laney’s definition in 2001. Laney (2001) has famously outlined Big Data’s 3Vs: Volume, Variety and Velocity. Volume stands for the size of the data, Variety refers to its structure and Velocity is the rate at which it is produced. This 3Vs framework is shared by Chen, Chiang and Storey as well as Kwon, Lee and Shin (2012) but also Gandomi and Haider (2014) to only cite a few.
First, Volume fundamentally defines the physical space required or the hard drive capacity necessary to store the data. The Volume of data is a very interesting characteristic because what is considered a large amount of data today, is most probably going to be of insignificant size in the future considering the speed at which data is created.
Regarding Velocity, scholars are unanimous, data production is going to increase exponentially in the future. According to a study by Gantz and Reinsel (2012), between 2005 to 2020, the
10 digital space will have grown by a factor of 300 reaching 40 Zettabytes. In 2010, we were at 1,3 Zettabytes. In 2017, we were at approximately 2,5 Zettabytes.
Some of the reasons for this massive increase are the proliferation of Internet of Things (IoT) devices, the increased availability of internet in third-world countries and the ever-increasing data generated by each individual due to more devices and more reliance on internet-based services (Gantz & Reinsel, 2012; “Data never sleeps 5.0”, 2017; “Extracting business value from the 4Vs of Big Data”, 2016).
Finally, Variety is also becoming a more challenging characteristic. Research has outlined three types of data: structured, semi-structured and unstructured. Structured, which represents 5% of all existing data (Cukier, 2010), is the data available in spreadsheets for example. Texts, images, videos and audio are some examples of unstructured data, the latter represents more than 90% of the data today. Semi-structured data is a cross between these two as it may have some structure that can be used for analysis but lacks the strict arrangement found in database or spreadsheets (Marr, 2016).
Building upon these 3Vs, Dijcks (2013) ads a fourth V: Value, he states data can be used to create valuable insights that may lead to an increased competitive advantage for companies. Schroeck, Shockley, Smart, Romero-Morales and Tufano. (2012) believe Veracity is another characteristic as some sources within the Big Data Supply Chain are inherently unreliable. Tech-companies such as IBM, Oracle and SAS also tend to share these two new characteristics (“SAS - What is Big Data”, 2018; “Extracting Business Value from the 4Vs of Big Data”, 2016).
Besides, Suthaharan (2014) has his own framework with the 3Cs: Cardinality, Complexity and Continuity. SAS does share the Complexity point of view but ads Value as well to its own definition (“SAS - What is Big Data”, 2018). IBM developed their own framework labeled the 5Vs that include Laney’s 3Vs in addition to Veracity and Value (“Extracting Business Value from the 4Vs of Big Data”, 2016). Finally, Sivarajah et al. (2017) argue there is a need for a 6th
V: Visualization, as they claim owning the data and analyzing it properly is challenging but once this has been done, visualizing it in a timely and effective manner is one of its most important aspects. Today, most companies thrive to visualize data in real-time, thus making visualization a critical characteristic and a very though-after skill from recruiters (Sivarajah et al., 2017).
11 Other scholars and companies have focused their research and definitions of Big Data based purely on its technological aspect. Microsoft Research (2013) defined Big Data as “the process of applying serious computing power, the latest in machine learning and artificial intelligence, to seriously massive and often highly complex sets of information.”
Chen, Chiang and Storey (2012) defined it as “the data sets and analytical techniques in applications that are so large and complex that they require advanced and unique data storage, management, analysis and visualization technologies” (p. 1166). Dumbill (2013) described it as “data that exceeds the processing capacity of conventional database systems” (p. 1).
We can thus see in this very large array of definitions that scholars still have not agreed upon a common definition and that their views diverge quite substantially.
Two researches bring another dimension: social impact. Boyd and Crawford (2012) state that Big Data is a “cultural, technological and scholarly phenomenon that rests on the interplay of technology, analysis and mythology” (p. 662) while Mayer-Schönberger and Cukier (2013) define it as a “phenomenon that brings three key shifts in the way we analyze information that transform how we understand and organize the society: more data, messier data and correlation overtakes causality”.
Ultimately, Mauro et al. (2016) summarized in their paper all the definitions of Big Data and grouped them into four categories: Information, Technology, Methods and Impacts. They then based their own definition of Big Data on these four categories and described it as “the Information asset characterized by such a High Volume, Velocity and Variety to require specific Technology and Analytical Methods for its transformation into Value” (p. 131). We believe the latter to be the most complete and relevant definition of Big Data to-date and the most in-line with our paper.
When understood and used efficiently, Big Data can be regarded as a major source of competitive advantage for companies as it brings many opportunities.
2.2 The opportunities of Big Data
Scholars are unanimous, Big Data is regarded as today’s new Digital Oil (Yi, Liu, F., Liu, J., & Jin, 2014) and New Raw Material (Berners-Lee & Shadbolt, 2011). In addition to being compared to gold and oil, Big Data is seen as one of the most powerful sources of competitive advantage for companies of the 21st century. It is repeatedly associated with enormous growth
12 opportunities as large tech-companies, such as IBM or Oracle, believe high-value information could be extracted from Big Data given the right tools, processes and skills. Scholars also agree with that assessment (Gandomi & Haider, 2014) and even state that it “changes the way people think about knowledge and research altogether” (Boyd & Crawford, 2012)(p. 665). Lazer, Pentland, Adamic, Aral, Barabási, Brewer, … and Van Alstyne (2009) affirmed that it offers “the capacity to collect and analyze data with an unprecedented breadth and scale” (p.722). Today, Big Data is enabling researchers to analyze, sort and visualize large amounts of data faster and better than ever before. This translates into less tedious tasks for scholars and gives them more time to analyze the data at hand or enables a faster publication of articles for example.
There is a common discourse amongst academics that Big Data will affect every industry or sector in the business world today. From computer scientists to economists, mathematicians, sociologists, physicians to doctors, all will have potential benefits in embracing Big Data, granted that they have the resources to use it. The benefits are endless. Janssen and Kuk (2016) wrote that it has “the potential to fundamentally transform the way organizations make their decisions” (p. 9).
In an Accenture study published in 2014, 89% of respondents rated Big Data as “very important” or “extremely important” to their businesses’ digital transformation, and 82% stated Big Data is a major value-creating source for their companies. According to the research, 94% of executives said Big Data is providing additional ways to identify new sources of revenue, 90% stated it allows their company to acquire more customers ("Companies Are Satisfied with Business Outcomes from Big Data and Recognize Big Data as Very Important to Their Digital Transformation", 2014). A more recent study by Accenture in 2017 has outlined that 89% of users across various industries believe that a successful Big Data implementation will revolutionize the way companies operate. What’s more, they trust the impact on a company’s operations and processes will be as profound as the one internet had almost three decades ago (Slessor, 2017).
As data is generated throughout every internet-based activity today, every sensor and IoT device (Columbus, 2016), the amount of data produced will soon surpass the computing power we currently have to analyze it in a timely and cost-efficient manner. Thus, efficiency is a key characteristic when determining if a company is investing in a value-creating endeavor. This
13 Data Deluge (Sivarajah et al., 2017), if handled properly, will enable us to expose new knowledge, make faster and better decisions and give innovative and actionable insights to businesses (Jukić N., Sharma, Nestorov & Jukić B., 2015).
A UPS Case Study, done in 2013, is one of the best examples of an innovative and value-adding endeavor through the use of Big Data. UPS equipped more than 46 000 delivery vehicles with telematics sensors (Samuels, 2017). In 2013, the company launched its new software called ORION (On-Road Integrated Optimization and Navigation) aimed at redesigning the entire UPS’s drivers route structure and navigation systems. By combining the data from the sensors onboard the vehicle (such as speed, drivetrain performance and braking) with external data (such as traffic management, online mapping and weather conditions), ORION optimized automatically and in real-time every driver’s delivery route. UPS claims the project has led to savings of more than 31 million liters of fuel in 2011 by cutting more than 136 million kilometers from daily routes. The company also estimates that by reducing each drivers’ daily route by only 1.6 kilometers, it can save approximately 25 million euros on a daily basis (Davenport & Dyché, 2013).
According to Chen and Zhang (2014), Big Data will provide rich business intelligence for better-informed business decisions and Brown Chui and Manyika (2011) believe Big Data will create opportunities through value creation. Kumar, Niu and Re (2013) state it will support in enhancing visibility and flexibility of supply chain and resource allocation.
On the one hand, the Dublin City Council has implemented in 2013 a big data analytics solution to better manage the traffic flow of its public transportation services. The solution was based upon the deployment of GPS-systems on all the buses coupled with live cameras providing the ability to gather information on the 1000+ buses in real-time. Controllers can display each bus on a virtual city map, locate areas of congestions and instantly activate the live camera feeds to assess the cause of the delay. The system also automatically generates live arrival times and adjust transit times accordingly. The implementation of this system has allowed the City Council to manage more efficiently its bus fleet through real-time tracking, faster identification of issues and thus faster response-time and reduced emissions. What’s more, the City Council can offer peace-of-mind to the riders as it can provide real-time and accurate arrival times and/or explanations as to what caused a delay ("Big Data Helps Dublin Improve Public Bus Transport Network", 2013).
14 On the other hand, Big Data provides innovative ways to leverage business assets for companies. Some of the real-world applications comprise investment firms embracing social media data. In 2012, Cha indicated that more than 50% of Wall Street investment firms incorporated social media data such as tweets or product reviews on Amazon in their trading activities. It only contributed to less than 2% in 2007.
Another example is through face recognition technology and sensors, stores can track in-store movement patterns and cross-match them to purchasing behavior providing very valuable insights into consumer buying behavior (Kudyba, 2014). This information is leveraged within business decisions such as product placement, promotions, advertising and staffing (Gandomi & Haider, 2014).
To conclude, companies need to include Big Data in their core strategy in order to benefit from it. However, implementing Big Data also brings along many challenges that companies need to face and overcome to ensure success.
2.3 Big Data Challenges
Today, most companies sit on a wealth of data; the difficulty is to know how to effectively analyze it. The latter is referred to as “Big Data Analytics”.
According to Rajaraman (2016), data analytics can be defined as the extraction of knowledge from Big Data and consist of a correlation between different variables. Four types of data analytics can be highlighted.
The first one is descriptive analytics which explains the current state of a business situation to make developments, patterns and exceptions evident, by producing standard reports for instance (Joseph & Johnson, 2013). Secondly, predictive analytics is used to analyze available data in order to explain what is likely to happen in the future. Thirdly, discovery analytics consists of collecting unexpected relationships among variables, as well as collecting data from various sources and analyzing them to provide new information. Finally, optimizing solutions to different problems by using gathered data, is called prescriptive analysis. This analysis can help a company to achieve a certain goal by improving its decision-making process and trying to reduce business expenses. Consequently, data itself is a low-value asset: the only way to extract value from Big Data is to have an efficient data analytics process in order to turn it into
15 meaningful insights and enable faster and/or better decision-making (Gandomi & Haider, 2014).
Kaisler, Armour, Espinosa and Money (2013), explain in their article that the volume of Big Data has vastly increased in the past years since data is created by everyone at any time. This makes the data management process more difficult for structured and unstructured data. Thus, companies need to look for and master new techniques to cope with that increase by developing new skills and nurture employees’ knowledge.
Sivarajah et al. (2017) tackle the subject of challenges for Big Companies to store, analyze, visualize the data in a cost-efficient manner and emphasize the fact that costs are going to be a substantial problem for companies in the future because of the sheer size of the data produced, collected and the need for its analysis. Scholars group Big Data challenges into three main categories.
The first category is related to Data Challenges, which are the basic characteristics of the data itself. They agree with Kaisler et al. (2013), that the high volume of data represents a great challenge for companies. Its variety in forms and sources, such as messages, transactional data (business transactions for instance) and web data (images for example), makes it difficult to comprehend and manage. Moreover, its Veracity, as some sources are inherently unreliable, Velocity, as more and more data is created every second, and Variety as the amount of unstructured data ever-increasing, represent further challenges for companies. This is also discussed by Gandomi and Haider (2014), who explain that Veracity of data imposes companies to connect, match and clean the data from different sources.
Sivarajah et al. (2017), also present another “V”, which is Visualization, stating that analyzing the data is great, but showing quick and easy ways to visualize it so that the information that needs to be transmitted is easy to understand, is another big challenge that leads to wrong decision making. Many factors can influence this challenge such as communication skills, in which the difficulty is to transmit your understanding of Big Data to someone else in the company.
The second category represents Process Challenges, which correspond to capturing, integrating, transforming and selecting the right analysis model and results (Kaisler et al.,
16 2013). However, in order to perform these tasks effectively, one needs to have a broad, though intricate, knowledge of the processes. In other words, acquiring data from diverse sources and storing it for value generation purposes, represents an issue for many companies since warehousing data implies increasing costs. These costs are expected to boom within the next two years as the amount of data produced will grow exponentially. It seems that many companies face inadequate infrastructure and inappropriate data warehouse architecture. This is also outlined by Alharthi et al. (2017), who explain that many companies do not have a clear strategy to address the various sources and formats of Big Data and some firms are even deleting old, but potentially very important, data because of warehousing infrastructure overload. In this sense, Alharthi et al. (2017) and Russom (2011) add that with this new phenomenon, companies need to innovate their processes and change their working procedures. Building effective Big Data Analytics systems and database software able to process all the information quickly, seems to be a great challenge for many companies. Thus, a deep understanding of Big Data Analytics and of the company’s core business model is required to be able to implement the necessary changes and to make the best use of the technology at hand. In other words, organizations encounter a lack of infrastructure readiness, where investments in software and hardware are too low, and where most of the utilized technologies are not designed to process Big Data effectively. Organizations also encounter difficulties when extracting and cleaning the data collected from a large scale of unstructured data and need to integrate the structured data within the business processes.
In this regard, infrastructure readiness can be linked to technological challenges that companies face. New platforms must be built to store high volumes of data and companies need to adapt their technology tools to embrace the volume, velocity and variety of data (McAfee & Brynjolfsson, 2012). Chen, Mao, Zhang and Leung (2014) develop this aspect by outlining the “Data Life Cycle Management issues” which arise from this Data Deluge. Sivarajah et al. (2017) add to this idea, that analyzing and modelling the data once it has been captured, stored, mined, cleansed and integrated will imply new costs for companies since firms need more computing power and more warehousing capabilities. Gandomi & Haider (2014) in their paper, also outline the lack of current computing power and that companies must react accordingly to the further increase of Big Data production within the next few years.
Finally, the third identified category by Sivarajah et al. (2017) is related to Management Challenges that cover security, ethical and privacy issues for instance. The people creating the
17 data are not the ones in control of it. Significant challenges in terms of truth, control and power appear (Boyd & Crawford, 2012). These challenges are also highlighted by Alharthi et al. (2017). The use of personal data can be critical and private information can be revealed easily (Chen et al., 2014). Companies need to guarantee a secured data access and a constant protection of users’ data, in order to avoid ethical challenges where loyal customers can stop trusting a company for instance (Corea, 2016).
Alharthi et al. (2017) add another challenge: Cultural Barriers. Organizational culture has a strong impact on processes, values and norms and where the overall understanding on how Big Data can improve business operations is very low and Big Data resistance exists.
Finally, some authors develop a different challenge that companies encounter. Janssen, van der Voort and Wahyudi (2017) state how a lack of communication and collaboration between the decision-makers and the people collecting the data, can lead to worse outcomes. Data collection, processing and usage are not done within a single department. Instead, data is collected by many parties and organizations might use collaborations and partnerships for acquiring the resources and capabilities for its analysis. All these actors and steps might increase the difficulty of using Big Data for decision-making.
Overall, the quality of data is not only dependent on the data itself, but also on the different ways in which it is collected and processed. Hence, the value that one can extract from the data is solely dependent on that person’s abilities and skills. The various challenges that have been outlined by the existing literature so far, seem to originate from a common issue that companies are facing nowadays. The latter appears to be lack of skills within companies.
2.4 The challenge “lack of skills”
With the rise of Big Data, companies seek for new skills. They try to increase their current analytical workforce with data scientists who possess a high level of IT skills and who can manipulate Big Data technologies. Many organizations realize that traditional quantitative analysts are not enough anymore (Davenport & Dyché, 2013). Since companies not only possess structured data, the difficulty is to have people able to understand and use unstructured data. (Marr, 2016). In this sense, a main challenge for companies is to find employees able to use data and turn it into valuable information. Davenport and Dyché (2013), develop this idea by explaining that companies search for people having the ability to explain Big Data outcomes
18 to executives. The difficulty of this task is to understand the data perfectly and to explain it in an understandable way. This ability is critically important for valuable decision making. By using the term “lack of skills”, existing literature considers the fact that companies today, struggle to find employees able to use Big Data in a sense that will allow the company to gain a competitive advantage, and who are also able to transform data analysis into actions. One key problem is that many firms struggle to explain what skills, knowledge and abilities they are looking for within job postings.
According to Stanton A.D and Stanton W.W (2016), two broad categories of skills exist that companies require.
The first skill category is related to technical competencies, those encompass software development, programming and statistical knowledge, quantitative analysis and the ability of using various statistical and analytical tools. The second category considers personal abilities. These skills are related to communication skills, collaboration and team skills, the ability to provide insights of data in a way that other team members understand it, creativity and the curiosity to solve complex problems. This is related to another issue that various articles highlight when analyzing the lack of skills within Big Data. As previously stated, the lack of communication between the different departments represents a problem for many firms. Organizations struggle, for instance, to implement close relationships between the departments addressing Big Data and the IT department who is supporting them (Davenport & Dyché, 2013). This statement is developed by Pacino (2017), who explains that analyzing Big Data seems only to be related to the executive level within a company and that a lack in analytical training, communication and transmission of information and knowledge exists. This impacts the knowledge of many employees since knowledge between the people who analyze the data and the decision-makers is not aligned. In this regard, decision-makers often lack the necessary skills and do not understand the variables and hence make bad decisions.
Three categories of lack of skills emerged from the reviewed literature.
The first category concerns the lack of employees’ skills. Employees with little to no big data understanding, might represent a real burden to companies. As previously stated, employees either lack in technical or/and personal skills. The lack of employees’ skills can imply errors where information is not correctly placed and where important information can be lost (Alharthi et al., 2017). This idea is also supported by Russom (2011), who explains that inadequate staffing or skills for Big Data Analytics exists, and that this makes Big Data unusable for end
19 users. This again relates to the Veracity of the data seen previously as being one of the characteristics of it but also one of its key challenges.
The second category, which is linked to the lack of employees’ skills, is related to Managerial and Leadership abilities. In this sense, White (2011) analyzed in his article that using data effectively is not only a technical problem but also emerges from management issues. The author states managerial know-how is necessary to handle the high volume of data. Efficient leadership is required in which clear goals need to be set. Communication, general management techniques and knowledge is requested. This is particularly essential to face the communication issue that exists between the different departments and to ensure everyone in the company understands data and knows how to use it. Talent Management also needs to be taken into consideration, where expertise within Big Data must be developed to work with a large quantity of information.
In this sense, managers need to review the decision making to hire the right people with the required knowledge and understanding. If leaders do not adapt their leadership strategies to embrace this new phenomenon, they will probably lose competitive advantage. It seems clear that companies that can combine data science and domain expertise will increase their competitive advantage and surpass their rivals. That implies that companies must change their hiring patterns by focusing on data-driven individuals that are able to bring valuable decision-making information.
However, domain expertise people are often expensive, and employers tend to outsource these activities on a short-term basis. McAfee and Brynjolfsson, (2012), Mauro et al. (2017) and Corea (2016), all agree that companies need to rethink their Human Resources needs and strategies. It seems clear that a skill-set is needed to work within Big Data and competitive companies will be those who have the ability to hire the right people.
Data analytics’ jobs description seem often very vague and the required skills and responsibilities are not clearly outlined. The difficulty is now for managers to think what kind of new people they should hire and how they can increase the skills of their current human resources. Moreover, Corea (2016) insists on the fact that the job market is not yet ready for Big Data since many employers seem to not really know what exactly they are looking for when they seek to hire what are called “Data Scientists”. The author defines Data Scientists as people
20 with strong expertise and the willingness to perfectly understand numbers and able to provide insights based on them. He also explains that they have five main job roles which are the following: computer scientist, businessman, statistician, communication manager and domain expert. That means that these persons will request more time and resources and will cost more because of their expertise and flexibility.
Also, according to Chen, & Zhang (2014), data storage, acquisition, sharing, analysis and visualization seem to be great challenges since it requires highly skilled human resources. Training Big Data Analysts that must have mathematical abilities and professional knowledge about Big Data, seems to take many years. Without Data Analysts, companies do not have the capabilities to explore the existing data and have only limited techniques and tools to solve the different problems.
Lastly, the third identified category by the existing literature is related to technical skills, which is an overlap of the lack of employees’ and management skills. In this sense, Bird (2013) and Mauro et al. (2017) agree that organizations need to implement new analytical methods in order to transform big quantities of information into business value.
On the one hand, this requires “hard skills” where specific data and analytical knowledge is needed. On the other hand, companies need to acquire “soft skills”, where Big Data must be transformed into value creation. It seems important for companies to hire people with both hard and soft skills. Pacino (2017) adds that no stable ground exists within that field and that no improvement in skills appeared within the past few years. The implication of that lack of technical skills seems to be that the demand for people with strong Big Data analytical skills exceeds the supply.
2.5 Definitions
This part summarizes the three main definitions and concepts we have outlined earlier in our paper, and which will be of use for the reader. We have chosen to insert the definitions of the following concepts after having explained them in the literature review to ensure they are perfectly understood by the reader.
• Big Data: Information asset characterized by such a High Volume, Velocity and Variety to require specific Technology and Analytical Methods for its transformation into Value (Mauro et al., 2016).
21 • Big Data Analytics: Big Data Analytics can be defined as the extraction of knowledge from Big Data and consist of a correlation between different variables (Rajaraman, 2016).
• Lack of Skills: We define lack of skills as the challenges companies face, related to the lack of knowledge and understanding, that translates into an inefficient use of Big Data (Marr, 2016).
22
Part 3: Methodology
The goal of doing research is to produce evidence and results. To do so, research uses scientific methods and follows specific rules, in order to avoid that findings are subjective and depend on the personal researchers’ views (Byrne, 2017).
On the one hand, we will explore the benefits and challenges of Big Data and use models to find a clear definition of it. Existing models are for example, the 3Vs, Velocity, Volume and Variety (Laney, 2001), 4Vs with the addition of Veracity (Corea, 2016) and 5Vs (Grobelnik, 2012) with Value. Another theory affecting the development rate of Big Data is Moore’s law as it enables companies to process information faster than ever before.
On the other hand, to gain practical knowledge about that topic we have conducted a qualitative analysis by interviewing people who work in big data-enabled companies. We want to find out how companies face this new phenomenon and how it impacts their current business strategies.
3.1 Research Design
3.1.1 Philosophical perspective
In order to conduct research, it is important to understand philosophical issues. Understanding the philosophy of business research allows to analyze the strengths and weaknesses of each, and how the philosophical assumptions may influence the judgement of the overall research quality (Easterby-Smith, Thorpe & Jackson, 2013).
The research philosophy can for instance, clarify the research designs and recognize which designs will work and which will not.
The main philosophical debates about how to conduct a research, concern ontology and epistemology (Easterby-Smith et al., 2013).On the one hand, the book defines ontology as the philosophical assumptions about the nature of reality and four different ontological views exist. We have chosen the concept of Relativism within our research, since we believe that related to our research question, many truths exist and that facts depend on the viewpoint and perception of the observer. For example, the potential lack of skills within Big Data that might exist in various companies, is perceived differently in each firm and from each manager.
On the other hand, epistemology can be defined as the way that we address the reality. Within epistemology, we have decided to adopt the concept of Constructionism. Constructionism accepts value from various data sources and allows us to make some generalizations beyond
23 the present sample for instance. In this sense, we believe that both, Relativism and Constructionism fit together since their starting point is to question a phenomenon and that collected data mainly consists of words. Furthermore, the analysis and interpretation of data is done through triangulation and comparisons as our statements are only based on the different perspectives and opinions we gathered. There may be many different realities, so as researchers, we had to gather the various perspectives and collect the views and experiences of diverse companies. Lastly, the searched outcome of these two concepts is that the research should generate theory (Easterby-Smith et al., 2013).
The objective of our study is to explore what happens in practice that could add something new to the theory. In this sense, we have decided to conduct an explorative study.
3.1.2 Research Approach
Concerning our research approach, we have decided to use an inductive research approach. According to Ruse (2015), with inductive theory approach, data is interpreted in order to generate findings and is compared afterwards and modified through additional data collection and analysis. Inductive approach is in this sense, a comparative analysis. Through the literature review, we have found a gap concerning the challenges that are related to the lack of skills, that various enterprises face when implementing Big Data in their business strategy. Our objective was to explore this gap and gather, understand and analyze data in order to compare it to the literature review. This allowed us to see if the gap is filled and where further research is needed. We wanted to avoid being influenced by the theory when we conducted interviews since our goal was to explore a new phenomenon.
3.1.3 Research Strategy
The objective of our research strategy is to adopt a plan allowing us to answer our research question.
Since our purpose is to conduct an explorative study, we aim to get opinions and perspectives to understand a common behavior from a relatively small sample, rather than gathering numerical data from a large sample. In this regard, we have decided to conduct a qualitative study through in-depth interviews, which we will analyze by reading and interpreting them as narratives.
24 Qualitative interviews can be defined as directed conversations based on questions and answers about a specific topic (Easterby-Smith et al., 2013).
We believe that these interviews represent an opportunity for mutual discovery, understanding and reflection on our topic. We are not only interested in understanding the respondent’s perspective and viewpoint, but also in the reason why, he or she, has this specific viewpoint. Relating the research strategy to our research question, our objective is to understand the opinions and perspectives of the various companies we have interviewed, about why a lack of skills within the use of Big Data exists in companies nowadays, and how they are handling this challenge.
In order to successfully gather qualitative data, we aimed to obtain trust from our interviewee, especially when we have never met each other before. We both believe that only if the respondent is trusting us, he/she will provide us with the requested information. Moreover, we both paid attention to adopt an appropriate attitude and language, to appear knowledgeable and sensitive.
3.2 Methodology
We believe that the exploratory study is the most relevant methodology for our research as we are looking to explore a new phenomenon and not verify an existing theory. We are conducting a qualitative explorative study by interviewing people with questions that are not based on our literature review. Thus, we are not looking to test an existing hypothesis or theory but rather try to build our own perspective through the exploration of this new phenomenon. In other words, we want to construct knowledge rather than simply reveal it.
3.3 Method
3.3.1 Sampling Method
We chose to use non-probability sampling designs and more specifically purposive sampling for the selection of our interviewees.
As we have a clear idea of what sample units are needed according to the purpose of our study, we believe purposive sampling is the most appropriate for our research. The latter involves identifying and selecting individuals that are very knowledgeable about or experienced in a certain phenomenon (Cresswell & Plano Clark, 2011). Besides knowledge and experience, availability and willingness to participate was also an important aspect of our sampling method.
25 What’s more, it ensured these people were willing to share experiences and opinions in an articulate and reflective manner (Bernard, 2017 and Spradley, 1979).
Thus, we have identified and approached specific sample units according to our eligibility criteria. Within the purposive sampling, we chose to opt for criterion sampling as we wanted to ensure the interviewees were pertinent for our research and would provide relevant data to analyze (Easterby-Smith et al., 2013).
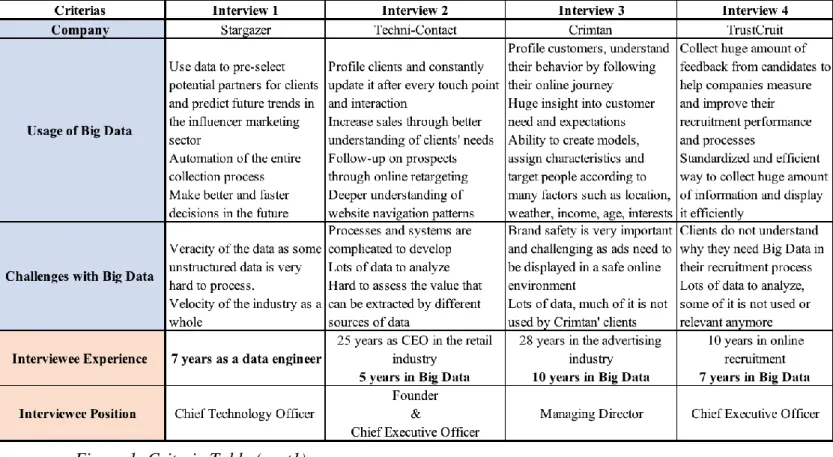
We defined five eligibility criteria. The first three criteria were that the respondent is working in a company at the moment of the interview to ensure he is exposed to this phenomenon, this company is using Big Data and is facing challenges within its use. The second set of criteria was more individual-related. The interviewee had to be knowledgeable about Big Data, which we defined as having worked with Big Data for more than five years, since only knowledgeable respondents will be able to provide pertinent information and have an executive position in the company he/she was working in. This guarantees all respondents have a strategic position, allowing them to have a global vision of the company’s strategy. We define executive position as President, Vice President, CEO, Managing Director, Head of Department or Department Director. (see criteria table below)
26 Figure 1: Criteria Table (part1)
27
3.3.2 Interview Design
As stated earlier, we aim to do qualitative interviews with a purposive criterion-based sampling method. We opted for qualitative as it allows us to have in-depth discussions and interviews with our sample units. For the purpose of our study, we aimed at the creation of primary data through the interview process. As we are doing an exploratory study, primary data is essential to our research. However, we also gathered some secondary data through existing information that is not produced by us. Company websites and LinkedIn profiles are examples of secondary data we collected.
Even if we made sure our interviewees are knowledgeable about Big Data, we wanted to be as clear and comprehensible as possible in our choice of questions and terminology used. We avoided any jargon and slang words in the questions as well as in our official communication with all interviewees. Not only does this make it simpler for the readers in the future, but it also facilities our interviewees’ understanding of the questions and made it simpler for him/her to answer in a relevant manner. We also sought to avoid leading questions or biased questions through the use of objective words and vocabulary as this could have also influenced the person’s responses.
For the development of our interview questions, we decided to conduct a pilot interview. On the one hand, this allowed us to validate our questionnaire and assess potential responses. It helped us to calibrate and reformulate some of the questions to ensure they were comprehensible and would not lead our interviewees to a certain direction. On the other hand, it enabled us to confirm the relevancy of our study since the interviewee shared the idea that Big Data challenges are an important issue in the business world today and their origin is still quite vague.
We have developed a semi-structured interview (see Appendix 3) with questions that promote open-ended answers for two main reasons. First, we have developed an interview schedule with some questions we thoroughly wanted the interviewee to answer as those would be the basis for our analysis. We have however formulated some follow-up questions based on some potential answers while always giving ourselves the opportunity to ask further questions on a particular topic of interest that the interviewee might have addressed but that we did not expect. Secondly, we want the person to communicate freely and reflect upon our topic throughout the
28 entire interview and semi-structured seemed to be the most flexible way to reiterate questions when needed while having a clear strategy (Easterby-Smith et al., 2013).
We followed the funnel approach to design our interview process and questions. This approach is often recommended when conducting semi-structured interviews as it begins with a broad view of the topic and then proceeds to narrow down the conversation to very specific components of the topic (Spradley, 1979).
We have developed three sections in our interviews: opening questions, key topic questions and closing questions. We aimed at having the opening questions to serve as “icebreakers”, build trust as well as set a comfortable and stress-free environment. It was also the opportunity to further inquire about the company in which the person was working and understand better the use of Big Data. The second section introduced our main topic: lack of skills. This section was split into two parts: the first being a broad question about the challenges the company was facing, and the second part dived deeper into the potential lack of skills the company was experiencing and what it was doing to cope with it.
The third section contained two questions that served as reflection questions allowing the person to talk more broadly about the subject again.
Throughout the entire discussion, we have both used the probes technique as it enabled us to confirm a saying or information the interviewee gave us earlier in the interview and ensure its validity. We also used the laddering technique to further dig into a particular phenomenon or response. By laddering up, a researcher will help the respondent move from statement of facts to start revealing the individual’s value base. We did the latter by asking “why” questions. By laddering down, a researcher seeks to obtain examples and thus gather more detailed description of a particular events. This helps explore a person’s understanding of a particular construct. We also applied the laddering down strategy when asking how the company uses Big Data but also by asking for an example of a potential lack of skills the interviewee depicted earlier in the interview.
Most of our interviews were done through Skype as we could not meet the interviewee face to face because of location-related factors. We are aware that having a discussion over Skype is less personal and establishing trust is harder, but we made sure to be as polite, accommodating and sensitive as possible. By establishing an early contact and communicating with the person
29 multiple times before the interview, we had already established a certain degree of trust (Easterby-Smith et al., 2013).
Remote interviews have however a multitude of advantages. First of all, convenience for both parties. We did not want the person who accepted to discuss this topic with us to invest anything more than time and Skype interviews are the most convenient process we could think of. Secondly, it allowed us to interview people in Dubai, Paris, Atlanta and San Francisco while being in Sweden which is a substantial advantage. Thirdly, it provided us with the ability to be more thorough in our eligibility criteria as we were not restricted by location or any economic investment required for travel.
We have created an Interview Design table (see Appendix 1) with all the relevant information including company-related (such as location and scope of work), person-related (such as name and nationality) and interview-related intelligence (such as length and communication method used).
3.4 Data Collection
We have conducted eight interviews in total with nine people. The interviews were done between the 21st of March 2018 and the 19th of April 2018. The length ranged from 32 minutes
to 71 minutes with an average of 54 minutes per interview (see Appendix 1).
Seven interviews were done through Skype and one was done face to face. We performed three interviews in French as it was more convenient for the interviewees and five in English. As stated earlier, all interviews were recorded, with the approval of all parties involved, and transcribed shortly afterwards.
3.5 Data Analysis
After the collection of primary data through remote or face to face discussions, we applied a content analysis to our transcripts and notes. It is an approach that aims at drawing systematic inferences from qualitative data that has been structured by a set of ideas or concepts (Easterby-Smith et al., 2013).
The first step is usually to define a number of criteria and select relevant material for the analysis. The aim being to outline factors or concepts to answer the research question. Once these factors are identified, a matrix can be created and used to start drawing out connections
30 and easily identifiable content. This approach also gives us a great degree of flexibility as we can assign certain levels of importance per question answers. We aimed at using the indexing technique by looking for the number of occurrences of certain words or phrases in the data we gathered. This helps bringing a common phenomenon to light (Easterby-Smith et al., 2013). As we are exploring a field that has not been explored before, we also have a certain degree of flexibility as we can shape the nature of our analysis and then start drawing connections back to the frameworks we discussed in the literature review. This also stands with our more exploratory inductive approach on an overall basis.
3.6 Description of Analysis Strategy
3.6.1 Analysis Procedure
3.6.1.1 TranscriptsIn order to analyze the data we gathered through our interviews, we first thoroughly transcribed each interview we conducted and reviewed the content we had written down. The transcripts made sure we did not forget important aspects discussed during the interviews and ensured we were as objective as possible with our overall analysis process. What’s more, it made our entire analysis easier. Both of us took the time to carefully read the transcripts on our own in order to get familiar with the content. Next, we brainstormed about what we have understood by reading the various transcripts and then reflected about it on our own.
3.6.1.2 Coding
We started the content analysis through the coding technique. To do so, we went through the transcripts together and started assigning codes for any content that seemed relevant to us and would help us answer our research question. After having done that, we discussed the founded codes and started to brainstorm about our coding techniques and potential improvements. We allowed ourselves one day before finalizing the coding. Then, we discussed potential new codes, added the ones that seemed relevant and deleted the ones that were actually not necessary for our research.
31 3.6.1.3 Identified categories
The next step was to write down all selected codes on a whiteboard in order to have a clearer overview allowing us to figure out potential connections and differences between them. This enabled us to group the similar codes into one category which became our sub-categories. Afterwards, we consolidated our sub-categories and made sure each of them was relevant. We also wanted to assess if there was a need for any additional ones. Finally, we created our categories and main categories. The latter emerged from identifying implications and common points between all of the sub-categories.
3.6.2 Creation of sub-categories
In this part, we will discuss our coding strategy and detail how we proceeded.
To do so, we chose to illustrate our strategy through the table below in which we highlighted four examples that explain how we coded the content of the interviews and how we came up with sub-categories.
We will take you through our thought process and how we built the sub-category “predict the future” out of the responses from the interviewees.
As you can clearly see in the samples of codes used column, “predict things”, “the outcome is more predictable” and “predict the future” all share the same idea which is “predict the future”. This common idea is the genesis of our sub-category “predict the future”.
We have applied the same strategy to build all of our sub-categories. We believe sub-categories are essential to our work as they are the first step to building categories and main categories enabling us to go deeper into the analysis and interpretation.
32 Figure 2: Examples of coding strategy and resulting sub-category
33
Part 4: Ethics and Trustworthiness
4.1 Ethics
In this part we focus on the ethical issues that can arise within in our research. It seems clear that our thesis will not undertake studies which could harm peoples’ lives, still we want to avoid any other kind of personal or economic harm.
First of all, we want that potential respondents are fully told about the purposes of the research, what we try to find out through eventually interviewing them, their role within the research, the required time for conducting an interview, as well as potential benefits and risks.
All our respondents must be given the opportunity to agree to taking part in research. To do so, we have created a consent form (see Appendix 2) which was sent to all interviewees a few days before the interview. Reading the consent form gives potential respondents the possibility to withdraw their participation at any time. In this regard, an interview only took place if the respondent has sent us back the signed document.
It seems important to inform respondents about potential risks, more specifically about the nature of risks in terms of severity and their likelihood in terms of occurrence (Byrne, 2017). In our case, we have not identified any risks for respondents when taking part in our research, apart from risks related to the confidentiality and anonymity of communicated information. To assess these risks, a whole paragraph is dedicated to confidentiality, where we want to guarantee that all communicated information that the respondent does not want to be published, will be kept confidential and anonymous. If wished so, we also guarantee that the participants cannot be identified from the information provided and send a contractual commitment that the information will be anonymized (Byrne, 2017). In this sense, once the interview was finished, we always sent an email to the participant, to confirm if we can use her/his name, or if she/he prefers to stay anonymous. In addition, for analysis purposes, we wanted to record all interviews. However, we always asked for the respondents’ agreement and no interview was recorded without the respondents’ willingness. In other words, we wanted the respondent to be aware of how we are conducting our research and the different steps we took.
34 Overall, we paid attention to ensure that no harm comes to participants, by not publishing any information that is likely to harm the interests of the individuals, and by protecting their privacy. Moreover, we aimed to be honest and communicated in fully transparency with them (Byrne, 2017).
4.2 Trustworthiness & quality of research
It seems clear that if we want our research to be relevant, credible and interesting to others, it must be useful to the readers (Easterby-Smith et al., 2013).
The research quality is mainly determined by the concept of trustworthiness (Shenton, 2004). According to Lewis-Beck, Bryman and Liao (2004), the trustworthiness of a research is based on four criteria, namely credibility, transferability, dependability, confirmability. These criteria could be defined as the standards allowing to judge qualitative inquiries, the rigorousness of the findings, methodological concerns and the overall measure of the adequacy of study. In this sense, it is important to meet these four criteria to justify the work is worthy of attention. Hence, to describe and evaluate the quality of our research methods and explain the reason why we have employed these methods, we use the concept of trustworthiness in our study.
4.2.1 Credibility
Credibility refers to the idea that readers and research participants should be able to understand why certain models and methods have been used, and why participants have been selected. In other words, this criterion should prove that our work is believable and that statements are accurate so that our research design makes sense for readers and participants (Given, 2008). To do so, we aimed to apply the most appropriate and coherent research method, allowing us to explore our topic in depth. Moreover, we have put much emphasis on selecting suitable participants that are relevant for our study and who are allowing us to obtain truthful responses. Therefore, we have only conducted interviews with people being in an executive position, working daily with Big Data and with a deep knowledge within that field. Because most companies are in a transition phase, we believe that interviewing people in an executive position will give us a strategic insight into the company’s vision and business strategy.
35
4.2.2 Transferability
Transferability takes two elements into account: the relevance of our respondents, as well as the ability to provide a complete understanding of the context being studied and ensuring that the research question is appropriately answered. In other words, it allows to prove that our study is useful (Given, 2008). In this regard, it seems important to provide a comprehensible description of the method used. Therefore, we paid attention to provide sufficient details about the data collection and method of analysis. In addition, we will provide background information about the respondents, justifying our selection choices. We believe that with that done, the reader can determine whether our method is applicable for another context.
4.2.3 Dependability
Dependability refers to the traceability and logic of the research process. It considers that researchers must be conscious of changes in the environment which can imply changes in methodology. It also refers to the reproducibility of the study for other researches (Given, 2008). Since qualitative research is conducted in changing environments, replicability is affected (Shenton, 2004). In this regard, we must be aware that the interviewee’s answers might change in the future. Especially, because in our work, we aim to get opinions and perceptions about a phenomenon. Therefore, we provided a detailed description of our method, data collection and analysis. In other words, in order to repeat a study, Given (2008) states that environmental- and context changes must be considered by researchers. We believe we provided sufficient information about our research design so that the reproducibility is possible.
4.2.4 Confirmability
Confirmability allows to certify that the collected data in the research can be verified all the way back to the original data sources, such as records or transcripts for instance (Given, 2008). We did not want to influence or lead the interviewee towards a specific direction during the conducted interviews. To do so, we always started the interview with broad questions to introduce our subject and adopted a semi-structured interview design, in order to be as flexible and open as possible. Furthermore, we wanted to avoid stressing the respondents while answering our questions, by giving them the time to reflect before asking follow-up questions. In addition to that, we have recorded every interview to facilitate the potential verification of
36 the collected data. Overall, we believe that our processes prove that the findings are only determined by the participants’ answers and were not modified from our side.