ContentslistsavailableatScienceDirect
NeuroImage
journalhomepage:www.elsevier.com/locate/neuroimage
Diffusion-informed
spatial
smoothing
of
fMRI
data
in
white
matter
using
spectral
graph
filters
David
Abramian
a,b,∗,
Martin
Larsson
c,
Anders
Eklund
a,b,g,
Iman
Aganj
d,e,
Carl-Fredrik
Westin
f,
Hamid
Behjat
h,f,d,∗a Department of Biomedical Engineering, Linköping University, Linköping, Sweden
b Center for Medical Image Science and Visualization, Linköping University, Linköping, Sweden c Centre of Mathematical Sciences, Lund University, Lund, Sweden
d Martinos Center for Biomedical Imaging, Massachusetts General Hospital, Harvard Medical School, Boston, USA e Computer Science and Artificial Intelligence Lab, Massachusetts Institute of Technology, Cambridge, USA f Department of Radiology, Brigham and Women’s Hospital, Harvard Medical School, Boston, USA g Department of Computer and Information Science, Linköping University, Linköping, Sweden h Department of Biomedical Engineering, Lund University, Lund, Sweden
a
r
t
i
c
l
e
i
n
f
o
Keywords:Functional MRI Diffusion MRI White matter Graph signal processing Anisotropy
a
b
s
t
r
a
c
t
Brain activation mapping using functional magnetic resonance imaging (fMRI) has been extensively studied in brain gray matter (GM), whereas in large disregarded for probing white matter (WM). This unbalanced treatment has been in part due to controversies in relation to the nature of the blood oxygenation level-dependent (BOLD) contrast in WM and its detectability. However, an accumulating body of studies has provided solid evidence of the functional significance of the BOLD signal in WM and has revealed that it exhibits anisotropic spatio- temporal correlations and structure-specific fluctuations concomitant with those of the cortical BOLD signal. In this work, we present an anisotropic spatial filtering scheme for smoothing fMRI data in WM that accounts for known spatial constraints on the BOLD signal in WM. In particular, the spatial correlation structure of the BOLD signal in WM is highly anisotropic and closely linked to local axonal structure in terms of shape and orienta- tion, suggesting that isotropic Gaussian filters conventionally used for smoothing fMRI data are inadequate for denoising the BOLD signal in WM. The fundamental element in the proposed method is a graph-based descrip- tion of WM that encodes the underlying anisotropy observed across WM, derived from diffusion-weighted MRI data. Based on this representation, and leveraging graph signal processing principles, we design subject-specific spatial filters that adapt to a subject’s unique WM structure at each position in the WM that they are applied at. We use the proposed filters to spatially smooth fMRI data in WM, as an alternative to the conventional practice of using isotropic Gaussian filters. We test the proposed filtering approach on two sets of simulated phantoms, showcasing its greater sensitivity and specificity for the detection of slender anisotropic activations, compared to that achieved with isotropic Gaussian filters. We also present WM activation mapping results on the Human Connectome Project’s 100-unrelated subject dataset, across seven functional tasks, showing that the proposed method enables the detection of streamline-like activations within axonal bundles.
1. Introduction
Todate,reportsontask-basedfunctionalmagneticresonance imag-ing(fMRI)activationmappingandresting-statefunctionalconnectivity havebeenoverwhelminglyrestrictedtothegraymatter(GM),whereas whitematter(WM)functionaldatahavebeenlargelyignoredortreated asanuisanceregressor.SuchunbalancedtreatmentoffMRIdatawithin GMandWM,dueinparttocontroversiesinrelationtothesourceofthe
∗Corresponding author.
E-mail addresses: david.abramian@liu.se(D. Abramian), hamid.behjat@bme.lth.se(H. Behjat).
BOLDsignalinWM,hasledtoasystematicunderreportingof BOLD-relatedactivityinWM(Gawryluketal.,2014;Mazerolleetal.,2019).
Despite past controversies, evidence provided by an increas-ing body of recent studies, see e.g. Grajauskas et al. (2019) and Goreetal.(2019)andreferencestherein,hasledtomorewidespread ac-ceptanceofthedetectabilityandfunctionalrelevanceoftheBOLDsignal inWM.Forexample,Dingetal.(2013)showedthatresting-stateBOLD signalsinWMexhibitstructure-specifictemporalcorrelationsalongWM tracts,whichcoincidewithfiberpatternsrevealedbydiffusiontensor imaging(DTI),andwhich,underfunctionalload,becomemore
pro-https://doi.org/10.1016/j.neuroimage.2021.118095.
Received 16 November 2020; Received in revised form 7 March 2021; Accepted 13 April 2021 Available online 14 May 2021.
nouncedinfunctionallyrelevantstructures(Dingetal., 2016).More specifically,Mishraetal.(2020)showedthatvaryingexperimentaltask parametersresultsinacoupledmodulationoftheBOLDsignalinthe visualcortexandrelevantWMtracts,corroboratingpastfindingsof si-multaneousBOLDactivationsinstructurally-connectedregionsofGM andWM(Mazerolleetal.,2010).Morerecently,ithasbeenshownthat functionalneuroplasticity,asmanifestedbychangesintheBOLDsignal, canbedetectedinWM(Frizzelletal.,2020).Furthermore,agrowing numberofrecentstudieshaveshownthatlowfrequencyBOLD fluctu-ationscanbeusedtoestimatethedynamicfunctioningoffibertracts (Goreetal.,2019),inbothhealth(Huangetal.,2018b;Lietal.,2020b; Marussichetal.,2017)anddisease(Gaoetal.,2020;Jietal.,2019; Jiangetal.,2019), providingapowerful meanstostudyhow infor-mationistransferredandintegratedbetween functionallyspecialized cortices.
DuetothesignificantlylowervascularizationdensityinWM com-paredtothatinGM(Jochimsenetal.,2010;LogothetisandWandell, 2004),theoverallmagnitude of theBOLDsignal inWMis substan-tiallylower thanthatin GM(Yarkoniet al.,2009),which hasbeen reportedtobe aslowas10%ofthatobservedinGMandmodulated asafunctionofdistancefromthecorticallayer(Lietal.,2019b).In additiontobeingweak,theBOLDsignalinWMisaffectedbyunique confoundingfactors,suggestingtheneedforWM-tailoredacquisition andprocessingschemes.Broadlyspeaking,theBOLDcontrastandits detectioninWMcanpotentiallybeenhancedinthreeways:i) devel-opmentanduse ofMRI sequencesoptimalforfMRI ofWM(e.g. in-creasedT2-weighting(Gawryluketal.,2009)ortailoredfieldstrengths (Mazerolleetal.,2013));ii)designoftemporalmodelsthataccountfor theuniquehemodynamicresponsefunction(HRF)inWM,which sub-stantiallydiffersfromthatinGM(Erdoğanetal.,2016;Fraseretal., 2012;Yarkonietal.,2009));andiii)designofspatialmodelsthat ac-countfortheuniquespatialfeaturesoftheBOLDcontrastinWM,which ishighlyanisotropic(Dingetal.,2013;2016).Thispaperfocusesonthe thirdcategory,presentingthecasefortheimportanceofspatialfilter designwhenhandlingfMRIdatainWM,particularlyinrelationtothe inherentdifferencesbetweenthespatialprofilesofBOLDsignalinWM relativetothoseinGM.
1.1. SpatialsmoothingtailoredtofMRIdatainwhitematter
Typical fMRI analysis pipelines rely on the assumption that the BOLDsignalexhibitsisotropicspatialprofilesatfocalactivatedregions (Carp, 2012). Isotropic Gaussian kernels applied to functional data, whichisastapleofconventionalfMRIanalysis,isonlyjustifiedunder thisassumption,andgenerallytradesspatialspecificityforincreased sensitivity.Inparticular,byvirtueofthematchedfilterargument, spa-tialfiltersareoptimalonlyfordetectingactivationsthatconformtothe sizeandshapeofthefilterkernel,andcanotherwiseresultinlossof informationregardingthespatialextentandshapeofactivationareas (Geissleretal.,2005;Mikletal.,2008),obliteratingallnon-smooth sin-gularitiesinthedata.
Inordertoimproveonthesensitivity-specificitytrade-off afforded byconventionalisotropicspatialsmoothing,multiplesmoothing meth-ods that adapt to local spatial image features have been proposed. These include steerable filters (Knutsson et al., 1983), which en-abledirectionally-adaptivespatialsmoothing(Abramianetal.,2020b; Eklund et al., 2011; Friman et al., 2003; Zhuang et al., 2017), wavelettransforms(Bullmoreetal.,2004;Mallat,1989),whichtryto strikeabalancebetweenlocalizationinspaceandfrequencydomain (Breakspear etal.,2006;Ruttimannetal.,1998;VanDeVilleetal., 2004),andnon-linearfilters(e.g.bilateralfilters)thatlocallyadaptto variousfeaturesofadjacentvoxels(Lohmannetal.,2018;Rydelletal., 2008;SmithandBrady,1997).Whilesuchmethodshavebeen success-fullyappliedtoGM,theiradaptivepropertiesrelyonthespatialfeatures manifestedbytheBOLDcontrast.Giventhatthiscontrastis
substan-tiallyreducedinWM,theeffectivenessofthesemethodswouldlikely bereducedwhenappliedtofMRIdatainWM.
Rather thanadaptingthesmoothingoperationtofeaturespresent intheBOLDcontrast,alternativeadaptivesmoothingapproachescan be leveragedthatincorporateinformationfromthedomainonwhich thedatareside,typicallyprovidedbycomplementaryanatomical im-ages.Onecommonapproachiscorticalsurfacesmoothing,whichhas showntoprovideincreasedsensitivityandspecificity(Coalsonetal., 2018; Joetal., 2007).Suchmethodshavealsobeen usedto formu-latesmoothingapproachesthatrespecttissueboundaries(Behjatetal., 2019),preventingartifactsresulting fromthemixingofsignalsfrom adjacentbutdifferingtissuetypesduringfiltering.Inbothofthese sce-nariostheanatomicalinformationisprovidedbyT1-weightedimages.
Animportantdistinguishingfeature oftheBOLDsignalinWMis thatitexhibitsaspatialcorrelationstructuregrosslyconsistentwiththe directionsofwaterdiffusion,asmeasuredbyDTI(Dingetal.,2013), whichispresentduringrestandbecomesmorepronouncedunder func-tionalloading(Dingetal.,2018;Wuetal.,2017).Theanatomicalbasis forthisobservationcanbethatuptohalfofthebloodvolumeinWM re-sidesinvesselsthatruninparalleltoWMtracts(Doucetteetal.,2019). Asaconsequence,conventionalisotropicGaussianfiltersmayprove es-peciallyunsuitedforthetaskofincreasingtheSNRoftheBOLDsignal inthehighlyanisotropicWMdomain.Filteringmethodsadaptiveto fea-turesoftheBOLDsignalmayprovemoreeffective,butthelowBOLD contrastmanifestedinWMwillpotentiallylimittheirusefulness.Onthe otherhand,thestronganatomicaldependenceinthecorrelation struc-tureoftheBOLDsignalinWMsuggeststhatdomain-informed smooth-ingmethodscanbeparticularlybeneficial.Suchmethodscanrelyon T1-weightedimagesaswellasdiffusion-weightedMRI(DW-MRI)toadapt thefilteringtothemorphologyandtheaxonalmicrostructureofWM, respectively. Thispaperpresents thedesignandvalidation ofsucha filteringscheme.
1.2. Structure-informedprocessingoffMRIdatathroughGSP
Inthepastfiveyears,anincreasingnumberofstudieshave show-casedtheuseofprinciplesfromtherecentlyemergedfieldofgraph sig-nalprocessing(GSP)withinneuroimaging,inparticular,inproposing intuitivemethodologiesforstructure-informedprocessingoffMRIdata. ThefundamentalideainGSPistoanalyzedatarecordedatadiscreteset ofpositionsinsuchwaythattheunderlyingstructuralrelationship be-tweenthosepositionsisaccountedfor,whereinthisunderlyingstructure canberepresentedintheformofagraph,i.e.,astructureconsistingofa setofverticesandedges.WereferthereadertoShumanetal.(2013)for anintroductiontoGSPandtoOrtegaetal.(2018) andStanković etal., 2020 foranoverviewofrecentdevelopments,challenges,and applica-tions.
Anincreasingnumberofstudieshaveproposedtheuseofregionof interest(ROI)basedstructuralconnectomes(Spornsetal.,2005), de-rived fromtractographydata, asunderlyingbackbones for interpret-ing fMRI data (Abdelnour et al., 2018; Atasoy et al., 2016; Huang etal.,2018).Whenstructuralconnectomesareinterpretedasgraphs, anumberoftheirLaplacianeigenvectorsmanifestspatialpatternsthat arereminiscentofwell-establishedfunctionalnetworks,asshownby Atasoyetal.(2016).Underthisframework,methodshavebeen pro-posedfor spatio-temporaldeconvolutionof fMRIdata(Boltonetal., 2019),quantificationofthecouplingstrengthofresting-statefMRIdata withunderlyingstructure(Medagliaetal.,2018;PretiandVanDeVille, 2019),implementationofneuralfieldmodels(Aqiletal.,2021), predic-tionofbraindisorders(ItaniandThanou,2020)orbehaviorallyrelevant scores(BoltonandvanDeVille,2020),andforcharacterizationof func-tionalconnectivitydynamicsinhealth(Huangetal.,2018b),andits changes,forinstance,duetoconcussion(Sihagetal.,2020),andunder hallucinogenicdrugs(Atasoyetal.,2017).
Asalternativestomacro-scaleROI-basedgraphs,anumberof voxel-wisebraingraphdesignshavebeenproposedforanalysisoffMRIdata.
GraphsencodingGMmorphologyhavebeenproposedforenhanced ac-tivationmappinginGM,forbothgroup-level(Behjatetal.,2015)and subject-level(Behjatetal., 2014;2013)analyses,andfor discrimina-tivecharacterizationoffMRIdataacrossfunctionaltasks(Behjatand Larsson, 2020).A closely related work tothat presented here is by Tarunetal.(2020),inwhichDW-MRIdatawereusedtoencodethe WMfiberstructure,forthetaskofvisualizingWMfiberpathwaysbased onthefunctionalactivityobservedatthecorticallayer.
1.3. Aimandoverview
Tothebestofourknowledge,nomethodhastodatebeenpresented tospecificallyaccountforthespatialfeaturesoftheBOLDcontrastin WMwhenitcomestospatialprocessingoffMRIdata.Themain objec-tiveofthisworkistopresentthecasefortheimportanceofspatialfilter designwhenhandlingfMRIdatainWM,particularly,inrelationtothe inherentdifferencebetweenthespatialprofilesofBOLDsignalinWM relativetothoseinGM.
Inthispaper,wedevelopanadaptivespatialsmoothingmethod tai-loredtotheprocessingoffMRIdatainWM.Usingdiffusionorientation distributionfunctions(ODF)obtainedfromhighangularresolution dif-fusionimaging(HARDI)data,weconstructsubject-specificvoxel-wise WMgraphs.Aspectralheatkernelfilteristhendefinedonthespectrum oftheresultinggraphs,andimplementedinacomputationallyefficient wayforthetaskoffMRIdatafiltering,usingprinciplesfromGSP.When instantiatedatanypositionwithintheWM,theproposedfiltersadaptto thelocalaxonalorientation,becomingconsistentwiththespatial cor-relationstructureoftheBOLDsignalinWM.
Theremainderofthispaperisorganizedasfollows:inSection2, wereviewrelevantGSPprinciplesanddescribeourproposedgraphand filterdesigns,aswell astheconstructionof phantoms.InSection3, weexaminethesmoothingfiltersproducedbytheproposeddesignand evaluatetheirperformanceonphantomsoftwotypesandonrealtask fMRIdata.Weconclude thepaperinSection4 withadiscussionon designconsiderations,limitationsandfuturework.
2. Materialsandmethods 2.1. Dataandpreprocessing
Datausedinthepreparationof thisworkwereobtainedfromthe WU-MinnHumanConnectomeProject(HCP)(VanEssenetal.,2013) database1.Weusethe100unrelatedadultsubjectsub-group(54%
fe-male,meanage=29.11±3.67,agerange=22–36),whichwedenote astheHCP100subjectset.Fiveofthesubjectswereexcludeddueto incompleteWMcoverageof theDW-MRI data,leavingatotal of95 subjects.TheHCPdataacquisitionstudywasapprovedbythe Wash-ingtonUniversityInstitutionalReviewBoardandinformedconsentwas obtainedfromallsubjects.Weusedtheminimallypreprocessed struc-tural,taskfMRI,andDW-MRIdata.TaskfMRIdataforeachsubject con-sistof1940timeframesacrosssevenfunctionaltasks:Emotion, Gam-bling,Language,Motor,Relational,Social,andWorkingMemory, com-prising23experimentalconditionsintotal.Themethodproposedinthis paperheavilyreliesontheaccurateco-registrationbetweenthe struc-turalandfunctionaldata,asprovidedbytheminimallyprocessedHCP data.Theimagingparametersandimagepreprocessingstepshavebeen thoroughlydescribed byGlasseretal.(2013). Alldataprocessing in thisworkwasdoneusingtheMATLABsoftwareandtheSPM12 tool-box2.DiffusionODFs weregenerated usingthemethod presentedby Yehetal.(2010) andimplementedin theDSIStudiosoftware pack-agee3.
1 https://ida.loni.usc.edu/login.jsp
2 https://www.fil.ion.ucl.ac.uk/spm/software/spm12/ 3 http://dsi-studio.labsolver.org
TheHCPpreprocesseddataareprovidedinamixtureofthreespatial resolutionswithintwoneurologicalspaces(ACPC,i.e.,nativesubject space,andMNI):0.7mmisotropicACPCforthestructuraldata,1.25mm isotropicACPCfortheDW-MRIdata,and2mmisotropicMNIforthe fMRIdata. Afundamentalnecessityfortheproposed methodologyis toreconcilethethreedatasetsintoasinglesetofworkingparameters. However,theresamplingprocessandthenonlinearconversionbetween ACPCandMNIspaceshavethepotentialofnegativelyaffectingthedata quality.Thenumberofvoxelsisalsoarelevantparameter,asit deter-minestoagreatextentthememoryusageandcomputationtimeofthe variousprocessing steps. Giventheimportanceofaxonal orientation informationtotheproposedmethod,weprioritizedminimizingthe ma-nipulationsappliedtotheDW-MRIdata.
Basedontheseconsiderations,wechosetheACPCspaceatthe reso-lutionofthediffusiondata,i.e.,1.25mmisotropic,astheworkingspace. Assuch,theHCP preprocessedfMRIvolumeswerewarpedbackinto ACPCspaceandupsampledtothevoxelresolutionofthediffusiondata. Thismappingwasdonebyleveragingthe
mni2acpc.nii
displace-mentmapsprovidedwiththeHCPpreprocesseddata,usingfirstorder splinesasthebasisforinterpolation.Inaddition,thesegmentationvol-ume
aparc+aseg.nii
,computedviaFreeSurfer(Fischl,2012)andprovidedwiththeHCPdata,wasdownsampledtotheworking resolu-tion,fromwhichvoxelsassociatedtoWMwereextracted.
2.2. GSPpreliminaries
ThefundamentalideainGSPistheapplicationofsignalprocessing procedurestodataresidingontheverticesofagraph,whereinthegraph definestheunderlyingirregulardomainofthedata.Let =(,,𝐀) denoteanundirected,connected,weightedgraph,definedbyavertex set ofsize𝑁𝑔,denotingthesizeofthegraph,anedgeset consisting ofconnectingpairs(𝑖,𝑗)ofvertices,andasymmetricadjacencymatrix
𝐀whosenonzeroelements𝑎𝑖,𝑗representtheweightofedges(𝑖,𝑗)∈. Let𝓁2()denotetheHilbertspaceofallsquare-integrablegraphsignals
𝐟∶→ ℝ definedonthevertexset.Agraphsignal𝐟∈𝓁2()isin
essencean𝑁𝑔× 1vector,whose𝑛-thcomponentrepresentsthesignal valueatthe𝑛-thvertexof.
Thegraphspectraldomain,analogoustotheEuclideanFourier do-main,can bedefinedusing agraph’sLaplacianmatrix.Inparticular, thenormalizedLaplacianmatrixofisdefinedas𝐋=𝐈−𝐃−1∕2𝐀𝐃−1∕2,
where 𝐃denotesthe graph’s degreematrix, which is diagonalwith elementsdefinedas𝑑𝑖,𝑖=∑𝑗𝑎𝑖,𝑗.Giventhat𝐋isreal,symmetric, di-agonallydominant,andwithnon-negativediagonalentries,itis posi-tivesemi-definite;i.e.,allits𝑁𝑔eigenvaluesarerealandnon-negative, andtheyarealsono largerthan2duetothenormalizationusedin thedefinitionof𝐋. Thissetofeigenvaluesdefinesthespectrumof (Chung,1997),denotedas𝚲 ={0=𝜆1≤𝜆2…≤𝜆𝑁𝑔
def
=𝜆max≤2}.The
associatedeigenvectors,denoted{𝐮𝑙}𝑙=1,…,𝑁𝑔,formanorthonormal ba-sisspanningthe𝓁2()space.
InclassicalFourieranalysis,complex exponentialsof varying fre-quencies areused toobtainspectral representations of signals,with largerfrequenciescorrespondingtogreatervariability—perregionor unitoftime.Itcanbeshownthat,inthegraphsetting,the eigenval-ues andeigenvectorsof𝐋fulfillacorrespondingroletothe frequen-ciesandcomplexexponentialsoftheclassicaldomain,respectively.In particular,largereigenvaluesof𝐋aresimilarlyassociatedto eigenvec-torswithgreaterspatialvariability;werefertheinterestedreaderto AppendixA foramoredetailedpresentationofthispoint.Giventhis analogybetweentheclassicalandgraphsettings,theeigenvectorsof𝐋
canbeusedtoobtainspectralrepresentationsofgraphsignals. Specifi-cally,agraphsignal𝐟 canbetransformedintoaspectralrepresentation throughtheuseoftheLaplacianeigenvectorsas
̂𝐟[𝑙]= 𝑁𝑔 ∑ 𝑛=1
=𝐮𝑙𝑇𝐟, 𝑙=1,…,𝑁𝑔. (2) Thisspectralrepresentationpossessesaperfectreconstruction,thatis, thesignalcanberecoveredas𝐟=∑𝑙=1𝑁𝑔̂𝐟[𝑙]𝐮𝑙.
Incontrasttofiltersinclassicalsignalprocessing,graphfiltersare
shift-variant, adapting their shape to theunderlying graph structure whenlocalizedatanygivenvertex.Consequently,individualfilters de-finedinthespectraldomainofagraphwillbecomespatially-adaptive bythenature ofGSP.Thisvaluablepropertyof graphfiltersenables theproposedmethodology,butitalsopreventstheimplementationof filteringoperationsasstraightforwardconvolutions.Instead,inanalogy tofrequency-domainfilteringinclassicalsignalprocessing,graph sig-nalfilteringcanbeconvenientlydefinedinthegraphspectraldomain. Giventhespectralprofileofadesiredfilter,𝑘(𝜆)∶[0,2]→ ℝ,agraph signal𝐟 canbefilteredwith𝑘(𝜆)as
̃𝐟= 𝑁𝑔 ∑ 𝑙=1𝑘 (𝜆𝑙)̂𝐟[𝑙]𝐮𝑙 (3) (2) = 𝑁𝑔 ∑ 𝑙=1 𝑘(𝜆𝑙)𝐮𝑙𝑇𝐟𝐮𝑙. (4)
However,implementing (4) requirestheLaplacianeigenvectors, i.e., a full diagonalization of 𝐋, which is impractical for large graphs, such as those presented in this work. An efficient alternative ap-proach is toimplement thefiltering using a polynomial approxima-tionof𝑘(𝜆)(Hammondetal.,2011).Werefertheinterestedreaderto AppendixB fordetailsontheimplementation.
2.3. WMgraphdesign
Inordertotake advantageof GSPtools,itis necessarytodefine graphsthatencode relevantinformationintheirvertices,edges,and weights.Forthepurposeofallowingdiffusion-informedsmoothingof theBOLDsignalinWM,werequiregraphscapableofencodingthe sub-ject’saxonalmicrostructure.Filtersdefinedonthespectraldomainof suchgraphswillbecomelocallyadaptedtothismicrostructuredueto theshift-variantnatureofgraphfilters.
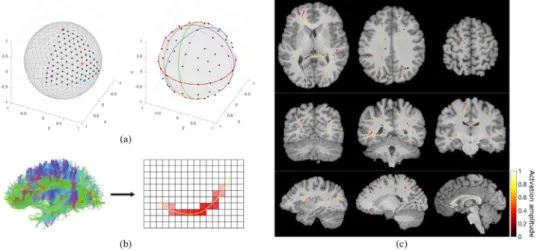
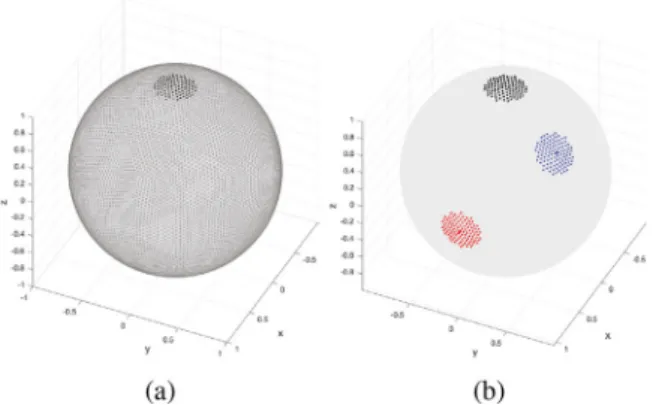
WedefineaWMgraphasagraphwhosevertexset consistsofall WMvoxels,resultingingraphswith240k±60kverticesontheHCP100 subjectset.Thegraph’sedgeset isdefinedonthebasisofvoxel ad-jacency,with pairsof verticesbeing connectedtoeach other when-evertheirassociatedvoxelsarespatiallyneighboring.Two neighbor-hooddefinitionsareconsidered,correspondingtocubiclatticesofsizes 3× 3× 3(henceforth3-conn)and5× 5× 5(henceforth5-conn),where thefocalvoxelislocatedinthecenterofthelattice.The3-connlattice specifies26voxelsintheneighborhoodofthefocalvoxel,whereasfor the5-connlattice,voxelsintheouterlayerthatfallinparalleltothe voxelswithintheinnerlayerareexcluded,resultingin98voxelsinthe neighborhood;seeFig.1.
Theencodingofaxonalmicrostructurebythegraphisprincipally achievedthroughtheedge-weightingscheme,inspiredbytheworkof Iturria-Medinaetal.(2007).Theweightsprovideadiscretizationofthe diffusionODFateachpoint,andincludeinformationonthecoherence ofdiffusionorientationamongneighboringvoxels.Let𝑂𝑖(̂𝑟)denotethe ODFassociatedtovoxel𝑣𝑖,withitscoordinateoriginatthevoxel’s cen-ter,andwitĥ𝑟denotingtheunitdirectionvector.Let̂𝑟𝑖,𝑗denotetheunit vectorpointingfromthecenterofvoxel𝑣𝑖tothecenterofneighboring voxel𝑣𝑗.AdiscretizationoftheODFalongdirection̂𝑟𝑖,𝑗canbeobtained as
𝑝(𝑖,̂𝑟𝑖,𝑗)= ∫Ω𝑖,𝑗𝑂𝑖
(̂𝑟)𝑑Ω, (5)
whereΩ𝑖,𝑗denotesthesolidangleof4𝜋∕26(for3-conn)or4𝜋∕98(for 5-conn)around̂𝑟𝑖,𝑗and𝑑Ω denotestheinfinitesimalsolidangleelement.
Fig.1. (a) 26 voxels within the 3 × 3 × 3 neighborhood (gray) used to define edges to the focal voxel (red). (b) 98 voxels within the 5 × 5 × 5 neighborhood (gray), used to define edges to the focal voxel (red). (c) Scattered dots on the unit sphere specify the 98 neighborhood directions encoded by the 5 × 5 × 5 voxel neighborhood. Circled dots represent the subset of 26 directions encoded by the 3 × 3 × 3 voxel neighborhood. (For interpretation of the references to colour in this figure legend, the reader is referred to the web version of this article.)
This measurecanbeapproximated bytaking 𝑁𝑡samplesoftheODF withinthesolidangleΩ𝑖,𝑗as
𝑝(𝑖,̂𝑟𝑖,𝑗)≈̃𝑝(𝑖,̂𝑟𝑖,𝑗)= 1 𝑁𝑡 𝑁𝑡 ∑ 𝑘=1 𝑂𝑖(̂𝑟𝑘𝑖,𝑗), (6) wherê𝑟𝑘
𝑖,𝑗denotesthe𝑘-thsamplingdirectionwithinΩ𝑖,𝑗.Detailsofthe samplingprocessaregiveninAppendixC.Furthermore,wenormalize thismetricas
𝑞𝑖,𝑗= ̃𝑝 (𝑖,̂𝑟𝑖,𝑗)
2max𝑗{̃𝑝(𝑖,̂𝑟𝑖,𝑗)| (𝑖,𝑗)∈}, (7) which bounds itin the [0,0.5] range.The maximumvalue of 0.5is reachediftheODFat𝑣𝑖showsitsmaximaldiffusionalonĝ𝑟𝑖,𝑗,whereas otherwise𝑞𝑖,𝑗<0.5.
Themeasuredefinedin(7)constitutesanormalizeddiscretizationof thediffusionODFatvoxel𝑣𝑖.However,itdoesnotguaranteesymmetry, i.e.,generally𝑞𝑖,𝑗≠ 𝑞𝑗,𝑖,whichmakesitunsuitablefortheedgeweights inanundirectedgraph.Nevertheless,wecanobtainasymmetricweight byconsideringabidirectionalmeasureofdiffusiongivenby
𝑤𝑖,𝑗=𝑤𝑗,𝑖=𝑞𝑖,𝑗+𝑞𝑗,𝑖, (8) whichis constrainedtothe[0,1]range.Consequently,wedefinethe graph’sedgeweightsas
𝑎𝑖,𝑗=𝑎𝑗,𝑖=ℎ(𝑤𝑖,𝑗), (9) whereℎ(⋅)∶[0,1]→ [0,1]isatunablesigmoidfunction(Granlundand Knutsson,1994)definedas
ℎ(𝑥)= ((1−𝛼)𝑥) 𝛽
((1−𝛼)𝑥)𝛽+((1−𝑥)𝛼)𝛽 ∈ [0,1], (10) whereparameters𝛼 ∈ (0,1)and𝛽 >0controlthethresholdlevelandthe steepnessofthetransitionfrom0to1,respectively;seeFig.2.Giventhat diffusionODFsgenerallymanifestnon-zeromagnitudesinalldirections, withlittlecontrastbetweendirectionsofstrongandweakdiffusion,the thresholdingstepenablesassociatingweightsonlytothemain direc-tionsofdiffusion,withouttheneedtousesharpenedODFsaspresented in ourpreliminarywork(Abramianetal., 2020a).Thechoiceof the sigmoidfunctionoveraHeavisidestepensuresretainingasingle con-nectedstructure inthegraph;thatis,anynon-zero valueismapped toanon-zerovalue.Inthisworkweuseafixedvalueof𝛽 =50,but studytheeffectofvaryingthethresholdpoint,inparticular,forvalues
Fig.2. Sigmoid function used for thresholding edge weights, for three different values of 𝛼 and a fixed value 𝛽 = 50 .
Fig.3. Spectral graph heat kernels, defined within the bounds of the spectrum of a normalized graph Laplacian matrix, i.e., [0,2].
Theexpressionfortheedgeweightbetweenapairofvoxels(9) in-tegratesinformationabouttheextentofdiffusionalonĝ𝑟𝑖,𝑗fromboth
𝑣𝑖and𝑣𝑗,amountingtoameasureoforientationalcoherenceofthe dif-fusionODFsatthesevoxels.Inaddition,the𝛼 parameterofthe thresh-oldingfunctionprovidesaddedflexibilitytothisrepresentation.
2.4. Spectralgraphheatkernelfilters
Wedesignspatialsmoothingfilterswithaheatkernelprofileinthe graphspectraldomain,definedby
𝑘(𝜆)=𝑒−𝜏𝜆, ∀𝜆 ∈ [0,𝜆max], (11) where𝜏 isafreeparameterdeterminingthespatialextentofthefilter. Fig.3 showsseveralrealizationsoftheheatkerneloverarangeof𝜏.
Wheninstantiatedinthevertexdomain,suchfiltersareroughlysimilar inshapetotheGaussianfilterstypicallyusedforfMRIanalysis;however, giventheirregulardomainrepresentedbythegraph,thereisnodirect equivalencebetweenthetwofilters.
Thefilteringis implemented usingthepolynomialapproximation schemedescribedinAppendixB.Thepolynomialorderrequiredto ob-tainasuitableapproximationoftheheatkernelvariesdependingonthe choiceof𝜏.Fortherangeof𝜏 investigatedinthisstudy,weused polyno-mialapproximationsoforder15,resultinginnegligibleapproximation errorinrepresentingthefilters.
2.5. Circularphantomconstruction
Duetothediscretenatureofgraphs,thesetoforientationsthatcan beperfectlycapturedbyedgesbetweenvoxelsislimitedbythe neigh-borhooddefinitionused.Toevaluatetheinfluenceofangularresolution ondenoisingperformance,wetestedthe3-connand5-conn neighbor-hooddefinitionsonasetofsimulatedcircularphantomsofvarious ori-entationsandradii.Thesephantomsaimtosimulateawiderangeof streamlineorientationsandcurvatures,whichcouldbeencounteredin practice.
Eachphantomconsistedofanactivationprofileintheshapeofa circularstreamline,accompanied byanODF maporiented alongits tangent,representingstrongdiffusionalongthecircle.Thephantoms
wereconstructedin93differentorientationsin3Dspace,selectedina roughlyuniformwaybysubdividingthefacesofanicosahedronthree times,andfromtheresultingpolyhedron,selecting itssubsetof ver-ticesthatfallinthesphericalsectorof0≤𝜃,𝜙 ≤𝜋∕2;seeFig.4(a).Due tosymmetriesinthephantomsandtheneighborhooddefinitions,this setofphantomorientationsprovidesarelativelyexhaustivesampling oftheeffectsofstreamlineorientationonsmoothingperformance. Ad-ditionally,tostudytheeffectsofcurvature,wecreatedthephantoms withthreedifferentradiiforeachorientation:10,20,and30voxelsat 1.25mmisotropicresolution.
2.6. Streamline-basedphantomconstruction
Given that the correlation structure of the BOLD signal in WM is highly anisotropic and resemblant of the diffusion tensor (see Section1.1),activationpatternsinthistissuearelikelytohave elon-gatedshapeswhichlocallyfollowthedirectionofdiffusion.Tovalidate theperformanceoftheproposedfilteringschemeatdetectingsuch acti-vationpatterns,weperformedtestsonasetofsimulatedsemi-synthetic phantomsthatsimulatestreamline-shapedactivations.Wedenotethe phantomsassemi-synthetic,asthespatialactivationpatternswere de-rivedfromrealdiffusiondatafromtheHCP100dataset.Eachphantom consistedofasetofnon-uniformlyspreadactivationpatternsdiffusing alongWMstreamlinesobtainedthroughdeterministictractographyof theHCP100subjectset;seeFigs.4(b)and(c).Detailsoftheconstruction ofthephantomsaregiveninAppendixD.
Time-series versions of the streamline-based phantoms werealso generatedinordertoevaluatetheperformanceoftheproposedmethod inthecontextofatypicalfMRIgenerallinearmodel(GLM)analysis. Thesewerecreatedbyusingeachstreamline-basedphantomasthe un-derlyingground-truthactivityina100-volumefMRItimeseries,witha blockdesignalternating20volumestretchesofrestandactivityinan off-on-off-on-off paradigm.
3. Results
Wevalidatedtheperformanceoftheproposed diffusion-informed spatial smoothing (DSS) method relative to isotropic Gaussian spa-tial smoothing (GSS) through a series of tests on synthetic phan-toms—circularandstreamline-based—andproducedproof-of-concept resultsonrealdatafromtheHCP100subjectset.
3.1. Diffusion-informedfilters
4TheadaptivepropertiesofDSSfiltersareillustratedinFig.5.The
threefiltersshownweregeneratedusingidenticalparameters(𝛼 =0.9,
𝜏 =7),anddifferonlyinthelocationwithintheWMwheretheywere instantiated.Thefilterscloselyfollowthelocaldiffusionorientationin WMdescribed bythediffusionODFs.ForhighlyanisotropicWM re-gionsthisresultsinslenderandstronglyorientedfilters—seefirsttwo columns,whereasforregionsoflowanisotropyitresultsinfiltersthat aremoreisotropicinshape.Particularly,atcrossingfiberregions,DSS filtersarenotconstrainedtofollowanysingleaxonalpathway,and in-steadspatiallyextendalongalldirectionsofhighdiffusion—seethird column.Thisavoidstheuncertaintyinherentinresolvingthe orienta-tionofindividualcrossingfibers,whilestillresultinginmore spatially-constrainedfiltersthanwouldbeachievedwithisotropicGaussian fil-tering
TheshapeofDSSfilterscanbecontrolledbysettingthe𝜏
parame-terofthegraphspectralfilterkernel(see(11))andthe𝛼 parameterof theweightthresholdingfunction(see(10)).Whiletheformercontrols thespatialextentofthefilterinamannerakintothefullwidthathalf maximum(FWHM)ofisotropicGaussianfilters,thelattercontrolsthe
Fig. 4. Phantom construction. (a) Circular phantom construction. Left: A subset of vertices of a 3-level subdivided icosahedron, 93 out of 642, were selected. Vectors pointing from the center of the sphere to these vertices consti- tute the normal vectors of the planes within which circular phantoms were realized. Right: Five representative unit circles with orienta- tions corresponding to the vertices on the left of matching color. For example, the red circle falls within a plane that passes through the center of the sphere and has its normal vector point- ing from the center of the sphere to the red point shown on the left. (b) Streamline-based phantom construction. A WM streamline con- structed using tractography (shown in yellow) is randomly selected, a focal point along the streamline is randomly selected, and a diffused non-binary activation pattern is created around the focal point (shown in red). (c) Axial, coronal, and sagittal view of a representative streamline-based phantom with 100 streamline activations, overlaid on subject’s T1-weighted image.
minimumedgeweightsretainedbythegraph,whichinturn,constrains filterstofollowmaindirectionsofdiffusion.Fig.6presentsarangeof differentfiltershapesthatcanbeachievedbyvaryingthesetwo param-eters.Highvaluesof𝛼 resultinverynarrow,streamline-likefiltersthat arehighlyconstrainedrelativetotheunderlyingdiffusionmap,whereas lowervaluesresultinlessconstrainedfilters.Inparticular,lowenough valuesof𝛼 negatethediffusion-adaptivepropertiesofDSS,withthe re-sultingfiltersadaptingsolelytothemorphologyoftheWMdomain(see SupplementaryFigureS1).
Thechoiceofneighborhooddefinitionplaysasignificantroleinthe shapeoftheresultingfilters.Incombinationwiththe5-conn neighbor-hooddefinition,higher𝛼 valuescanresultinnon-localaveragingfilters whentheODFsareorientedalonganeighborhooddirectionintheouter shelloftheneighborhood(seeFig.5 middleleft,Fig.6 bottomrow). Thiseffectisnotpresentinfilterscreatedusingthe3-conn neighbor-hooddefinition(seeFigureS2),whichadditionallyshowamorelimited capacitytorepresentorientationduetothereducedangularresolution oftheneighborhooddefinition.Moreexhaustiveresultsforboth5-conn and3-connfiltersarepresentedinSupplementaryFiguresS1-S6.
3.2. Validationsoncircularphantoms
Circularphantomsof93differentorientationsand3differentradii werecreatedasdescribedinSection2.5.Eachphantomwascorrupted with10realizationsofadditivewhiteGaussiannoiseofstandard devia-tion1,andsubsequentlydenoisedbyspatialfilteringwithGSSandDSS overarangeofparameters.TheFWHMofGSSandthe𝜏 parameterof DSSwerevariedoverarangefrom1to8inunitsteps.Boththe3-conn and5-connneighborhooddefinitionsweretestedforDSS,whichwewill refertoasDSS3andDSS5,respectively.The𝛼 parameterofDSSwasset to0.9throughout.
Toassessthedenoisingperformanceof GSS,DSS3 andDSS5,we performedreceiveroperatingcharacteristic(ROC)analyses.Thefiltered phantomvolumeswereeachthresholdedat300uniformly-spaced con-secutivelevelsspanningtheminimumandmaximumvalueineach fil-teredvolume.Theresulting detectionsforeach thresholdlevelwere comparedwiththegroundtruthofthephantom,yieldingtruepositive rates(TPR)andfalsepositiverates(FPR)thatwerecollectedinROC curves.Theareaunderthecurve(AUC)oftheROCcurveswasthen computed,resultinginanoverallmeasureofperformance.
Figs.7 (a)and(b)showtheoverallperformanceofDSS3,DSS5and GSSascharacterizedbytheAUCs.Duetothelackofequivalence be-tweenDSSandGSSfilters,thereisnodirectcorrespondencebetween individualvaluesof FWHMand𝜏. However,itcanbenotedthatthe performanceofGSSpeaksat2mmFWHM,anddiminishesforlarger
filtersizes.Ontheotherhand,bothDSS3 andDSS5achieve substan-tiallyhighermaximumperformances,whicharenotnegativelyaffected byincreasedfiltersizeintherangeof𝜏 tested.
ThemedianAUCofDSS5consistentlyfallsabovethatofDSS3for
𝜏 ≥2andallthreephantomradii.TheperformancegapbetweenDSS5 andDSS3increasesforlarger𝜏,andslightlyincreasesoncircular phan-tomswithlargerradii,i.e.,smallercurvatures.Theseresultscorroborate theimprovementsindetectionperformancethankstotheincreased an-gularresolutionofthe5-connneighborhooddefinition.Thisisfurther illustratedbyFig.7(c),whichshowstheperformanceimprovementof DSS5overDSS3forindividualphantomsorientations.Thewiderange ofperformancegainsisrepresentativeofthevaryingdifficultyof rep-resentingspecificspatialorientationsinthediscretedomainofgraphs, highlightingtheimportanceofangularresolutionfortheproposed fil-ters.
GiventheoverallsuperiorperformanceofDSS5overDSS3,inthe following,DSSresultsareonlypresentedforgraphsusingthe5-conn neighborhooddefinition.
3.3. Validationsonstreamline-basedphantoms
Asimilaranalysiswasperformedonstreamline-basedphantoms.A singlephantomwith𝑁𝑠=50,100and200streamlineactivationswas createdforeachofthe95subjectsasdescribedinSection2.6.Asinthe analysison circularphantoms, eachphantomwascorruptedwith10 realizationsofadditivewhiteGaussiannoiseofstandarddeviation1, anddenoisedbyspatialfilteringwithGSSandDSSoverthesamerange ofparameters.The𝛼 parameterofDSSwassetto0.9,whereasvalues of0.85and0.95werealsotestedonthe100-streamlinephantoms.The denoisingperformanceofbothmethodswasassessedbyapplyingthe sameROC/AUCanalysisdescribedinSection3.2.
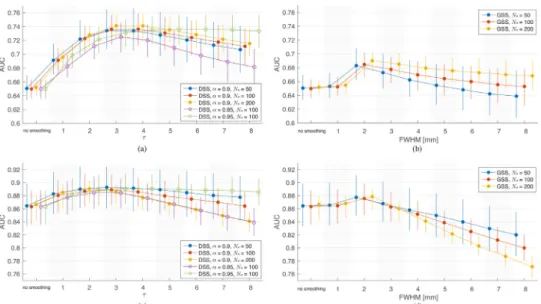
Figs.8 (a)and(b)showAUCresultsonallthreetypesofphantoms forDSSandGSS,respectively.Duetothesubstantialamountofnoise presentinthephantoms,spatialsmoothingusingeitherGSSorDSS gen-erallyleadstobetterperformancecomparedtonosmoothing.DSS out-performsGSSacrosstherangeof𝜏 andFWHMvaluestested,andacross thedifferentsettings.Aswiththecircularphantoms,theperformance of GSSpeaksat2mm FWHM,withincreasedsizenegatively affect-ingperformancebeyondthatvalue.DSSshowsasimilarpattern,with peakperformanceachievedfor𝜏 of3and4for𝛼 =0.9.BothGSSand DSSshowbetterperformanceonphantomswithagreaternumberof streamlines.AdditionalresultsshowthatDSSoutperformsGSSinboth sensitivityandspecificity(seeSupplementaryFigureS7(a)),andacross arangeofSNRvalues(seeSupplementaryFigureS7(b)).
Fig.5. Generation of diffusion-informed smoothing filters. Diffusion ODFs (bottom row) serve as the basis for the creation of a WM graph (middle row). Every WM voxel corresponds to a vertex in the graph, with weighted connections to neighboring voxels (middle left). The edge weights are determined on the basis of coherence between the directions of diffusion and the orientation of the graph edges (bottom left). Using this WM graph definition, graph filters from a single spectral profile become adaptive to the local axonal microstructure when instantiated in different WM regions (top row). Note that both the edges connecting voxels and the graph filters extend in three dimensions, whereas their 2D axial intersection centered at the focal voxel are shown. Graph parameters: 5-conn neighborhood, 𝛼 = 0 . 9 , 𝛽 = 50 ; filter parameters: 𝜏 = 7 . Filters are shown normalized to the [0,1] range. ODF interpolation and visualization were performed using the public CSA-ODF package 4.
Fig.6. Effects of parameters 𝜏 and 𝛼 on the shape of DSS filters located at red ROI shown in Fig.5. Graph parameters: 5-conn neighborhood, 𝛽 = 50 . Filters are shown normalized to the [0,1] range. (For interpreta- tion of the references to colour in this figure legend, the reader is referred to the web version of this arti- cle.)
ToassesstheperformanceofDSSandGSSincombinationwith tem-poralmodeling,i.e.,asusedwithin fMRIactivationmappingstudies, time-seriesversionof thestreamline-basedphantomsweregenerated asdescribed in Section2.6. Thephantoms werecorrupted with ad-ditivewhiteGaussiannoiseofstandarddeviation1andsubsequently
spatiallyfilteredwithGSSandDSSwiththesamerangeofparameters usedpreviously.Thesmoothedphantomsweresubjectedtoastandard single-subjectanalysisinSPM,andtheresultingt-mapswereusedinthe ROC/AUCanalysis.
Fig.7. Validation of spatial smoothing on circular phantoms. (a)-(b) AUC of ROC curves obtained from volumes spatially smoothed with DSS and GSS, re- spectively. The markers show the median AUC over 930 ROCs (93 orientations ×10 realizations), whereas the whiskers represent 5 − 95% percentiles. (c) Dif- ference between AUC values for DSS5 and DSS3 for phantoms with 25 mm ra- dius. The black curve shows the difference between the median performances shown in (a), whereas the remaining curves show the difference between the 10- realization medians for each of the 93 phantom orientations. The five colored curves correspond to the phantom orientations shown in Fig.4(a).
Figs.8 (c)and(d)showAUCresultsfromthetime-seriesphantoms. Duetotheincreaseddetectionpoweraffordedbytemporalmodeling, AUCsarehigherforallscenariosinthetime-seriesanalysiscompared tothoseinthesingle-volumeanalysis.Similarlytothesingle-volume
phantomresults,GSSachievesitsbestperformancefor2mmfilters,and considerablydeterioratesbeyondthatsize.Notably,GSSonlyprovides adistinctimprovementovernosmoothingfor2mmfilters.DSSresults alsoshowanegativecorrelationbetweenfiltersizeandperformancefor
𝜏 >2,buttheoverallperformanceissuperiortoGSSandprovidesa ben-efitovernosmoothinginmosttestedcases,withbestresultsachieved for𝜏 between2and4.Aftersubjectingthet-mapstoactivationmapping withfalsediscoveryrate(FDR)correctionat5%(Genoveseetal.,2002), thedetectionmapsresultingfromDSSshowedsubstantiallyhigher sen-sitivity andspecificitythanthose fromGSS (seeSupplementary Fig-uresS8-S10). Theseresults alsoillustratethatthediminished perfor-manceofbothmethodsonphantomswithagreaternumberof stream-lineactivationsisaconsequenceofincreasedFPRwhenusinglarge fil-ters.
Figs.8(a)and(c)alsoillustratetheeffectsofvaryingthe𝛼
parame-terofDSSinsingle-volumeandtime-seriesphantoms,respectively.For bothtypesofphantomshighervaluesof𝛼 generallyresultedinbetter performance.Inthecaseofsingle-volumephantoms,filterswith𝛼 =0.9 outperformedtheothersforsmallfiltersizes,while𝛼 =0.95issuperior forlargerfiltersizesandacrossallsizesfortime-seriesphantoms.In ad-dition,filterswith𝛼 =0.95showminimaldecayinperformanceasfilter sizeincreasesforbothversionsofthephantoms.Filterswith𝛼 =0.85 consistentlyperformedworsethantheothers.
3.4. Single-subjecttaskfMRIresults
Inordertoexploretheeffectsoftheproposedsmoothingmethod onrealtaskfMRIdata,weusedSPM12toperformactivationmapping ontheHCP100taskfMRIdata,comprising23experimentalconditions across7tasks.EachGLManalysisincluded12motionregressors(raw andtemporalderivative)inadditiontoregressorsfor2to8 experimen-talconditionsassociatedwitheachtask.ThecanonicalHRFmodel, cor-respondingtoadoublegamma,wasused—althoughsuchatemporal modelisnottailoredtotheWMBOLDsignal,itaffectsGSSandDSS equally,andshouldhaveno discernibleinfluenceonspatialfiltering comparisons.TemporalnoisemodelingwasdoneusingaglobalAR(1) model.ThefMRIdataweresmoothedusingGSSandDSSwiththesame parametersusedpreviously.ForGSS,eachfMRIvolumewasfirst mul-tipliedwiththeWMmask,toavoidintroducingsignalfromGM.This stepisnotrequiredforDSS,asthemethodbyitsnaturefunctionsonly inWM.Theresultingt-mapswerethenthresholdedtodetermine sig-nificant activevoxels afterFDRcorrectionat5%.Ourchoiceof FDR asthecorrectionmethodwasduetoitonlyassumingthe𝑝-valuesto beuniformlydistributedunderthenullhypothesis.Correctionmethods
Fig. 8. Validation of spatial smoothing on streamline-based phantoms. (a)-(b) AUC of ROC curves obtained from volumes spatially smoothed with DSS and GSS, respectively. (c)- (d) AUC of ROC curves obtained from activa- tion mapping t-maps of time-series streamline- based phantoms smoothed with DSS and GSS, respectively. The markers show the median AUC over 950 ROCs (95 subjects ×10 realiza- tions), whereas the whiskers represent 5 − 95% percentiles.
Fig.9. Comparison of representative single- subject activation mapping results generated with GSS and DSS, with t-maps shown in grayscale and detections overlaid in red (FDR- corrected at 5% ). Full-brain activation maps are also shown for reference, overlaid on the sub- ject’s T1w image.
basedonassumptionsaboutthesmoothnessofthedata,suchasthose basedonGaussianrandomfieldtheory,wouldbedifficulttojustifyfor anadaptivesmoothingapproach.
The sheer number of detection maps generated by this anal-ysis—37,145 maps (95 subjects × 23 conditions × 17 filter set-tings)—rendersexhaustivevisualexaminationofthemimpracticable. Therefore,inourpresentation,wefocusonrepresentativeresultsthat highlightthedifferencesinmapsgeneratedbyGSSandDSS.Thefull setofunthresholdedt-mapsismadeavailableatNeuroVault5.
Fig.9 showsrepresentativet-mapsanddetectionsfromtwosubjects generatedbyDSSandGSS,withunmasked(i.e.,fullbrain)GSSresults includedforreference.6Visualinspectionofthet-mapsrevealsthatGSS
resultsingenerallyroundfeatureswithlittleorientedstructure,with verylittlevisiblestructureremainingforlargerGaussianfilters.In con-trast,t-mapsobtainedusingDSSpresentnotablespatialdetail,with lin-earfeaturesintheshapeofstreamlinesdiscernibleacrossfiltersizes.
5 https://identifiers.org/neurovault.collection:9494
6 In our default analysis setting, regions outside the WM are masked out of fMRI volumes prior to GSS smoothing. This prevents the introduction of spurious signal, particularly from gray matter, while ensuring an unbiased comparison with DSS. Such considerations are not adhered to when implementing full brain GSS, and these results are therefore provided only for reference. Furthermore, due to the differences in FDR thresholding, there is no expectation of WM de- tections of either GSS method being a subset of those of the other.
Thesedifferencesarealsopresentinthedetectionmapsfromboth meth-ods.WhileGSSdetectionsaregenerallylargeandrounded—withvery fewdetectionspresentforsmallerfilters—DSSmanifestsdetectionmaps with pronouncedsubtlespatialdetails—withconsiderabledetections evenforsmallfiltersizes.ThedetectionspresentedinFig.9(a)highlight thecapabilityofDSSinidentifyingseparatestreamline-shaped activa-tionsintwocontiguousparallelaxonalbundles(orangearrow),which remaindistinctacrossthetestedfiltersizes.Ontheotherhand,withGSS, theseactivationsarecombinedintoasingleactiveregionwhenlarge fil-tersareused,andarenotpresentwhensmallfiltersareused.Notably, thecaseofFWHM=3mmshowsactivationfocibeingcombinedacross
ratherthanalongaxonalbundles,suggestingthattheseactivationsmay notbeseparablewithGSS.InFig.9(b),DSSactivationmapsmanifest anelongated,clearlyresolvedstreamline-shapedactivationthatspans thecorpuscallosum(orangearrow),whichismostlyundetectedinGSS activationmaps.Inaddition,theactivationsseenaroundtheedgesof theWMmask deservenotice.Althoughthese activationsmaybe at-tributedtointerpolationartifactsorpartialvolumeeffect,duetothem consistentlybeingfoundinpositionsadjacenttoactiveGMregions,it isimportanttonotethatbothGSSandDSSproducetheseactivations solelyonthebasisofsignalfromWM.DSSgenerallymanifestsmore suchactivations,especiallyforsmallfiltersizes.Additionalactivation mappingresultsarepresentedinSupplementaryFiguresS11andS12.
In order to quantitatively investigate the degree to which spa-tial structure is present in t-maps obtained using the two
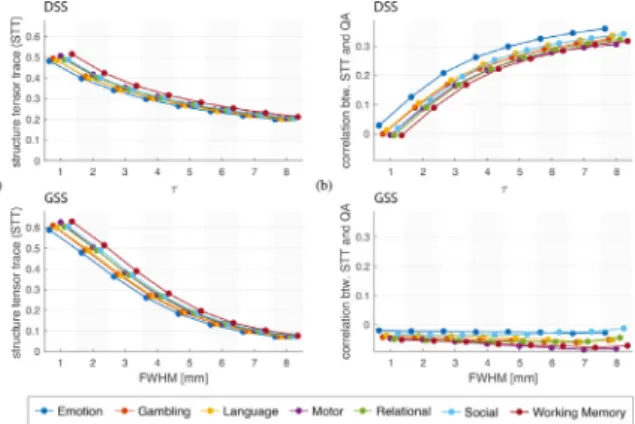
smooth-Fig.10. Structural analysis of task fMRI t-maps, obtained using local structure tensor analysis ( Knutsson,1989) where the eigenvalues of the structure ten- sor denote the amount of spatial structure. (a) Quantification of the amount of anisotropic structure observed in t-maps, specified by the mean structure map value, averaged across the task’s experimental conditions. (b) Correlation be- tween subjects’ QA maps and structure maps, averaged across each task’s exper- imental conditions. Markers shows the median value across the 95 subjects.
ingmethods, we analyzed thet-mapsusing structuretensor methods (Knutsson,1989).Whileathoroughintroductiontosuchmethodsfalls outsidethescopeofthiswork,itissufficientforourpurposestopoint outthattheeigenvaluesandeigenvectorsofthestructuretensorprovide informationonthepresenceandorientationofspatialstructure,inthe formoflinesandedges,atagivenpointinanimageorvolume.
Foreacht-map,weconstructedaquantitativestructuremapby com-putingthesumofthestructuretensoreigenvaluesateveryvoxel(a mea-sureoftheamountofspatialstructureineachvoxel).Themeanvalueof eachstructuremapprovidesaglobalmeasureofthepresenceofspatial structureinthecorrespondingt-map.Fig.10(a)showsacomparisonof thisglobalstructuremeasureforDSSandGSS.Forbothmethodsthe amountofstructurepresentinthet-mapsdiminishesasthefiltersize increases,which isconsistentwiththelossof spatialdetailresulting fromsmoothingthedata.ThiseffectisverypronouncedforGSS,while t-mapsgeneratedusingDSSexhibitamoreconsistentamountofspatial structureacrossthetestedfiltersizes.
Todeterminetheextenttowhichthestructurepresentinthet-maps isinfluencedbythediffusioninformationintroducedbyDSS,we com-putedPearson’scorrelationcoefficientbetweenthequantitative struc-turemapsandthequantitativeanisotropy(QA)map(Yehetal.,2013) oftheassociatedsubject;seeFig.10(b).ForDSS,thiscorrelationisclose tozeroat𝜏 =1,andsteadilyincreasesforincreasedfiltersizes.In con-trast,thestructuremanifestedint-mapsobtainedthroughGSSshowsa slightlynegativecorrelationwithQA,whichstaysnearlyconstantacross allfiltersizes.TheseresultssuggestthatDSSissuccessfulatinforming thesmoothingprocesswiththelocaldiffusionpropertiesofthe underly-ingWM,withlargervaluesof𝜏 resultinginstrongerdiffusionencoding. Fig.11 comparesthenumberofdetectionsobtainedfromDSSand GSS.Toprevent biasdue todifferences inbrainsize,wepresentthe fractionofeachsubject’sWMmaskbeingdeclaredasactive.Overall, thedetectionratesforbothmethodsincreaseasafunctionoffiltersize, withDSSexhibitingamorelinearincreasethanGSS.Whilethenumber ofdetectionsont-mapsobtainedfromvolumessmoothedwithDSSand GSSiscomparableforlargefilters,DSSgenerallyproducessubstantially moredetectionswithsmallerfiltersizes,asmanifestedbycomparingthe mediandetectionnumbersofcorrespondingtasks.
Intheabsenceofgroundtruth,itisnotpossibletomakedefinitive statements ontherelationshipbetween differences inthenumberof voxelsdeemedactivebyeachmethodandpotentialdifferencesintheir sensitivityandspecificity.However,itcanbeinsightfultoquantifythe differencebetweenthedetectionmapsgeneratedwithDSSandGSS.To quantifythesimilaritybetweenapairofdetectionmapswecomputed
theDicecoefficientbetweenthem,definedas
𝑑𝜏,fwhm=
2|𝑀𝜏∩𝑀fwhm| |𝑀𝜏| +|𝑀fwhm|,
(12) where𝑀𝜏denotesthesetofdetectedvoxelsusingDSSwithagiven𝜏,
𝑀fwhmdenotesthesetofdetectedvoxelsusingGSSwithagivenFWHM,
and| ⋅ | denotessetcardinality.TheDicecoefficientisconstrainedto the[0,1]range,whereavalueof1signifiesperfectoverlapbetween thedetectionmapsandavalueof0representsnooverlap.
ForeverysubjectandexperimentalconditionwecalculatedDice co-efficientsbetweendetectionmapsobtainedwithGSSandDSSofallfilter sizes,andarrangedtheminto8× 8Dicematrices.Additionally,we cal-culatedthemaximumDicecoefficientbetweeneachDSSfiltersizeand everyGSSfiltersizeforeachsubjectandcondition.Fig.12showsDice resultsforseveralrepresentativeexperimentalconditions.Theoverall similaritybetweenthedetectionmapsobtainedwithDSSandGSSis relatively low.The highest ensemble Dice is achievedfor 𝜏 =7 and FWHM=8mm,whereitreachesavalueof0.65,withother combina-tionsachievingvaluesclosetothisone(seeensembleDicematrix).The relationshipbetweenthe𝜏 andFWHMvaluesthatresultinthehighest similarityinthedetectionmapsisalsoshowntobenonlinear,tracinga particularcurveacrosstheDicematricesthatisgenerallysimilaracross experimentalconditions.Thesimilaritybetweenthedetectionmapsalso showsconsiderablevariationacrosstasksandindividualexperimental conditions(seeresultsforallexperimentalconditionsinSupplementary FigureS13),withbelow-averagesimilarityintheLanguageandMotor tasksandabove-averageintheGamblingandRelationaltasks.
Inorder todeterminewhetherthedetectionsgeneratedbyeither methodareasubsetofthedetectionsfromtheother,weexaminedthe numberofcommonanduniquedetectionsproducedbyDSSandGSS. Forallsubjectsandexperimentalconditions,thedetectionmaps pro-ducedbyDSSwerecomparedwiththemostsimilarmapsproducedby GSS.Fig.12,bottomright,showstheaveragenumberofvoxel detec-tionscommontobothmethods,aswellasthoseuniquetoeachmethod, forthetestedvaluesof𝜏. Theseresultsshow that,acrossfiltersizes, bothDSSandGSSproduceaconsiderablenumberofdetectionsthat arenotproducedbytheothermethod.Thisobservation,togetherwith thegenerallylowDicesimilarities,suggeststhepresenceofsubstantial differencesinthelocalizationandspatialextentofactivationsdetected usingDSSandGSS.
3.5. GrouptaskfMRIresults
Weperformedrandom-effectsgroupanalysisbasedon the single-subject resultsfor eachof the23experimental conditionsacross the seventasks.Theestimatedregressorweightsofeachexperimental con-ditionweretakentoMNIspaceusingthedisplacementmapsprovided withtheHCPdata—theinverseofthoseusedtomapthepreprocessed fMRIdatatoACPCspace—andaGLMwasfittedtothemtocreategroup t-maps.Thesegroupmapswerethenthresholdedtodetermine signifi-cantactivevoxelsafterBonferronicorrectionat5%.
Fig.13 showsrepresentativeresultsforoneconditionofthe Gam-blingtask.Overall,spatialpatternsinthet-mapsaremoreclearlyvisible thaninthesingle-subjectanalysis,remainingmoredefinedintheDSS resultsthaninthoseofGSS.Interestingly,bothmethodsshowlargeWM regionsintheshapeofaxonalbundlesthatarestronglyanticorrelated withtheexperimentalconditions.
TheactivationmapsinFig.13 showsimilarpatternstothe single-subjectactivationmaps.WhileDSSiscapableofproducingelongated, streamline-likedetections,thoseofGSSaregenerallyround.In addi-tion, DSSreveals considerabledetectionsforsmall filtersizes. Addi-tionalgroupactivationmappingresults areshownin Supplementary FiguresS14-S16.
Inorder tostudytheconsistencyoftheresults obtained byeach method, we investigated the test-retest reliability of GSS and DSS through aMonteCarloexperiment. The95subjects wererepeatedly
Fig.11. Fraction of voxels within WM mask detected as being significant using DSS (top left) and GSS (bottom left) across 7 functional tasks, over 95 subjects. Significant voxels were determined after FDR correction at 5%. In the plots on the left, each dot corresponds to one subject, whereas ■ shows the median value across the 95 subjects. The plots on the right show the trend of the average value as a func- tion of filter parameters 𝜏 and FWHM for GSS and DSS respectively.
Fig. 12. Dice similarity between detection maps generated with DSS and GSS. For each subject and condition, an 8 × 8 Dice matrix was computed, where each element represented 𝑑 𝜏,fwhm, see (12). For a given subject, if neither DSS nor GSS led to any detections for a given combination of 𝜏 and FWHM, the correspond- ing element was excluded from further analy- sis. The schematic on top explains how the re- sults were ensembled across subjects, resulting in two plots for each experimental condition; in the plots on the right, the mean of the scattered values is indicated by ■. Results are presented for a representative experimental condition in each task —see results across the 23 conditions in Supplementary Figure S13, as well as ensem- bled across 23 conditions; the ensemble plot on the left shows the average across conditions, whereas the one on the right shows the me- dian and range of the mean maximum Dice val- ues across conditions. The plot on the bottom right shows the average number of common and unique detections generated by DSS and GSS across all subjects and conditions, wherein every value of 𝜏 was compared with the FWHM that resulted in the maximum Dice coefficient.
Fig.13. Comparison of representative group activation mapping results generated with GSS and DSS, with t-maps shown in grayscale and detections overlaid in red (Bonferroni- corrected at 5% ). Full-brain activation maps are also shown for reference, overlaid on the MNI152 T1w template image.
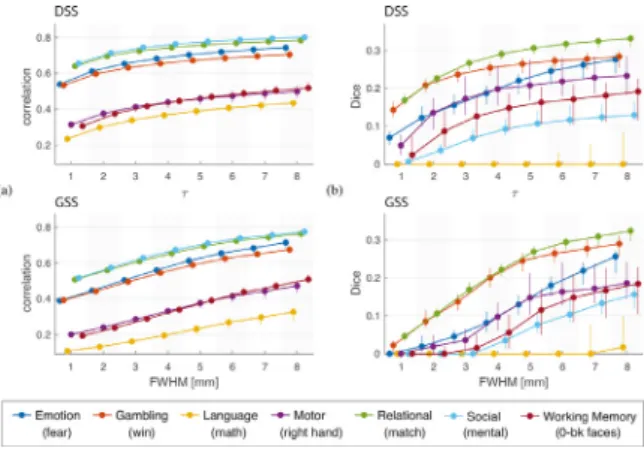
Fig.14. Results of Monte Carlo test-retest analysis for one representative ex- perimental condition from each task. Subjects were repeatedly divided into two groups and subjected to group analysis, and the resulting statistical maps were compared. (a) Correlation between t-maps of both groups. (b) Dice similarity between activation maps of both groups. The markers show the median value across 30 experiments, whereas the whiskers represent 5 − 95% percentiles.
splitintotwogroups,afterwhicharandom-effectsmodelwas fitted toeachgroup,andtheresultingt-mapsanddetectionmapswere com-pared.Thisprocesswasrepeated30times,andthesimilaritiesofthe resultingt-mapsanddetectionmapswerequantifiedusingPearson cor-relationandDicesimilarity,respectively.Fig.14 showsresultsofthis analysisforarepresentativesubsetofexperimentalconditions. Correla-tionandDicescoresshowanincreasingtrendwithrespecttothefilter size,forbothGSSandDSS.Thevaluesproducedbybothmethodsare roughlycomparable,beingslightlyhigheroverallforDSS,particularly forsmallfiltersizes.Fullcomparisonsforallexperimentalconditions arepresentedinSupplemetaryFigureS17.
3.6. Processingtime
AlthoughtheproposedmethodologyrequiresadditionalMRI scan-ningtimefortheacquisitionofDW-MRIdata,itdoesnotimposea dra-maticincreaseinprocessingtimeoverconventionalapproaches.Using aworkstationwithanIntelCorei7-7700Kprocessorand64GBofRAM, thegenerationofdiffusionODFsfromDW-MRIdatarequired approx-imately90seconds.ThegraphanditsLaplacianmatrixcouldthenbe calculatedfromtheODFsinunder15seconds.Bothoftheseoperations needonlybeperformedoncepersubject.
Inourimplementation,theaveragefilteringtimeofasinglevolume withGSSwas10.3msusingthe
imgaussfilt3
MATLABfunction (thesameoperationrequiredabout450mswhenusingthesmoothing implementedinSPM).Ontheotherhand,DSSfilteringscalesefficiently withthenumberoffilterkernelsused.Averagesingle-volumeDSS fil-teringtimesforasinglekernelwere115msforthe5-conn neighbor-hoodand56msfor3-conn,andbecamereducedto17.7msand11.0 ms,respectively,whenusing8filterkernelsatonce.Withworstcase performance,theproposedmethodgavefilteringtimesof around45 secondsfora405-volumeseries(thelongestofthoseavailableinHCP data,correspondingtotheWorkingMemorytask).4. Discussion
4.1. Interpretationofresultsfromsimulateddata
Previousimplementationsofvoxel-wisegraphsonGM(Behjatand Larsson,2020;Behjatetal.,2015;Maghsadhaghetal.,2019)haveused the3-connneighborhoodindefininggraphedges.However,giventhe differentnatureoftheproposedencodingforWMgraphs—representing axonalorientationsratherthanGMmorphology,weconsideredthe po-tentialadvantagesof usingalarger neighborhooddefinition.Tothis
end,wecomparedthedenoisingperformanceobtainedwithgraphs us-ingthe3-connand5-connneighborhooddefinitionsoncircular phan-tomsofmultipleorientationsandradii.Suchphantomswereused be-cause,barringdiscretizationartifacts,theyofferanexhaustivesampling ofallpossibleorientationsinwhichdatacanappearinthreedimensions. Theresultsshowaclearimprovementfromusingthelarger neighbor-hooddefinition(seeFigs.7(a)and(c)),whichcanbeattributedtoits superiorangularresolutionof98neighborhooddirections,againstthe 26ofthe3-conndefinition.Furthermore,comparingperformances ob-tainedonphantomsofdifferentradiishowsthatthelarger neighbor-hooddefinitionprovidesmorestableperformanceacrossspatial curva-turesthanthesmallerneighborhood,whichperformsworseforsmaller curvatures,particularlyforlargerfilters.Comparedtoisotropic Gaus-siansmoothing(seeFig.7(b)),boththe3-connand5-conn neighbor-hooddefinitionsusedinDSSshowedenhanceddenoisingperformance oncircularphantoms.Inparticular,whiletheperformanceofGSS dete-rioratesforlargerfiltersizes,theperformanceofDSSreachesaplateau instead,suggestingthatthediffusion-informednatureofDSSfiltersis capableofminimizingtheintroductionofspurioussignalevenforlarger filtersizes.
TobettermimicspatialactivationpatternsmanifestedasBOLD con-trastinWM,wedesignedandstudiedsemi-syntheticstreamline-based phantoms,whosediffuseactivationpatternsarerepresentativeofWM fiberstructures,alongwhichcorrelatedBOLDactivityisexpected(Ding etal.,2013;2016).Thephantomswerestudiedintwosettings.Inthe firstsetting,thedenoisingperformancewasstudiedintheabsenceof temporalmodeling,whereinbothmethodsprovidedanimprovement overnosmoothing,butDSSoutperformedGSSforalltestedfiltersizes (Fig.8(a)).Inthesecond setting,thephantomswerestudiedwithin thecontextofGLMactivationmapping,i.e.withtemporalmodeling, whereinGSSprovidedonlyminimalimprovementsovernosmoothing, whereasDSSprovidedanotableimprovement(Fig.8(b)).Inaddition, whenthetime-seriesphantomsweresubjectedtoactivationmapping withFDRcorrection,activationmapsfromGSSshowedreduced sensi-tivityandspecificitywhencomparedtothoseofDSS(seeSupplementary FiguresS8-S10).Thephantomswerealsousedtostudytheinfluenceof the𝛼 parameterof DSS,which setsa lowerboundon theweightof connectionsallowedintheWMgraph.Duetothenarrowerandmore directional filtersresulting fromhigher 𝛼 values(Fig.5, Supplemen-taryFiguresS1-S6),theincreasedperformanceonthestreamline-based phantomswouldbeexpected(Figs.8(a)and(c)).However,thisresult maynotbereadilyextensibletorealfMRIdata,asthespreadofreal activationpatternsisnotknown.
4.2. Interpretationofresultsfromrealdata
We compared single-subjectactivationmapping results fromDSS andGSSontaskfMRIdatafromtheHCP100subjectset.Structure ten-soranalysisoftheresultingt-mapsrevealedthattheoverallamountof structurepresentdiminishedforlargerfiltersizes,aneffectthatismore pronouncedforGSS(Fig.10(a)).Suchresultsreflectthelossofspatial detailsthathappensasaresultoflowpassfiltering.However,duetothe highlyanisotropicshapesthatDSSfilterstakewithintheWM(Fig.5), featuresintheshapeoflinesandedgescanbepresentint-mapseven forlargerfiltersizes(Fig.9).Inaddition,thespatialstructurepresent inthet-mapsobtainedwithDSSiscorrelatedwithregionsofhigh diffu-sionanisotropy(Fig.10(b)),indicatingthatDSSsuccessfullyadaptsits smoothingtotheunderlyingWMmicrostructure.
Duetothedifferencesintheirdefinitions,aswellastheadaptive natureofDSS,thereisnodirectcorrespondencebetweenGSSandDSS filters.ThisiscorroboratedbytherelativelylowDicecoefficients be-tweendetectionmapsresultingfrombothmethods(seeDicematrices inFig.12).TheoverallnumberofdetectionsiscomparableforGSSand DSS,withaconsiderableandroughlyequalnumberofactivations be-inguniquetoeachmethod(seebarchartinFig.12,bottomright).On theotherhand,exampledetectionmapscorroboratethatDSSiscapable
ofresolvingsubtle,slenderactivationpatternsalongaxonalpathways acrossmultiplefiltersizesbyleveraginginformationaboutthespatial correlationstructureoftheBOLDsignalinWM.Fig.9(a)exemplifies theincreasedresolutionfromDSS,presentingacasewhereitiscapable ofresolving twoparallelstreamline-likeactivationsthat GSSis inca-pableofidentifyingasseparate.Fig.9(b)illustratesasimilarcase,with DSSdetectingahighlyresolvedstreamline-likeactivationthroughthe corpuscallosumthatisleftlargelyundetectedbyGSS.Supplementary FiguresS11andS12presentadditionaldetectionmapcomparisons high-lightingtheincreasedsensitivityandspecificityoftheproposed method-ologyoverconventionalGSS.
WealsocomparedgroupactivationmappingresultsfromDSSand GSS.Similarlytothesingle-subjectresults,groupt-mapsobtainedwith DSSmanifestedintricate spatialstructuresacrossfiltersizes,while t-maps generated with GSS presented mostly smooth, round features (Fig.13).Thesamepatternsextendedtotheactivationmapsproduced bybothmethods,whereDSShasshowngreaterspecificityandan in-creasednumberofdetectionsinmultipleinstances(Supplementary Fig-uresS14-S16).AlthoughgroupWMactivationsobtainedwithGSSand DSSareoftencontainedwithinthoseobtainedwithfullbrainGSS,itis importanttonotethatwhilethelatterrelymostlyonsignalfromthe GM,theformerrelysolelyonsignalfromtheWM,andresultinmuch greaterspecificityinthedetectedactivations.
Inordertoevaluatetheconsistencyofthestatisticalmapsgenerated bybothmethods,weperformedatest-retestanalysisofgroupactivation mapping.WhiletheperformancesofDSSandGSSwerecomparablefor theupperrangeoffiltersizestested,DSSshowedamarkedimprovement forsmallfiltersizes(Fig.14),altogethersuggestingthatDSSiscapable ofyieldingequallyormoreconsistentresultsthanGSSis.
4.3. Limitations
Weusedasigmoidfunction,see(10),asameansofboosting orienta-tionencoding,allowingdiffusiononlyalongmaindirectionsofdiffusion coherence.Westudiedthreethresholdvalues,𝛼 =0.85,0.9and0.95,all ofwhichyieldedbetterperformancethanGSSonphantomdata,with noticeablevariationsinperformanceamongthethreevalues.However, thegeneralchoiceofthethresholdingfunctionandits associated pa-rametersisratherad-hoc,whichisacomplicationofsimilarnatureas thatencounteredinconnectomicstudies(RubinovandSporns,2010). Futureworkshouldconsideramorerigorousvalidationofthe threshold-ingschemeforobtainingoptimalperformance,especiallyonrealfMRI data.
Accurateco-registrationoffunctional,structural,anddiffusionMRI dataisacornerstoneoftheproposedmethodology.Withinthisstudy, weusedpreprocessedHCPdata,which havebeendiligently motion-corrected,distortion-corrected,andco-registered(Glasseretal.,2013). However,conductingsolidpreprocessingstepsmaynotbepossiblein somedatasets,andifso,resultsobtainedusingtheproposedmethodon suchdatasetsshouldbeinterpretedwithcare.
Anumberofrecentstudieshavehighlightedsubstantialdifferences betweentheHRFinWMandthatinGM(Choietal.,2020;Lietal., 2019b;Wangetal.,2020b),whichcorroboratesimilarsporadic obser-vationsfromearlierstudiesthatshowedevidencefordelayedand sub-duedhemodynamicresponsescomparedtothatinGM(Fraseretal., 2012;Yarkonietal.,2009),andinparticular,inthecorpuscallosum (Courtemancheetal.,2018;Taeetal.,2014).Therecentevidencefor theuniquefeaturesofHRFinWMisindeedinsightful,butgiventhe on-goingnatureofthisresearch,wedecidedtousethestandardHRFmodel thatisconventionallyusedinfMRIactivationmappinginthepresent work.Giventhatourworkiscomparative,thechoiceoftheHRFmodel affectsbothDSSandGSSequally,andassuch,wedonotbelievethatour conclusionswouldbesubstantiallyaffectedbytheuseofamoreprecise model.Nevertheless,futureworkaimedatinvestigatingtheBOLD sig-nalinWMcanmostlikelybenefitfromcombiningamoreappropriate HRFmodelwithadaptivesmoothingoftheBOLDsignalbyDSS.
4.4. Outlook;potentialextensionsandotherapplications
Duetothelimiteddegreetowhich diffusionODFscan differenti-atefiberorientation(Jonesetal.,2013),weboostorientation encod-ingbymeansofaweightthresholdingscheme.Alternatively,the pro-poseddesign can be extendedtoleverage standard fiberorientation distribution(FOD)functionsestimatedfromeitherthediffusionODFs (Descoteauxet al., 2008)or theraw diffusiondata (Tournier etal., 2007),orasymmetricFODs(Bastianietal.,2017),toobviatetheneed forthresholding.IntheabsenceofHARDIdatabutpresenceofDTIdata, theproposedmethodcanbereadilyextendedtoleveragediffusion ten-sorsinsteadofdiffusionODFs,e.g.asinTarunetal.(2019),whichcan beofparticularinterestforreanalyzingthevastextentofcurrently avail-ablefMRIdatasetsthatareaccompaniedbyDTIdata.Itisalsoworth notingthatDSScanbeextendedtoworkonagraphthatrepresentsa dis-cretizedversionofatractogram,enablingspatialfilteringinamanner thatwouldresembleleveragingprinciplesfromsuper-resolution track-weightedimaging(Calamanteetal.,2012).
In the absence of any DW-MRI data, it would be possible to adapt theproposed method to use a structure tensorrepresentation (Knutsson,1989) derivedfromT1-weighted MRIimagesasthe com-plementary contrast(Abramianetal., 2020b),whereintheproposed filteringschemecouldbeextendedtofunctionacrosstheentirebrain mask.Theresultingmorphology-basedspatialsmoothingcouldthenbe seenasaGSP-basedalternativetonon-linearfilteringalgorithmswhich enablespatialsmoothingwithinsimilaranatomicalcompartments(Ding etal.,2005;Lohmannetal.,2018;Rydelletal.,2008;SmithandBrady, 1997;WeickertandScharr,2002),butwillnotprovideadaptationto WMfiberorientations.
Inaddition toperformingdenoising throughheatkernel smooth-ing(i.e.,lowpassfiltering), theproposed WMgraphscan be usedto implement graph-waveletdenoising, similar tothat implemented by Behjatetal.(2015) forGMgraphs,usingnoveldata-drivenGSP de-noisingschemes(deLoynesetal.,2021)incombinationwith computa-tionallyefficientmulti-scalespectralgraphdecompositionmethods(Li etal.,2019c;Shuman,2020)thatcanbetractablyimplementedonlarge graphs.
Inthepresentstudy,weonlyexploredspatialsmoothingof task-basedfMRIdatawithinthecontextofactivationmapping,whereasDSS can be readily applied toWMresting-statefMRI data,where recent studieshaveusedGaussiansmoothingofthedataasapre-processing step. Such research appears particularly promising in light of stud-iesreportingtheexistenceofBOLD-likeresponseinresting-statedata (KarahanoğluandVanDeVille,2015;Lietal.,2021;LiuandDuyn, 2013;Petridouetal.,2013),andthecurrentgrowinginterestin explor-ingfunctionaldynamicsofWMatrest(Dingetal.,2018;Lietal.,2020a; 2019a;Peeretal.,2017;Wangetal.,2020a).
It is worth noting that DSS may prove beneficial for enhancing the detection of functional pathways through theuse of functional-correlationaltensors(FCT)(Dingetal.,2013)orhighangularresolution functionalimaging(HARFI)(Schillingetal.,2019).FCTandHARFI pro-videthemeanstoderivefunctionalWMpathwaysbycharacterizingthe spatialanisotropyobservedinthetemporalcorrelationintheBOLD sig-nalatadjacentWMvoxels.GiventhelackofspatialadaptivenessofGSS, itsuseislikelytodistortthespatialanisotropyinthesignal,onwhich thesemethodsrely.Ontheotherhand,filteringthefMRIdatawithDSS mayhelpboostthisspatialanisotropy,thusenhancingthedetectionof spatiotemporalcorrelationinthelocalBOLDsignal.Furthermore,FCTs havebeenleveragedforimprovinginter-subjectregistrationof resting-statedatabasedonfunctionalfeatures(Zhouetal.,2018),whichmight alsobeenhancedifthedataareinitiallyfilteredwithDSS.
DSSmayalsobeusedasamethodtofiltertractographystreamlines inamannersimilartoSIFT(Smithetal.,2013).Inparticular,by apply-ingDSStovoxelizedrepresentationsofstreamlines,theresultingfiltered mapscanbequantifiedtoobtainavalidityscorefortracts—tractsthat