The
“Scale” of Musical Instruments
By
Johan
Sundberg
T h e musical instrument holds an important position among sources for musicological research. Research into older instruments, for example, can give information of value in answering questions about interpretation of music in older times. Analyses of the fundamental frequencies produced by various instruments can provide certain information about the scales or intervals em- ployed within the musical culture where the insrrument i s used. Instruments from musical cultures which make use of intervals deviating from the tradi- tional Western norms are therefore of particular interest.
Research on musical instruments has in recent times made increasingly wider use of acoustic apparatus and procedure. This is especially true in in- vestigations of scales and intervals. It is essential, however, when acoustic procedures and concepts are brought to bear in these investigations, to dis- tinguish carefully between information obtained from acoustic measurements and perception. Previously it was often expedient to equate fundamental fre- quency and musical pitch-that is to say, to take ir for granted that the data which the acoustical apparatus furnishes correspond directly to what a listener perceives. That this is untrue is now clear to every musicologist.
Unintentional confusion of the acoustical and perceptual facts still may appear as results of vague and ambiguous terminology. A notion such as “the scale of a musical instrument” is to be interpreted as a summarizing classifica- tion of several different physical and perceptual events and qualities with more or less unknown correlations to one another. One aim of this essay is to show that this is the case. The dangers of terminological confusion on this point can be illustrated by the results of fundamental frequency analyses of certain musical instruments. The experiences that will be cited below have in part been quoted from earlier publications and in part assembled from experiments which were carried out at the Speech Transmission Laboratory at the Royal Institute of Technology in Stockholm.
The results of these fundamental frequency analyses will show that the notion “scale of a musical instrument” is used for several different objects. It is desirable, therefore, to introduce distinctions so that this general notion can be replaced by others that have one and only one of the meanings which
the “scale of an instrument” can be shown to have. Herein lies the second aim of this essay. A terminology will be suggested, in which physical and perceptual facts are more distinctly separated.
First of all it seems natural to assume that a “scale of a musical instru- ment” has to be something that is dependent on the instrument in some way: the instrument must have some definite influence on the fundamental fre- quencies producted in playing. Speaking of the “scale of a violin”, for instance, would make no sense, since the sizes of all intervals are determined exclusively by the violinist, and the instrument plays no relevant role in this determination process. Therefore, in this article it will be presupposed that the term “scale of an instrument” has a definite meaning only if the instrument imposes some restrictions on the instrumentalist’s freedom in determining the sizes of in- tervals played.
Before the semantic questions are more closely dealt with, it may be of interest to consider briefly how a fundamental frequency analysis can be carried out. The simplest method is to make a tape recording of all the tones of interest for analysis, select the fundamentals by means of a low pass filter and feed the fundamentals into a frequency meter. A condition for the use of this method is that the recorded tones are free from vibrato and, in addi- tion, that they hold the same fundamental frequency from the beginning to the end. This is in practice seldom the case where musical instruments are concerned. It is however possible to mix the recorded tone with a signal from a sine wave generator and this compounded signal can be observed on an oscilloscope. The signal from the sine wave generator is also used for trigging the oscilloscope. As long as the frequency of the sine wave generator and the fundamental frequency of the recorded tone are not identical, the picture on the oscilloscope screen will move in one or the other direction depending on whether the difference in frequency is positive or negative. Thus, it is relatively easy to determine when the tone generator frequency is adjusted to a good mean value of the recorded tone’s fundamental frequency. If such large variations arise in the fundamental frequency that a mean value cannot
be obtained by this method, one can use a frequency plotter which registers the fundamental frequency as a function of time.
The next step is to convert the measured intervals between the fundamental frequencies to logarithmic units, for example cents. The “scale of the instru- ment” can also be illustrated on a diagram where the deviations from an equal-tempered scale are accounted for. The equal tempering can be repre-
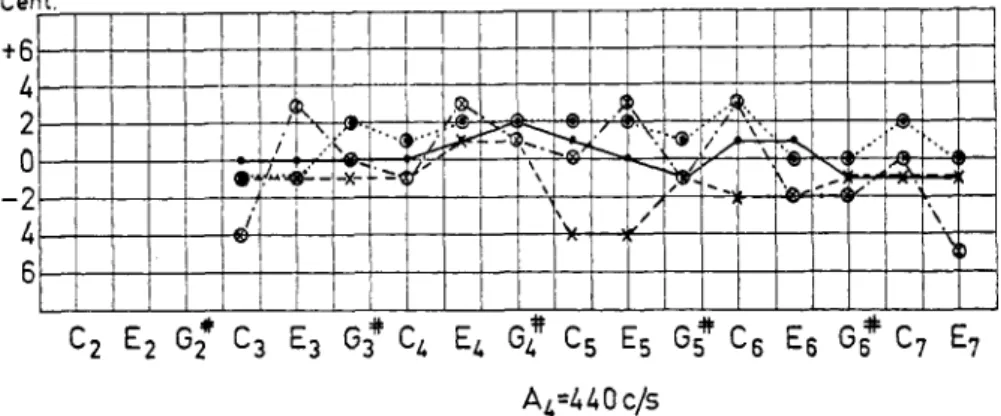
sented by a horizontal line on the diagram as is shown in Figs. 1-5. From a purely technical point of view, no problems will arise; measure-
A4=440c/s
Fig. I . Deviations in cents from the equal-tempered scale in different organ stops.
and O refer to two diapason stops; x and refer to t w o flute stops.
ment methods have already been developed and no difficulties appear in the analysis of the results. The serious problems appear when one attempts to translate the acoustical data into perceptual magnitudes. This will be demon- strated by some examples.
The organ is a fairly simple instrument as far as its “scale” is concerned. The player cannot affect the fundamental frequencies of the individual pipes; these have been decided in advance by the organ-builder. The organ is never- theless of interest for comparisons with other instruments.
Fig. I shows deviations from equal-tempering (with A4 =
440
Hz) in some stops of a newly tuned organ.’ The deviations are very small, within6
cents.‘ Thus, it is evident that a tuner with a “good ear” can make a very goodapproximation of the equal-tempered scale.
The piano is another instrument whose fundamental frequencies cannot be changed by the player. Its “scale” has attracted ehe attention of several American acousticians, and results of their studies have appeared in the acoustical literature. Railsback made fundamental frequency analyses on newly tuned pianos as early as
1938.3
In so doing he discovered significant devia- tions from an equal-tempered scale, particularly in the treble and the bass. Moreover, the deviations were similar in nature on all of the instruments studied. He could therefore construct an average curve for the measured deviations of a number of instruments, This curve is named, after him, the 1 The note designations are the ones recommended in American Standard: Acoustical Ter-minology, American Standards Association 1360, S. I. I., p. 49.
2 Compare Lottermoser: Das Musikinstrument 12 (1963), p. 885.
3 Railsback: J. Acoust. Soc. Am. 9 (1938), p. 274, and I O (1938), p. 86. Railsbacks
results are presented in greater detail in the same publication, vol. 1 5 (1943), p. 7 ff., by Schuck & Young.
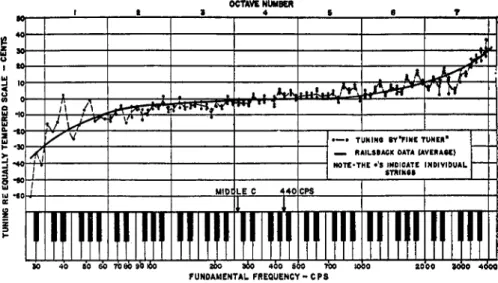
Fig. 2. Deviations in cents from the equal-tempered scale in pianos. (After Martin & Ward.)
Railsback curve. The solid line in Fig. 2 represents the Railsback curve, and
the individual points indicate the fundamental frequencies of each individual string in a newly tuned piano investigated by Martin & Ward.4 The Railsback curve shows that the piano’s tuning deviates from the equal-tempered scale by up to about 35 cents in the bass and the treble: In the treble the strings are tuned too high and in the bass too low—that is to say, the octave interval is made larger in the extreme registers. The positions of the individual points show further that the individual strings are not tuned in strict unison; devia- tions arise of up to some ten cents.
An explanation for these deviations from the equal-tempered scale has been presented by Schuck & Young.5 The piano string does not give rise to a spectrum in which the partials are exactly harmonic, but rather the intervals between them are slightly too large.‘ In the spectrum of a piano string it is not always the fundamental tone that is the most prominent. In fact, it is often missing in the bass of small pianos. These facts together give, ac- cording to Schuck and Young, an explanation of the Railsback curve’s ap- pearance. This can most easily be explained with a specific example. Say that the first four partials in the note A4 are 440, 883, 1325, and 1770 Hz, respectively. Say, further, that it is the second partial at 883 Hz that is the 4 The picture is taken, with permission of the authors, from Martin and Young: J. Acoust.
Soc. Am. 33 (1961), p. 582 ff.
5 See Schuck & Young, op. cit., p. 9.
6 See also in this connection Young: J. Acoust. Soc. Am. 24 (1952), p. 267 ff.
most conspicuous in the sound. The tuner tunes the note A5 so that it rings true against the note A4’s second partial, i.e., to the fundamental frequency 883 Hz. The octave interval AI-As is then 5 cents larger than it would be in a mathematically equal-tempered scale. This procedure holds also in the tuning of the octaves downward: The tone A3 is tuned so that its fourth partial is at the same frequency as the second partial in the tone Al-in other words, it is tuned to the frequency 883 Hz. But the interval between the partials in the tone A3 is larger than 883/4 Hz. Say that the frequencies of
the lower partials in the sound with the fourth partial at 883 Hz are 883,
660,
483, 216 Hz, respectively, where216
Hz is the fundamental frequency. That frequency is 32 cents lower than the corresponding value in a mathe- matically equal-tempered scale.An enigma that reveals the semantic confusion is suggested by the results of the fundamental frequency analyses on the piano: What should one say of the piano’s ‘‘scale’’-is it equally or unequally tempered? If we consider the fundamental frequencies’ relations to one another, the answer must be that the piano is not equal-tempered. But, if one has in mind the perceptual impression, the answer becomes the opposite. This contradiction evidently arises from a misleading terminology: an analysis of fundamental frequency gives information about acoustic quantities rather than perceptual qualities. It is appropriate therefore to distinguish between two sorts of scales: one, the perceptual or pitch scale; the other, the physical or fundamental fre-
quency system constituted by the relations between the fundamental frequen-
cies that can be measured acoustically. These fundamental frequencies may be referred to as the fundamental frequency series. Thus, the pitch scale of
the piano is equal-tempered, the fundamental frequency series deviates from the frequencies given by a mathematically defined equal-tempered scale, and the fundamental frequency system is unequal-tempered.
The player has no possibility of influencing the fundamental frequency of the instruments considered thus far. In most other musical instruments, on the other hand, this possibility exists, and, of course, in fundamental frequency analyses on such instruments a number of problems appear. The difference in meaning between fundamental frequency system and pitch scale presupposes the wellknown dissimilarity between the information from the ear concerning the relationships between the pitches of musical sounds, and the information from the frequency analysis about the relationships between the fundamental frequencies of the corresponding spectra. It is therefore pertinent to elucidate how the “musical ear” (involving auditory processes, perception, musical con- ventions and habits) affects the determination of played fundamental frequen-
cies on instruments where the instrumentalist has a possibility of influencing the fundamental frequencies within certain limitations.
The role of the player’s “musical ear” can
be
studied by varying the condi- tions for its influence upon the choice of fundamental frequencies. In the playing of a notated succession of intervals, one can take for granted that the player is realizing auditory conceptions of the notated intervals. This tendency to think “melodically” is reduced if the player makes a rest between each played note and does not see the notes in the context of ordinary musical notation, F. Fransson has developed a measurement method which makes use of these circumstances.’ The instrumentalist is presented with an apparatus in which the whole range of notes that can be played on the instrument is presented on a staff. Behind each note there is a little lamp. The player presses a pedal contact, and after a few seconds one of the lamps lights up. When the corresponding tone has been played, the player once more presses the pedal contact and another note lights up. The player does not know which note will be played next, and the tendency to think melodically is also frustrated by the rests between the played tones and by the distraction of pres- sing the pedal contact. The note sequence is decided at random. This method will hereafter be called playing according t o successive note dictation. Theinfluence of the “melodical thinking” is avoided or at least diminished by playing according to successive note dictation as compared to playing a sequence of notes. The differences between the fundamental frequencies in a series played according to successive note dictation and one notated se- quentially give information about the direction in which the player’s “musical ear” influences the determination of fundamental frequencies.
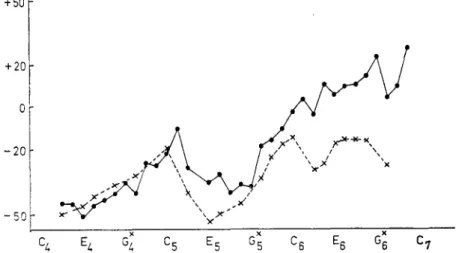
An example of the above-mentioned effect is given in Fig. 3. Both curves are derived from a flute played by the same musician on separate occasions: the first series was played after a sequence of notes, the second according to successive note dictation. The curves differ substantially from one another in the treble. The frequencies measured in the first series are higher than those measured in the second series. This indicates that the “musical ear” dictates a
raising of the fundamental frequencies in the treble. It appears also that such sharpening of the treble occurs with some other wind instruments, and ex- amples of this will follow.
In Figs. 4, 5, and
6
the results of fundamental frequency analyses on the clarinet, bassoon, and oboe are presented. The clarinet shows no apparent rise in treble, and playing a sequence of notes results generally in the same curve as playing according to successive note dictation. Neither does the bassoon 7 See Fransson: Lecture J 36 at 5th International Acoustical Congress in Liège, 1965.Fig. 3 . Deviations from the equal-tempered scale in a flute. The continuous line refers
t o playing a sequence of notes, and the broken line to playing according to successive
note dictation.
Fig. 4. Deviations from the equal-tempered scale in a clarinet. The continuous line refers to playing sequences of notes, and the broken to playing according to successive note dictation.
show any treble rise, since the curve is fairly horizontal. In the oboe, on the other hand, a clear treble rise can be seen.
The results so far accounted for have shown that treble rise can be found in the piano, flute, and oboe, while on the other hand no treble rise was observed in the organ, clarinet, and bassoon. It is, however, important to make
Fig. 5. Deviations from the equal-tempered scale in a bassoon played after a sequence
of notes.
Fig. 6. Deviations from the equal-tempered scale in an oboe, played after a sequence o f notes.
clear exactly what conclusions these experiments permit. The curves in Figs. 3-6 are functions of the instruments studied as well as of the “musical ear” of the individual instrumentalists. It is not precluded that treble rise could have been observed even in the clarinet and the bassoon if other players had been chosen. The only significant results are that treble rise can be found for the flute and oboe, but not that treble rise is inconceivable for the bassoon and clarinet.
Against this background, it does not seem surprising that earlier investigations have produced varying results from fundamental frequency analyses on clari-
nets. I n 1961 a series of investigations were published that showed a distinct rise in treble, while the following year, new results were presented in which no treble rise could be established.8 9 The difference between the results
probably depends on differences in the players’ reactions when faced with the task of playing the prescribed intervals. What is pertinent here, however, is that a rise in the treble has been found in the clarinet. Earlier studies on the bassoon have, on the other hand, not shown any treble rise.10 One can there- fore suppose that bassoon players seldom or possibly never raise the treble tones.
Thus we can establish, in summary, that rise in the treble can be found in the piano, flute, oboe, and clarinet, while not in the organ and probably not on the bassoon. Although not conclusive, an explanation of these facts can be suggested.
In 1954 Ward published the results of a series of experiments in which the subjects adjusted a sine tone to the pitch they perceived as a pure m a v e above a lower constant sine tone.” The results showed that there is a strong tendency to raise the higher tone’s frequency above the value that corresponds to the 1 : 2 ratio, and that this tendency increases with the frequency.” Ward could, in other words, establish that the frequency relationship which entails a subjectively pure octave increases with the frequency. There is a similarity between Wards results concerning sine tones and the above- mentioned observations on the fundamental frequencies played on some musi- cal instruments: A high tone is commonly set higher than the mathematically “correct” interval predicts.
An experiment of the same type as Ward’s was made in order to learn if the physical correlate to the subjectively pure octave is changed with the frequency even in cases where spectra from musical instruments are con- cerned. The lower constant tone consisted of a vibrato-free bassoon tone (fundamental frequency = 263
Hz),
and the higher tone, which the subject was to set to a subjectively pure octave, consisted of a spectrum fairly rich in partials, with uniformly falling envelope. The bassoon tone and the variable higher tone could be heard alternately through a loudspeaker. There were4 subjects, all practising musicians. Each of them set the variable sound 24
8 Das Musikinstrument I O (1961), p. 614.
9 Das Musikinstrument I I (1962), p. 540.
10 See for example Meyer: Akustik der Holzblasinstrumente, Frankfurt am Main 1966,
p. 7 ff.
11 J. Acoust. Soc. Am. 26 (1954), p. 369 ff.
12 Compare also Stumpf & Meyer: Beiträge tur akustischen Musikwissenschaft 2 (1898),
times, partly on simple, partly on double octave intervals. The sound level of the variable tone was varied within a range of IO dB in order to investigate if this affected the sizes of the intervals.
The results of these experiments showed that the simple octave interval was set both higher and lower than the mathematically “correct”. The double octave interval was, on the other hand, set higher than the mathematically “correct” in all cases excepting one (out of 24). The mean value for raising of the simple octave interval was
+
8 cents with the extreme values of+
36 and - 17 cents. The corresponding value for the double octave interval was+
34 cents with the extreme values of+
I I O and -6
cents and the probableerror of the mean value is 4 cents. The mean values were calculated from 24 observations since no dependence of the sound pressure was observed.
These results are not presented as conclusive evidence that a subjectively pure double octave interval corresponds to a fundamental frequency ratio greater than 4:1 even where musical sounds are concerned. It does not fall within the scope of this essay to do this, a task that would require compre- hensive research. The results are interesting, nevertheless, since they point in the same direction as Ward’s, and one can for the time being accept-as a working hypothesis-that a subjectively pure double octave interval cor- responds to a larger fundamental frequency ratio than
1:4
even with musical sounds.If this hypothesis is right, it presents a possibility of explaining why treble rise is found in some instruments, and also places the piano’s tempering in a somewhat new light. As was explained above, the Railsback curve is de- pendent on the effort to obtain as few beats as possible in the octave interval. This is an explanation for the rise in treble on that instrument. At the same time it seems possible, however, that the “musical ear” requires such a treble rise not only in instruments with inharmonic partials, as in the piano, but also in those with purely harmonic partials, as in the flute, oboe, and clarinet. It is interesting that the treble sharpening in the piano, required to avoid beats, also matches the auditory preference for such “stretchening”.
In two instruments no treble rise could be observed: organ and bassoon. The organ offers no difficulties from the point of view of explanation.
A
heightened treble on this instrument would lead to intolerable beats in the playing of chords due to the strict harmonicity of the partials. The absence of treble rise in the bassoon may be due to two factors. First, a clear tendency toward treble rise could be established experimentally only for the higher tone in the double octave interval. The bassoon seldom lies at a double octave interval above other instruments. Secondly, this instrument functions for the
Fig. 7. Fundamental frequency resource in a spelpipa.
most part as a “harmonic instrument”, and is used less often as a melody- carrying instrument. In orchestral music it is as a rule used together with other instruments to form a chordal background. A freer intonation on the bassoon would therefore often lead to beats in the chord. The same is not true of the other instruments examined here, which most often carry a melody over a harmonic background. If this hypothetical explanation is right, the cello and the double bass, for example, would not, in similar musical contexts, be played with a rise in treble. It has, nevertheless, not yet been confirmed if this is actually the case.
The essential point is, however, that there seems to be a preference for a treble rise under certain conditions, but these conditions are of minor importance here. A result of this preference is that the same pitch scale obtained from different instruments may correspond to different fundamental frequency systems: It is likely that the pitch scale of a flute is perceived as identical with that of a bassoon, and this illustrates the necessity of distin- guishing between pitch scale and fundamental frequency system.
A prerequisite for the differences between playing sequences of notes and playing according to successive note dictation is the possibility of the instru- mentalist to influence the fundamental frequencies in playing.
This
possibility leads to new problems in defining a meaning of the “scale of the instrument”. This will be illustrated by an example.The “spelpipa”—a folk instrument of the recorder type found in Sweden- is a good example.13 Fig. 7 shows the fundamental frequencies that a player can produce on such an instrument. The horizontal lines represent the funda- mentals obtained through consecutive opening of the finger holes, and the length of the lines shows how much the fundamental frequencies can be
changed through different blowing methods. The figure indicates that it is possible to get the same fundamental frequency with different finger positions. 13 A more precise presentation of this instrument is given in B. Kjellström: Spelpipan i
It is also apparent that there are rather wide frequency ranges that can be covered with the same finger positioning by blowing differently.
The term fundamental frequency system seems fairly hard to define in such an instrument, and the question arises of what is accounted for in figures such as Fig. 7. Evidently it would not be adequate to speak about a scale; it seems better to introduce the term fundamental frequency resource, by
which is meant all the fundamental frequencies that can be measured when an instrument is played. The spelpipa is an extreme example, but in all in- struments where the player can influence the fundamental frequencies in playing, it will be necessary to speak about a fundamental frequency resource. This may be more or less rich: in the piano and organ it is identical with the fundamental frequency series since the frequencies belonging to this series cannot be influenced by the player, but in instruments of other types the fundamental frequency resource will be richer to an extent depending on how much the player can vary the fundamental frequencies.
Nevertheless, the term “scale of the instrument” is frequently used even for instruments where the instrumentalist has a considerable influence on the fundamental frequencies produced in playing. The question arises, what is meant by this term in such cases. Evidently, some frequencies or pitches are selected from the resource and regarded as in some way “normal”, and the question is then what criterion is used for what is “normal”. The answer to this may be found by investigating the methods used for determination of such scales.
One method is to observe all the tones used by an instrumentalist in playing on the instrument. The type of scale obtained in this way would be the tonal material (Materialleiter) of the instrument. But is the tonal material a pitch scale or a fundamental frequency system? This depends on the method for observation: if the observer uses his ear, the scale is a pitch scale, and if he uses frequency analysis it is a fundamental frequency system. Probably the latter has seldom been the case, and therefore it seems practical to regard the tonal material as a pitch scale. A consequence of this would be that the tonal material of an equally tempered organ is identical with that of a piano, and this seems reasonable.
A second method is to make a frequency analysis of all the fundamentals played by different instrumentalists on an instrument and calculate mean values of the measured frequencies. This method is commonly used by in- strument-makers in order to get some information about the quality of the instrument. Obviously, a fundamental frequency series is obtained in this way; but the frequency system obtained from this series will certainly be dependent
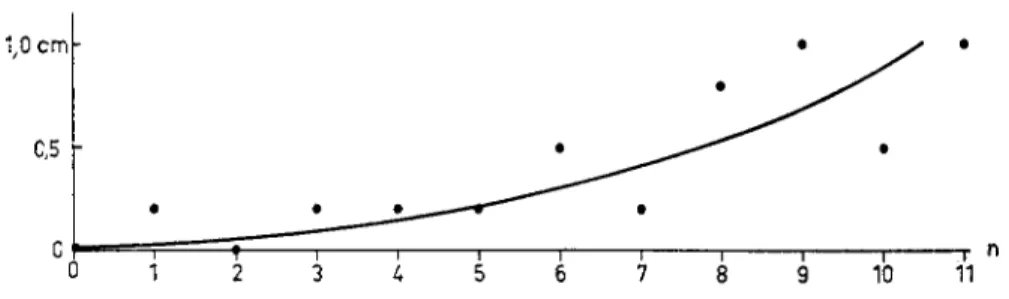
Fig. 8. The difference l, expressed in cm, between real string lengths and those calculated from mean fundamental frequencies (keyed fiddle).
on the musical habits and training of the instrumentalists used. If, however, by physiological and acoustical investigations, it will
be
possible to define a perfectly “normal” playing, the frequency system wouldbe
clearly defined, and it seems that this system would be the real “scale of the instrument”. For the moment it is not, and therefore the term mean fundamental frequency series is suggested.Within research on musical instruments a third method is used for de- termination of another type of “scale”. On certain stringed instruments the string lengths are determined by the instrument-maker as, for example on the Swedish keyed fiddle. On such instruments a scale related to the string lengths can be calculated, and on wind instruments the resonance frequencies can be measured. The type of scale obtained in this way is entirely defined by the instrument and it seems of importance to elucidate how this type of
scale is related to the tonal material and the mean fundamental frequency series.
The relations between the fundamental frequencies of stringed and wind instruments are not exclusively dependent upon, respectively, string lengths and resonance frequencies. Other factors also contribute to the determination of the fundamental frequencies in the radiated spectra. The differences be-
tween those fundamental frequencies which can be calculated from string lengths and resonance frequencies, respectively, and those which appear in playing, will next be exemplified.
Ling points out in his dissertation on the keyed fiddle that measurements of string lengths do not give information about the tonal material, but rather about the instrument builder’s aims and methods.” Fig. 8 gives the difference between calculated and measured string lengths. The calculated lengths have been obtained by converting the mean fundamental frequencies to string
Cent O -20 -40 -60 -80 -100 -120 B3
F4
B4F5
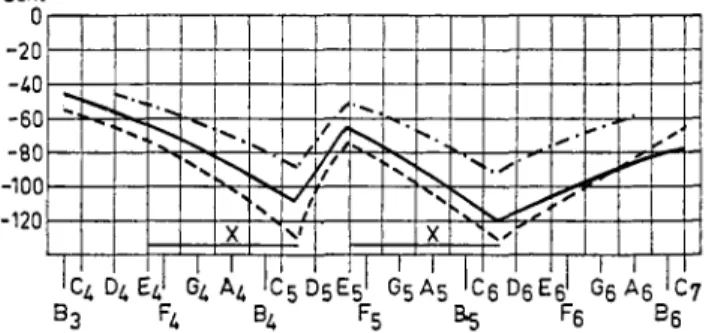
B5 F6 B6Fig. 9. Relation between resonance frequency and corresponding mean fundamental frequencies for flutes; the solid line represents mean values of the difference between the mean fundamental and the resonance frequency for five different flutes, the dot- dash line the resonance frequencies of a flute with a narrow embouchure partly closed; the broken line represents the resonance frequencies of a flute with a normal embou- chure partly closed,
lengths. The figure shows that the difference is fairly small in large string lengths, but increases substantially when the string length is reduced. One must, in this way, as did Ling, stresse caution in drawing conclusions from string length measurements concerning played fundamentai frequencies.15
Even greater caution is necessary where wind instruments are concerned. Fig. 9 shows the considerable differences between resonance frequencies and the mean fundamental frequencies on a flute. The figure shows also that similar differences are obtained if the embouchure is partly closed and this is, as is well known, also done by the flutist in playing.” The differences be-
tween the mean fundamental frequencies and the resonance frequencies are mainly due to this covering of the embouchure but also, to a certain extent, to a n effect of the air stream. For all instruments it is possible to express the relations between the mean fundamental frequencies and the resonance frequencies and string lengths, respectively, as a correction that depends on certain properties in the playing.
Thus,
the resonance frequencies and string lengths, appropriately measured, are of great interest and may be referred to as the resonance frequency series. For the type of scale they form the term resonance frequency system is suggested.Above several different meanings of the term “scale of a musical instru- ment” have been pointed out. It was stated first of all, that this term can be used only for such instruments that restrict the player’s freedom in de- termining the sizes of intervals, Since different series of fundamental fie-
ls Ibid., p. 119.
16 See further about this in Fransson: Lecture J 36 at 5th International Acoustical Con-
gress in Liége, 1965, from which the figure is taken, with author’s permission.
quencies obtained from different instruments may be perceived as identical, the necessity of distinguishing between fundamental frequency systems and Pitch scales is obvious. All the fundamental frequencies that can be produced in
playing on an instrument constitute the fundamental frequency resource. On
some instruments, as, for instance, the spelpipa, this may be very great, and on other instruments, as, for instance the piano, it is rather poor. By regarding certain frequencies in the fundamental frequency resource of an instrument of the former type as in some way normal, different meanings of the notion “scale of the instrument” are obtained. The tonal material is suggested to be
a pitch scale since it is generally determinated by listening to the pitches played on a certain instrument. The term mean fundamental frequency series is sug- gested for the series of fundamentals obtained by calculating mean values of the fundamental frequencies played by different instrumentalists on a certain instrument. This series can be related to the resonance frequency series by means of a correction function.