School of Innovation, Design and Engineering
Giraff Technologies AB
Measuring and Evaluating the Supply Chain by
implementing the BSC and investigating the quality of the
Supply Chain
:
A case study at Giraff Technologies
Master thesis work
30 credits, Advanced level
Product and process development Production and Logistics
KPP231
Eleni Odontidou
Report code: xxxx
Commissioned by: Giraff Technologies AB Tutor (company): Stephen Von Rump Tutor (university): Antti Salonen Examiner: Sabah Audo
ii
ABSTRACT
In today’s world, globalization has increased the competition among companies and functioned as a factor for increased product variety, increased amount of customized products and shorter product life cycles. Supply Chain management is considered one of the most critical strategies for increasing organizational effectiveness and enhancing the customer service. Supply Chain needs to be evaluated based on its performance of how efficient and effective it is. Quality on products and processes has becoming even more critical to companies’ success. Zero defects on the components and parts that meet the customers’ needs are important for the quality of the final products and quality efforts can decrease the costs throughout the Supply Chain. Moreover, Supply Chain’s cost identification is getting even more important in order for the companies to evaluate the performance of their channel and realize the efficiency of their activities based on their supply chain processes.
The purpose of this thesis is to investigate how the implementation of a performance measurement system can assist companies to improve the Supply Chain based on the identification of the relation between the evaluation of the Supply Chain and the quality and service that is provided to the customer. Moreover, the cost of the production and the after-sales service is measured, in order to have a clear image of the Supply Chain performance. A case study company, Giraff Technologies, was examined and investigated further in order the author to be able to support the results and the analysis of the primary research combined with the analysis of the literature review.
Based on the results of the research it can be said that the quality performance of a company and the service that is offered to the customers can be enhanced through the measurement and evaluation of the Supply Chain performance. Better collaboration with the suppliers and customers, customer focus and continuous improvements are ways to improve not only the Supply Chain but also the quality and the service that is offered. The production cost is considered as a factor that can be influenced positively or negatively by the Supply Chain performance, whereas the after-sale service cost is not clear if it can be affected immediately from the Supply Chain performance.
(Keywords:Supply Chain, Supply Chain quality, Supply Chain Performance Measurement, Balanced Scorecard, Supply Chain costs, and After-sales service)
iii
ACKNOWLEDGEMENTS
Firstly, I would like to express my gratitude to Stephen Von Rump, my supervisor and CEO from Giraff Technologies, for his help, trust and guidance throughout the last five months even his limited free time. Moreover, I would really like to thank all the people from Giraff for their help, support and their patience to answer my questions. I had a bunch of them! Without them this thesis would not have been completed.
In addition, I would like to thank Antti Salonen, my supervisor from Mälardalens Högskola, not only for his academic/research help and advice but also for his patience and for making me feel not worried.
Last but not least I would like to send my love and gratefulness to my family and friends for their unconditional support and for giving me moments of happiness and insouciance the last two years of this master.
v
Contents
ABSTRACT ... II ACKNOWLEDGEMENTS ... III CHAPTER 1 INTRODUCTION ... 1 1.1Background ... 1 1.2Problem formulation ... 21.3Aim and Research questions ... 3
1.4 Project limitations ... 3
1.5 Structure Outline ... 4
CHAPTER 2 RESEARCH METHODOLOGY ... 6
2.1 Research Philosophy and Research approaches ... 6
2.1.1 Research Philosophy ... 6
2.1.2 Research approaches ... 7
2.2 Classification of research ... 7
2.3 Research design: Case study ... 8
2.4 Qualitative and quantitative methodology ... 9
2.5 Data Collection ... 9
2.6 Credibility of research findings ... 10
2.7 Summary of research methodology ... 11
CHAPTER 3.THEORETIC FRAMEWORK ... 13
3.1Supply Chain Management ... 13
3.1.1 Supply Chain Performance ... 14
3.1.2 Supply Chain Quality Management ... 17
3.2Performance Measurement ... 18
3.2.1Purpose ... 19
3.2.2 Definition ... 19
3.2.3 Problems and challenges ... 20
3.2.4 Design performance measurement... 21
3.2.5Features of KPIs (or metrics) ... 22
3.3 Methods to evaluate and measure the Supply Chain Performance ... 22
3.3.1SCOR model ... 22
3.3.2Balanced Scorecard ... 24
3.3.2.1Principles for developing the BSC ... 27
3.3.2.2Development of BSC ... 28
3.4 Supply Chain Cost and after-sales service ... 29
vi
3.4.1.1Manufacturing Costs ... 31
3.4.2 After-sales service ... 31
CHAPTER 4 EMPIRICS ... 34
4.1Company’s Profile and Supply Chain ... 34
4.2 Performance Measurement ... 36
4.3 Balanced Scorecard ... 37
4.3.1 The three principles of the BSC ... 40
4.4 Manufacturing Cost and After-sale service cost ... 43
CHAPTER 5 RESULTS ... 46
CHAPTER 6 ANALYSIS ... 55
CHAPTER 7 CONCLUSIONS AND RECOMMENDATIONS ... 64
BIBLIOGRAPHY ... 68
vii
List of Figures and Tables
Figure i Structure Outline ... 4
Figure ii Research Philosophy ... 11
Figure iii Supply Chain overview ... 13
Figure iv Three levels of customer-supplier relationship ... 16
Figure v Supply chain decision categories mapped to the SCOR model ... 23
Figure vi The Balanced Score card ... 25
Figure vii Example of a “value for money” strategy map ... 29
Figure viii Giraff ... 34
Figure ix Giraff's Supply Chain ... 35
Figure x Giraff's Balanced Scorecard ... 38
Figure xi Manufacturing Cost ... 43
Table 1 Cause and effect relationships ... 41
Table 2Customer Metrics ... 46
Table 3 Internal Business Process Metrics ... 47
1
Chapter 1 Introduction
In this chapter, the background of the problem which will be analysed later on in the thesis is described; the aim and the research questions and the delimitations of this thesis work are presented.
1.1Background
Globalization increased the competition among the companies and functioned as a factor which led to the increased product variety, increased amounts of customer-specific products, and shortening product life cycles (Hilletofth & Hilmola, 2010). The technological and competitive forces and the ability to respond to customer’s demands in an ever-increasing rate are some of the today’s markets characteristics (Agarwal & Shankar, 2002;Gunasekaran, et al., 2001). Supply Chain Management (SCM) and related strategies are seen as a key strategic factor for increasing organizational effectiveness and for superior recognition of organizational goals such as enhanced competitiveness, better customer care and increased profitability (Gunasekaran, et al., 2001). In order to evolve this, companies have taken into consideration that the Supply Chain needs to be evaluated for its performance of how efficient and effective is (Gunasekaran, et al., 2001). This is because the cost and quality of goods and services sold are directly related to the cost and quality of goods and services purchased (Degraeve, et al., 2000;Hartley, et al., 1996).
Supply Chain effectiveness has therefore joined product quality and time-to-market1 as a key competitive differentiator. Quality can be seen as a critical factor in the value-adding processes of production and delivery of products all over the Supply Chain. Zero defects on the components and parts that meet the customers’ needs are important for the quality of the final products and quality efforts can decrease the costs throughout the Supply Chain (Sila, et al., 2006).Success for many companies now depends on their ability to balance a stream of product and process changes with meeting customer demands for delivery and flexibility. Ideally managing Supply Chain operations has therefore become critical to companies’ ability to compete effectively in the global marketplace (Stewart, 1997).
SCM performance measurement or monitoring is the term for a set of metrics and processes related to assessing and evaluating how accurate the planning is and how well the execution is carried out. Despite its importance, putting performance measurement in place has always been an overwhelming task (Bongsug, 2009). Performance metrics or KPIs “offer the overall visibility of supply chain and help to assess the accuracy of supply/ demand plan (e.g. forecast accuracy), and the execution performance (e.g. actual sales versus forecast plan)” (Bongsug, 2009). KPIs reveal the gap between plan and execution and offer opportunities to identify and correct potential problems. From a systems perspective, feedback is necessary for every system or organism’s
1 Time-to-market is the length of time taken in product development process from product idea to the finished
2
survival. The performance measurement or monitoring plays the role of feedback in one’s supply chain (Bongsug, 2009).
Moreover, the integration of the Supply Chain offers many opportunities to improve customer service and eliminate unnecessary costs. Using cost information to evaluate channel performance has strategic implications regarding the composition and structure, evaluation of performance, and the allocation of benefits within the supply chain. Possessing the capability to improve customer value while targeting opportunities for cost reduction, open new frontiers for SCM (LaLonde & Pohlen, 1996).
1.2Problem formulation
Based on the literature, the measurement of the Supply Chain can reveal gaps between execution and planning and help companies to identify potential areas for improvement. In order for the companies to measure and evaluate their performance, different methods including KPIs or other metrics are used. By measuring and evaluating the Supply Chain, the companies can benefit to improve their quality, customer service and eliminate unnecessary costs. The awareness of the cost information has strategic implications on the composition, structure and evaluation of the performance.
A case study company was studied and investigated closely in order to answer the research questions. The case study company is Giraff Technologies and is located in Västerås, Sweden. The company is a SME (Small Medium Enterprise) which is running business only the last four years. This thesis will help the company to evaluate and measure their Supply Chain with the application of the Balanced Scorecard (BSC), as until now the company did not have any performance measurement system in an organized way. Moreover, it will help the company to identify the relation between the quality and service offered by investigating the Supply Chain. Giraff is a service-oriented manufacturing company and as a matter of fact the quality becomes a vital aspect to the product and the service that they offer. Additionally, the cost of production and the cost of the after-sales service will be investigated as well. Therefore, the author can assume that the results of the thesis will contribute not only on an academic level but also for the company’s Supply Chain performance since the company can take advantage of this research and discover areas where they need enhancements.
The importance of measuring and monitoring the Supply Chain is pointed out and stressed by the aforementioned reasons. Regardless the extensive literature for measuring and evaluating the Supply Chain’s performance, researchers claim that the relation between Supply Chain and quality has not examined thoroughly as an emergence between those topics, but only separately. Thus, a further study and research will be conducted in order to investigate how the implementation of a performance measurement system can assist companies to improve the Supply Chain based on the identification of the relation between the evaluation of the Supply Chain and the quality and service
3
that is provided to the customer. Moreover, the cost of the production and the after-sales service will be measured as well, in order to have a clear image of the Supply Chain performance. The focus will be on the production and the after-sales service cost, since the case study company at the moment, wants to investigate these parts of their Supply Chain cost.
1.3Aim and Research questions
Embarking on this thesis project, the author will attempt to explore thoroughly the abovementioned concept of measuring and evaluating the Supply Chain and identifying the cost of production and after-sale service. Therefore, the aim of the thesis is to measure and evaluate the supply chain process from the beginning until the end by evaluating company’s quality performance through the measurement and evaluation of the Supply Chain and focusing on the part from the production to the end customer and the service that is provided furthermore to the customer after the delivery of the product. Additionally, the performance of the supply chain will be measured based on the Balanced Scorecard where different KPIs will be used; the present performance of the company will be investigated; areas for improvement will be identified; and the cost of production and the cost of after-sales service will be measured as well.
In order to accomplish the research objectives the author has to answer the following research questions:
RQ1: How the measurement and evaluation of the Supply Chain is connected with the quality and service offered?
RQ2: How the cost identification of the production and the after-sale service is related with the Supply Chain performance?
1.4 Project limitations
Supply Chain Management is a broad field that can encompass many different aspects. This thesis does not have as an intention to cover all the topics related with the Supply Chain, but only the topics that are related with the performance measurement of the Supply Chain, the methods used to measure and evaluate the Supply Chain and the relation of cost with it. Furthermore, with the term quality there is no purpose to examine the field of the Total Quality Management and the concepts related to that, but only the topics that are related with the quality within the Supply Chain.
Moving on from this, not all the measures from the Balanced Scorecard will be calculated and taken into account due to lack of data. The time frame that was established for the control of those data was more than the time extent of this report and therefore focus was given to those measures that were more connected with the objectives and the research questions of this thesis. The research
4
conducted for this thesis was performed in a manufacturing company with the aforementioned background. Thus, the work performed should be focused and not be extended from the aims and the goals of the thesis due to time (approximately 20 weeks) and content.
1.5 Structure Outline
In Chapter 2, it is described the research methodology that was used in the research of the thesis topic and the reasons of justifying the specific philosophies, design and tools that were chosen. In Chapter 3, it is presented the literature review related with the research questions. A description of the Supply Chain and the quality in the Supply Chain, the performance measurement, the measurement and evaluation method and the cost of Supply Chain is given.
In Chapter 4, the data that was selected during the research are introduced while in Chapter 5, the results of the research are presented.
In Chapter 6 the analysis of the data is given and finally, Chapter 7 contains the conclusions and suggestions from the conducted research.
The following figure illustrates the structure outline of the upcoming Chapters as there were described above.
Figure i Structure Outline
Research
Methodology
Theoritic
Framework
Data
Results
Analysis
Conclusions
6
Chapter 2 Research Methodology
In this chapter, the author will seek to establish the appropriate research methodology that will be used in order to carry on the thesis project. This Chapter explains the research philosophy, the different research approaches and classification of research, the qualitative and quantitative methods, the research design and the collection of data that are used in this thesis. The purpose of this Chapter is to give a justification of the research methodology chosen, why other techniques were not undertaken as part of the methodology for this research project and why this research methodology is going to support the formulation of the thesis from the beginning till the phase of collection of data and the analysis of the results.
2.1 Research Philosophy and Research approaches
2.1.1 Research Philosophy
It is of high importance to clearly distinct the research approaches that are being used and there should be an apparent understanding of the research philosophies between ontology and epistemology. As a matter of fact, the distinction between theory and research is by no means a clear-cut issue (Bryman & Bell, 2011, p. 7). The role of research is to test theories and to provide material for the development of laws (Bryman & Bell, 2011, p. 15). The term of research philosophy refers to the relation of the development of knowledge and the nature of that knowledge. (Saunders, et al., 2009, p. 107)
Ontology is concerned “with the nature of reality” (Saunders, et al., 2009, p. 110) and there are
two aspects of ontology: objectivism and subjectivism. Objectivism is an ontological position that highlights the social phenomena and their meanings have an independent existence of social actors (Bryman & Bell, 2011, p. 21) while subjectivism holds that the social phenomena and their meanings have a dependent existence of social actors. The author will adopt to use the objective perspective since the data that should be gathered and analyzed are mostly quantitative. Therefore, the interpretation of the results and conclusions will be based on facts and not to assumptions.
Epistemology is a concept that is concerned with the nature of knowledge and what constitutes
acceptable knowledge in a field of study (Saunders, et al., 2009, p. 112). The epistemology’s aspects that are usually used are positivism and interpretivism. The positivist researcher’s reality is represented by objects that are considered to be “real”. These objects exist separately from the researcher and for that reason the researcher would argue that the data collected are far less open to bias and therefore more “objective”. The interpretivism researcher would place more authority on the data collected, since he is concerned with the feelings and attitudes (Saunders, et al., 2009,
7
p. 113). The interpretivism researcher advocated the necessity to understand differences between humans in their role as social actors (Saunders, et al., 2009, p. 116).
In this thesis, the positivism concept is chosen because the author will seek and establish the findings only on observable phenomena which can provide credible data and facts. Moreover, a positivism aspect can assist the author to make generalizations of phenomena into simplest fundamentals. An interpretivism aspect is not suitable for this thesis since it is subjective. Interpretivism perspective is usually based on qualitative data, thus it makes difficult for the researcher to be utterly objective in the way that the data are interpreting.
2.1.2 Research approaches
There are two main research approaches: deduction and induction. “Deductive approach is the research approach which involves the testing of a theoretical proposition by the employment of a research strategy specifically designed for the purpose of its testing. Deductive approach emphasizes on scientific principles and it moves from theory to data.” On the other hand, “inductive approach is a research approach involving development of a theory as a result of the observation of empirical data” (Saunders, et al., 2009, p. 127).
On this thesis, the author will adopt a deductive approach since she is interested in “how” something happens rather than to “what”. The objectives of this research is to understand how the implementation of a performance measurement system can assist companies to improve and evaluate the Supply Chain, identify the connection between the performance measurement and the quality and the service offered and how the cost identification of the production and the after-sale service is related with the Supply Chain performance. The author of this thesis will base the research on scientific principles in order to move from theory to data and she will explain the relationships between variables based on quantitative data collection. Thus, an inductive approach does not fit the purpose of this thesis because an inductive approach is related to the performance of qualitative data and the researcher that adopts an inductive approach focuses on building theories and he/she is subjective to the research.
2.2 Classification of research
The research can be classified as exploratory, descriptive, and explanatory/analytical study: Exploratory study: An exploratory study clarifies the understanding of a problem, seeks new insights into phenomena, asks questions, and assesses the phenomena into a new light (Saunders, et al., 2009, p. 139).
8
Descriptive study: The object of descriptive research is ‘to depict an accurate profile of people, events or situations’ (Robson, 2002 p.59). It is needed for the researcher to have a clear picture of the phenomena which she/he wishes to collect data former to the collection of the data.
Analytical/ Explanatory studies: An analytical or explanatory study establishes casual relationships between variables. The emphasis here is underlined on studying a situation or a problem in order to explain the relationships between variables (Saunders, et al., 2009, p. 140). This thesis belong to a descriptive study, as it was mentioned on the research approach, the author seeks to understand how the implementation of a performance measurement system in the Supply Chain is connected with the quality and service offered and how the cost identification of the Supply Chain can help companies that focus on the after-sale service. Therefore, the author seeks to establish precisely the concept from the abovementioned problem and prior to she needs to have a clear picture of the situation before collecting the data. This thesis could not be supported as an exploratory study since the author does not seek to explore a new field of research neither attempts to explain why certain behaviors occurred by determining causes and effects as the analytical/explanatory study does.
2.3 Research design: Case study
The research strategy that was chosen for the conduction of this thesis is the Case study strategy. When it comes to research strategy it should be mentioned that “no research strategy is inherently superior or inferior to any other” (Saunders, et al., 2009, p. 144). The most important thing is how this strategy will enable the researcher to answer the particular research questions and meet the goals (Saunders, et al., 2009, p. 145).
Robson (2002 p.178) defines case study as ‘a strategy for doing research which involves an empirical investigation of a particular contemporary phenomenon within its real life context using multiple source of evidence’. The data collection techniques employed may be various and are likely to be in combination. For the purpose of this study, personal observation, interviews and documentary analysis were used.
According to Yin’s (2003) categorization for the case study strategies, this thesis belongs to a single and holistic case. A single case is used where it embodies a critical case or a unique case and gives the opportunity to the author to observe and analyze a phenomenon. Moreover, this thesis encompasses a holistic case study since the research is concerned only with an organization as a whole.
9
2.4 Qualitative and quantitative methodology
In order to distinguish between data collection and data analysis procedures quantitative and qualitative data are used. The distinction between the two can be done by focusing on numeric or non-numeric data.
Quantitative methodology is mainly used for any data collection technique (such as a
questionnaire) or data analysis procedure (such as graphs or statistics) that generates or uses numerical data. Qualitative methodology is used mostly for any data collection technique (such as an interview) or data analysis procedure (such as categorizing data) that generates or uses non-numerical data (Saunders, et al., 2009, p. 151).
This research is based mostly on quantitative data. Quantitative data used for example, to calculate the delivery lead time of the customer perspective, the Total Supply Chain Cycle Time, and the Cost of Goods Sold (GOGS) from the Internal Business Process perspective of the Balanced Scorecard. Additionally, the production and the after-sale service cost were based on quantitative data. On the other hand qualitative data used from the interviews in order to support the analysis part of the thesis.
2.5 Data Collection
This thesis embraces a literature review, two interviews, personal observations and calculations on a case study company. Primary and secondary data used to develop and support the thesis. Primary data are the data which have been acquired directly from a source, such as interviewees, questionnaires and real life observations such as time studies (Collis & Hussey 2009). Secondary data are those that have been obtained from published sources such as research publications, internal company publications and quantified observations of phenomenon (Collis & Hussey 2009). The data collection of this thesis is the following:
Primary Data
Primary data such as review of internal documentation and personal observations were used in order to obtain and review the data. Additionally, in order to support the data and analysis part, two structured interviews based on a predetermined and standardized set of questions were taken from the CEO and the Production Engineer of the company. In descriptive studies, structured interviews can be used as a means to identify general patterns (Saunders, p.313). Informal and unrecorded discussions with the people of the company took place as well. Quantified procedures were used in order to calculate the different metrics of the Balanced Scorecard and for the calculation of the manufacturing and after-sale service cost. The numbers and percentages of the
10
Balanced Scorecard are not revealed for reasons of confidentiality. However, this does not affect the quality and the validity of the results presented and the further analysis that conducted. Secondary Data: Literature review
Additionally, in order to establish the theoretical framework of the thesis and meet the research questions’ objectives, a thorough and analytical study of papers, articles, and journals which have been written by researchers was conducted to support this research. Articles of Internationals Journals such as International Journal Supply Chain Management, International Journal of Operations & Production Management, International Journal of Productivity, Performance Management and others, web engines such as Emerald, Google Scholar, Science Direct and E-brary were used to retrieve the relevant information. Moreover, books related with the Balanced Scorecard and the performance measurements were read. The related key words that were used to search on the web engines were: Supply Chain, Supply Chain quality, Supply Chain Performance Measurement, Balanced Scorecard, Supply Chain costs, and after-sales service. All the above data resources are categorized on the secondary data since they were written by others and the author just reviewed and used them as a help and framework for a further analysis of the empirical data, in order to conduct her own research.
2.6 Credibility of research findings
The research findings should follow three criteria in order to be credible. Those criteria are reliability, validity and generalisability.The research findings are reliable when the data collection technique(s) will produce reliable results, other researchers can reach to the same conclusions and results or when it is simple for someone to understand how conclusions driven from the raw data (Easterby-Smith, et al., 2008). Validity is concerned with the extent to which the data collection method(s) has been measured accurately with what it was intended to be measured (Saunders, et al., 2009, p. 157). Generalisability sometimes is known as external validity. That means whether the findings may be equally applicable to other research settings for example to other organizations. When only one organization is examined the researcher should be careful to claim whether his/her results can be generalized (Saunders, et al., 2009, p. 158).
11
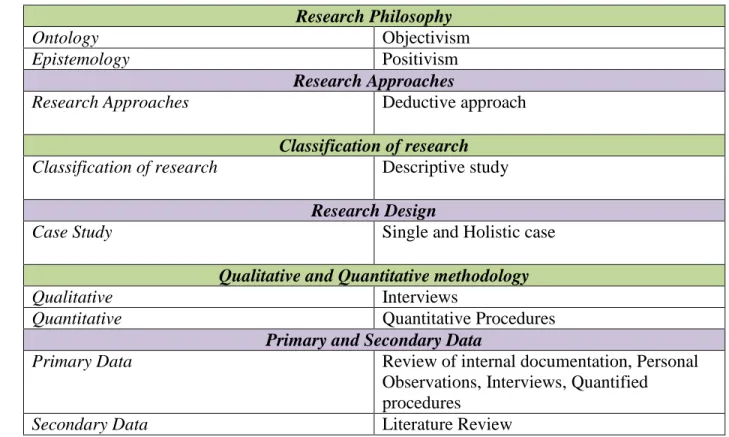
2.7 Summary of research methodology
The following figure summarizes the research methodology of the thesis.
Research Philosophy
Ontology Objectivism
Epistemology Positivism
Research Approaches
Research Approaches Deductive approach
Classification of research
Classification of research Descriptive study
Research Design
Case Study Single and Holistic case
Qualitative and Quantitative methodology
Qualitative Interviews
Quantitative Quantitative Procedures
Primary and Secondary Data
Primary Data Review of internal documentation, Personal
Observations, Interviews, Quantified procedures
Secondary Data Literature Review
13
Chapter 3.Theoretic Framework
This chapter will outline the theory examined and adapted. At the beginning, a small introduction for the description of the Supply Chain is given and how its performance measurement is of crucial importance topic. Issues connected with the quality of the Supply Chain are mentioned as well. Afterwards, issues related with the performance measurement are described and the methods of measuring and evaluating the Supply Chain are explained as well. Finally, there is a description of the Supply Chain costs and the after-sale service.
3.1Supply Chain Management
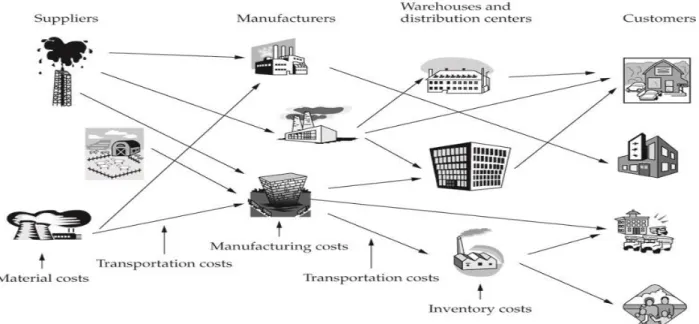
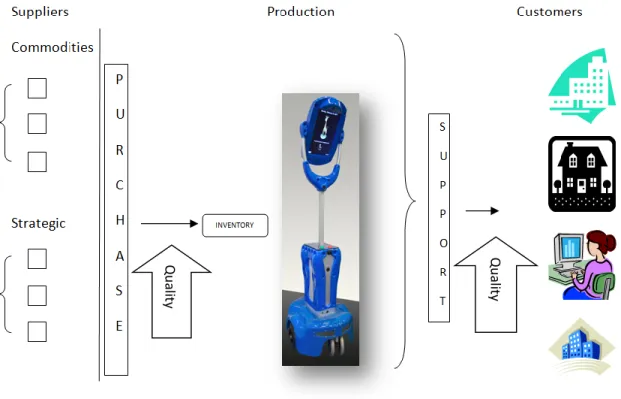
A Supply Chain is an interconnected set of relationships from customer to supplier, through a number of intermediate stages such as manufacturing, warehousing and distribution and it is a network of companies which influence each other (Agarwal & Shankar 2002)(figure iii). Therefore, a supply chain is consisted of three or more organizations or individuals that are directly involved in the upstream and downstream flow of products and services (Mentzer, et al., 2001). Focus has been increased regarding the business relationships and more particularly when it comes to long-term collaboration between customers and suppliers in the Supply Chain (Giunipero, et al., 2008). Moreover, Supply chain management creates value for companies, customers and stakeholders whom interacting throughout the supply chain (Estampea, et al., 2013). Supply chain can be considered as a single chain for the reason that the flow of material, money and information can be effectively managed to meet the business requirements (Agarwal & Shankar 2002).
14
Stevens (1989) gives a definition for the Supply Chain that is: “A system whose constituent parts include material suppliers, production facilities, distribution services and customers linked together via the feed forward flow of materials and the feedback flow of information.” Another definition for the SCM is given by Mentzer et al. (2001) “Supply chain management can be defined as a systemic and strategic coordination of traditional operational functions both within a given company and also between partners working within a chain, with a view towards improving the long-term performance of each company that is part of the chain and of the whole of the chain itself.” Ballou (2004) defines that supply chain “refers to all those activities associated with the transformation and flow of goods and services, including their attendant information flows, from the sources of raw materials to end users.”
Supply chain has even been more extensive the last years and thus, the complexity and the large network affect the performance of the interconnecting parts of the chain. The aim of the SCM is to gain an advantage in terms of customer service and cost over competitors (Chan, 2003). The measurement of Supply Chain’s performance is a vital, of high strategic dimension element. Nowadays, when it comes to the performance evaluation processes, companies tend to refer to several models that will differ in terms of corporate organisation, supply chain maturity and the distribution of responsibilities (Estampea, et al., 2013). Moreover, supply chain comprises a key element in corporate competitiveness, making firms to view this function as the keystone of their differentiation strategy (Waters & Waters 2007).
Supply chain performance can be measured both in terms of customers' level of satisfaction and the costs incurred (Estampea, et al., 2013). Customer’s satisfaction level is a sign of the required standard service level of a company, which is closely related to the whole performance of its supply chain (Chan, 2003). Evaluating supply chain performance is a complex mission, because it is a transversal process involving several actors cooperating to achieve given logistical and strategic objectives (Estampea, et al., 2013).
3.1.1 Supply Chain Performance
In order for the companies to improve the overall supply chain performance and tracking supply chain operations some levers can be used.
In order to facilitate planning at all levels of the Supply Chain, records and data can be shared between the companies and the suppliers in a way to reduce the lack of visibility of the end user demand upstream in the supply chain.
Another important lever is to work closely with customers and suppliers in order to improve information flows, and reduce surprises from demand spikes.
15
By enhancing internal processes and working with suppliers to reduce lead times allows the firm to wait longer before reacting to a change in demand levels, thereby mitigating the bullwhip effect.
Costs for all members in the supply chain can be reduced when the members of the Supply Chain are being cooperative in solving supply issues and providing information that can be trusted. (Krajewski, et al., 2010, pp. 394-395)
Additionally, when it comes to the Supply Chain performance metrics such as effectiveness of scheduling techniques which refer to the time or date at which activities need to be undertaken are necessary. Such fixing determines the manner in which the resources flow through an operating system. The effectiveness of this has a significant impact on the performance of supply chain (Gunasekaran, et al., 2001). In the case of supply chains, since scheduling depends heavily on customer demand and supplier performance, the scheduling tools/methods should also be viewed from that context. Based on these, it can be said that measuring and improving effectiveness of scheduling techniques will improve the performance of a supply chain.
The spatial and time distance can play an important role on the choice of a sourcing strategy. The spatial dimension refers to geographical distance. The concept of global supply means that the company strives to establish supplier relationships over the entire world, in principle irrespective of the geographical distance involved, while local supply means that the company strives to maintain and establish supplier relationships only with suppliers at a short distance from the company. Lower transportation costs and more frequent deliveries of smaller quantities can be achieved through short distances with the suppliers. Short delivery distance is a prerequisite of the just-in-time philosophy and the delivery flexibility between the supplier and the company can be improved. Close partnership and co-operations can be established based on closer distances and issues regarding quality and other types of development projects can be implemented (Jonsson, 2008, p. 173).
The distance in time between the purchasing and supplying companies is referred by the time dimension. Working hours, days and holidays are different in different time zones. This can have as result the limited time of communication between the suppliers and the companies. During these periods it may be impossible to contact a supplier and in many cases to have goods delivered. To avoid shortages, delivery times must be adapted and buffer stocks used with a subsequent decrease in efficiency of the supply chain. This is possible to happen even if the companies are in time zones, with only one or two hour’s difference. This limits the possibilities of communication and flexibility in the relationship (Jonsson, 2008, p. 173).
The development of the supplier relationship is really significant for the company’s success. The efficiency and the competitiveness of the company can be affected by the choice of suppliers and the policy on the company’s behaviour towards them. Suppliers are equally important as the customers for a company (Jonsson, 2008, p. 183).
16
The relationship levels (figure iv) between the suppliers and the company are divided into three categories. Suppliers at the lowest level are called conventional suppliers. This relationship is characterized by deliveries to single orders, prices are decisive for the supplier’s selection, the company having its own quality control and the company guarding against disruptions in deliveries by keeping its own safety stock. They can be divided into two main types with respect to continuity of the relationship. The first type is characterized by low frequency and the evaluation and selection of the suppliers takes place on each procurement occasion. In the second type the relationships are more frequent and the procurement does not take any evaluation and selection of them. Instead suppliers are chosen as first alternatives until further notice, without any existence of any formalized co-operation or agreements (Jonsson, 2008, p. 183).
Figure iv Three levels of customer-supplier relationship (Jonsson, 2008, p. 184)
On the second level are the associated suppliers. Relationships with them are in a long term and reviewed periodically. The supplier guarantees the quality of products delivered, which means that the customer company does not need to carry out quality controls on deliveries. The supplier’s prices are only one of the several variables on which suppliers are assessed on the selection phase. At the highest relationship level are the partnership suppliers. Relationships with them are mostly similar to those with the associated suppliers, but also include joint product development and frequent exchange of information and production processes, products and quality issues (Jonsson, 2008, p. 184). It is demanding to develop and maintain partner relationships both in time and resources. It is not feasible to establish partner relationships with a large number of suppliers neither it is right to integrate value-adding activities and material flows with a large number of suppliers (Jonsson, 2008, p. 185).
Partnership suppliers
Associated suppliers
17 3.1.2 Supply Chain Quality Management
Despite the importance of supply chains and their role to enhance company’s position little attention has been given to quality issues in supply chains (Mellat-Parast, 2013). Realizing Supply Chain’s quality issues is critical to the success of the firm and supply chain performance (Sila, et al., 2006). Through the application of the SCM, which is regarded as a major inter-organizational practice, companies can achieve competitive advantage in the market by having better co-operation with suppliers and customers (Janvier-James, 2012;Rungtusanatham, et al., 2003). Emphasis is given on the interdependence among the organizations which work collaboratively to achieve efficiency in supply chain activities (Narasimhan, et al., 2002;Shin, et al., 2000).
Sousa and Voss (2002) refer that quality management practices affect quality and operational performance.Additionally, quality is driven mainly by the top management which leads the quality initiative inside the organization whereasin the supply chain context, quality is influenced by the network and not from the top management (Mellat-Parast, 2013).It is suggested for companies to collaborate with few high quality suppliers and developing close strategic planning processes (Chen, et al., 2004; Yeung, 2008). The preservation of quality issues among the partnership between the companies and the suppliers can ensure the success of the firm and the sustainability of the partnership (Mellat-Parast, 2013).
A firm’s quality management approaches and supply chain management practices complement each other and need to be integrated to achieve superior financial and business performance (Mellat-Parast, 2013).Practices such as supplier relationship and information sharing facilitate the integration of quality management and supply chain management. The supplier’s quality practices have a significant effect on the quality performance of the firm (Mellat-Parast, 2013).According to Sila et al., (2006) effective supply chain management requires high level of quality management implementation within individual firms and efficient communication among the supply chain members.
Kaynak and Hartley (2008) have extended quality management practices to the supply chain environment through emphasizing supplier quality management and customer focus. Lo et al. (2007) indicate that customer focus, continuous improvement and total involvement of suppliers would improve supply chain performance. Moreover, Kaynak and Hartley’s (2008) suggest that communication, collaboration, and integration with suppliers and customers are important to the firm’s performance. The overall conclusions of previous studies recommend that quality management practices (at the firm level) are a prerequisite for supply chain quality (Mellat-Parast, 2013).
18
Quality has been generally defined as “fitness for use” and “those product features which meet customer needs and thereby provide customer satisfaction” (Juran & Godfrey, 1999). Service quality and customer satisfaction are related concepts that are sometimes misunderstood as synonymous but theoretical and empirical research mostly support the view that they are distinct concepts and that quality performance leads to satisfaction (Juga, et al., 2010).
Satisfaction has been defined by many authors. On Saura, et al. (2008), someone can find selected definitions which have been written by other authors. Satisfaction is defined as a process of evaluating or measuring a purchase experience where expectations are compared with the result. Other authors relate satisfaction to process result, in other words to the response or state of the customer considering consumption of the product. (Saura, et al., 2008).
It is recognized that the expectations and perceptions of customers related to service processes such as convenience, flexibility, personalized attention, and information are important in the measurement of customer satisfaction. The service processes that are associated with customer-supplier interfacing may play an important role in the enhancement of customer satisfaction and in the influence of customer behavior on a supply chain (Man, 2006). Long-term relationship can affect customer’s satisfaction and evolves through continuous improvement, developing trust and sharing risk and reward. High delivery performance makes the customer happy, and raises the reputation of shippers (Man, 2006). There is general agreement that customer retention is less costly than customer acquisition; a common rule of thumb is that it costs five times as much to acquire a new customer as to retain an existing customer (Knemeyer & Murphy, 2005).
3.2Performance Measurement
Supply Chain Management is a key strategic factor for increasing organizational effectiveness and efficiency (Gunasekaran, et al., 2001). According to the marketing perspective, organizations achieve their performing goals, by satisfying their customers with greater efficiency and effectiveness than their competitors (Neely, et al., 1995). Effectiveness refers to the extent to which customer requirements are met, while efficiency is a measure of how economically the firm′s resources are utilized when providing a given level of customer satisfaction (Neely, et al., 1995). This is an important point because not only it identifies two fundamental dimensions of performance, but also highlights the fact that there can be internal as well as external reasons for pursuing specific courses of action (Neely, et al., 1995). Improving supply chain performance has become one of the critical issues for gaining competitive advantages for companies (Cai, et al., 2009).
19 3.2.1Purpose
In the cycle of never-ending improvement, performance measurement plays an important role on identifying and tracking progress against organizational goals, identifying opportunities for improvement and comparing performance against both internal and external standards (Department of Trade and Industry, 2005). There are several reasons for measuring organizational performance: identify success; identify whether customer needs are met; help the organization to understand its processes and to confirm what they know or reveal what they do not know; identify where problems, bottlenecks, waste exist and where improvements are necessary (Parker, 2000); provide factual decisions; enabling progress; tracking progress; facilitate a more open and transparent communication and cooperation (Gunasekaran & Kobu, 2007); and highlight quality problems and determine areas for priority attention (Department of Trade and Industry, 2005). The traditional business performance measures have been mostly financial by measuring rate of return on investment, cash flow and profit margins. However, the conventional measures have their weaknesses and they have been unsuccessful to incorporate intangibles and lagging indicators. This forced researchers and companies to reconsider the performance measures and metrics in the new economic environment (Parker, 2000).
According to Neely et al. (1995) the core purpose of a performance measurement system (PMS) is for quantifying the efficiency and/or effectiveness of action. A PMS can be analyzed by asking questions such as “What performance measures are used? What are they used for? How much do they cost? And what benefit do they provide?”. To address these questions PMS can be seen to encompass key performance indicators (KPIs), which may be seen as a representative set of measures, and logically establish interrelationships among those measures. These KPIs comprise a set of both financial and non-financial measures (Kaplan & Norton, 1992).
3.2.2 Definition
Performance measurement can be defined as the process of quantifying the efficiency and effectiveness of an action. A performance measure is a set of metrics used to quantify the efficiency and/or effectiveness of an action (Neely, et al., 1995). A performance measurement system should provide managers with sufficient information to address issues such as finance, customer internal processes and innovation and improvement (Kaplan & Norton, 1997). The term ‘‘metric’’ refers to definition of the measure, of how it will be calculated, who will be carrying out the calculation, and from where the data will be obtained (Neely, et al., 1995). The main challenge is to identify the key performance measures for value-adding areas of an organization and then the factors that will affect the core business processes that create wealth to customers (Gunasekaran & Kobu, 2007).
20 3.2.3 Problems and challenges
Researchers believe that performance measures and metrics will facilitate a more open and transparent communication between people, will lead to a co-operative supported work environment and thus, improve organizational performance (Gunasekaran & Kobu, 2007). In the context of a supply chain, performance measurement system becomes more important and in the recent years firms realized the potentials of the SCM (Gunasekaran, et al., 2001). Many organizations are endeavoring to capture the benefits of shorter lead times, flexibility in production, shorter product development time and win-win approaches (Gopal & Thakkar, 2012). A Supply Chain measurement system has to be valid, robust, integrative, economical and compatible and not to be seen as a disparate mixture of individual metrics (Caplice & Sheffi, 1994). Designing the supply chain performance measurement system is a challenging task and it needs practical guidelines (Gopal & Thakkar, 2012).
When companies implement performance measurements systems may encounter some issues regarding (Gopal & Thakkar, 2012):
1. lack of connection with strategy
2. focus on cost to the detriment of non-cost indicators 3. lack of a balanced approach
4. insufficient focus on customers and competitors 5. loss of supply chain context
6. lack of a clear distinction between metrics at strategic, tactical, and operational levels (Gunasekaran, et al., 2001).
Holmberg (2000) summarizes typical problems in a performance measurement system such as the organization’s strategy and measurement system are not connected, a biased focus on financial metrics is given, and too many isolated and incompatible measures are used. Holmberg’s (2000) study focuses on the incompatible measures and tries to minimize the overlap and incompatibility by reducing the number of metrics used in a PMS. Therefore, a set of metrics, which is consisted of a small number of items, needs to be determined in order to measure a SCM system’s performance with maximum effectiveness and minimum operating cost (Gunasekaran & Kobu, 2007).
21 3.2.4 Design performance measurement
As it has mentioned before monitoring and improving the performance of a supply chain has become an increasingly complex task for companies to improve supply chains' effectiveness and efficiency. A complex performance management system includes many management processes, such as identifying measures, defining targets, planning, communication, monitoring, reporting and feedback (Cai, et al., 2009). When the Supply Chain performance measures developed appropriately, managers ought to identify the KPIs that have to be enhanced. Nevertheless, it is not always an easy task to figure out the relationships concerning the different KPIs and to prioritize the order of the individual KPIs accomplishment. Indeed, this determination of priorities within a given set of metrics has been one of the biggest problems that the companies have to overcome to improve their SCM (Cai, et al., 2009).
Maskell (1989) suggests seven principles of PMS design: (1) the PM should be directly related to firm’s strategy; (2) non-financial measures should be adopted; (3) measures should vary between departments; (4) measures should change as circumstances do; (5) measures should be simple and easy to use; (6) measures should provide fast feedback; and (7) measures should stimulate continuous improvement. It is of high importance to figure out which performance measures are inter-connected to the success of a PMS. As a matter of fact, this can be identified by the evaluation of two independent factors of a specific SCM system:(a) performance measured by actual results; and (b) performance measured by a few pre-selected metrics (Gunasekaran & Kobu, 2007). Selection of supply chain measures is critical because managers have to evaluate supply chain on various aspects as a whole entity rather than on an individual basis. Decision-makers in supply chains focus on developing measurement metrics for evaluating performance (Gopal & Thakkar, 2012). Gunasekaran et al.(2001) based on the existed literature have provided an overview of the various performance metrics across the supply chain and have described sources using these performance metrics in the following diverse ways such as:
qualitative or quantitative;
cost and non-cost;
quality, cost, delivery and flexibility;
supply chain collaboration efficiency; coordination efficiency and configuration;
strategic, operational or tactical focus;
supply chain operations reference (SCOR) model (plan, source, make, deliver and return or customer satisfaction); whether they measure cost, time, quality, flexibility and innovativeness; and, whether they were quantitative or qualitative;
key performance measures and metrics in supply chain;
Balanced scorecard approach; and
22 3.2.5Features of KPIs (or metrics)
Thakkar et al.(2009) proposed some features for the performance metrics used in SC performance measurement:
the essence of organizational performance should be captured from the measurement system;
the measurement system should guarantee a suitable assignment of metrics to the areas where they would be most applicable;
minimum deviations should exist between the organizational goals and measurement goals;
an adequate balance between financial and nonfinancial measures should be reflected by metrics; and
the measures should reflect their clear linkages with various levels of decision making such as strategic, tactical, and operational level (Thakkar, et al., 2009).
3.3 Methods to evaluate and measure the Supply Chain Performance
As it was referred in the previous section, there is a need of performance measurement system at different levels of decision-making. Several methods of measuring and evaluating the performance exist, however the most common are the SCOR method and the Balanced Scorecard (BSC). A brief description of the SCOR model would be given, since this thesis is focusing on the implementation of the BSC.
The BSC was chosen as the method that it would be implemented on this thesis because it was considered as the most appropriate and suitable method for the case company, and this will be explained further on Chapter 4.
3.3.1SCOR model
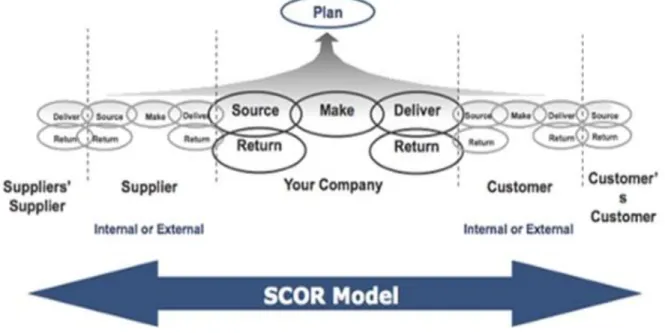
The Supply-Chain Operations Reference (SCOR) model was developed by the Supply-Chain Council (SCC) to assist firms in order to increase the effectiveness of their supply chains, and to provide a process-based approach to SCM (Stewart, 1997). In order to identify, measure, reorganize and improve supply chain processes SCOR model can be used. The SCOR model provides a common process for communicating among supply-chain partners (Huan, et al., 2004). The five distinct processes for the SCOR model are: Plan, Source, Make, Deliver and Return.
o Plan: levels of aggregation and information sources o Source: locations and products
o Make: production sites and methods
o Deliver: channels, inventory deployment and products
23
These processes are defined in increasing levels of details beginning with a description of the overall process. The processes are further divided into process elements, tasks, and activities. Each basic supply chain is a “chain” of source, make, and deliver execution process. Each interaction of two execution processes (source-make-deliver) is a “link” in the supply chain. Planning sits on top of these links and manages them (Huan, et al., 2004).
Figure v Supply chain decision categories mapped to the SCOR model (Supply Chain Council, 2012)
The performance section of SCOR is consisted by two types of elements: Performance Attributes and Metrics. SCOR Level 1 metrics are strategic, high-level measures that cross multiple SCOR processes. Lower level metrics are associated with a narrower subset of processes (Supply Chain Council, 2010).
A performance attribute is a group of metrics used to express a strategy. An attribute itself cannot be measured; it is used to set strategic direction. SCOR identifies five core supply chain performance attributes: Reliability, Responsiveness, Agility, Costs, and Asset Management. Consideration of these attributes makes it possible to compare an organization that strategically chooses to be the low-cost provider against an organization that chooses to compete on reliability and performance (Supply Chain Council, 2010).
Measuring the performance of the supply chain and comparing against internal and external industry goals is focused on:
o Reliability - achievement of customer demand fulfillment on-time, complete,
24
o Responsiveness - the time it takes to react to and fulfill customer demand
o Agility - the ability of supply chain to increase/decrease demand within a given
planned period
o Cost - objective assessment of all components of supply chain cost
o Assets - the assessment of all resources used to fulfill customer demand (Supply
Chain Council, 2012).
A metric is a standard for measurement of the performance of a process. SCOR metrics are diagnostic metrics. SCOR recognizes three levels of predefined metrics. Level I is the top level that deals with process types. Level II is the configuration level and deals with process categories. Level III is process element level and is the lowest level in the scope of the SCOR model. The SCOR model endorses 12 performance metrics. The SCOR model levels II and III supporting metrics are keys to these 12 level I metrics, which fall into four categories (Supply Chain Council, 2010). By providing a complete set of supply chain performance metrics, industry best practices, and enabling systems’ functionality, the SCOR model allows firms to perform very thorough fact based analyses of all aspects of their current supply chain (Huan, et al., 2004).
3.3.2Balanced Scorecard
Kaplan and Norton(1992) have proposed the Balanced Scorecard, with the purpose to evaluate organization’s performance. The organization’s mission and strategy are interpreted by the BSC, into a comprehensive set of performance measures which provide the framework for a strategic measurement and management system based on four different perspectives (Kaplan & Norton, 1996). Moreover, the BSC is used in order to support businesses into new strategies, decrease the cost and employ growth opportunities based on more customized, value-adding products and services (Bhagwat & Sharma, 2007).
The four different perspectives of the BSC are the following: the financial, the internal business process, the customer, and the learning & growth. The BSC is designed to harmonize “financial measures of the precedent performance with measures that drive to the future performance” (Kaplan & Norton, 1992). There is an intention to keep score of a set of items that maintain a balance “between short term and long term objectives, between financial and non-financial measures, between lagging and leading indicators2 and between internal and external performance perspectives” (Kaplan & Norton, 1992). The BSC gives the opportunity to track the short-term financial results while simultaneously monitoring their progress in building the capabilities and acquiring the intangible assets that generate growth for future financial performance.
2 Lagging measures (outcomes) tell what has happened; leading measures (performance drivers) predict what will
happen, for example, customer survey results about recent transactions might be a leading indicator for customer retention, while customer retention is itself a lagging indicator (Evans, 2004).
25
The BSC should be used as a key feature for the management system and not as a tool to control behavior and evaluate past performance. BSC has the ability and gives the opportunity to communicate the strategy, align individual and teams to the strategy, establish long-term strategic targets, and provide feedback and learning about the strategy (Kaplan & Norton, 1996). Based on Kaplan and Norton (1996), the feedback and learning process should be considered as the most important and innovative aspects of the entire Balanced Scorecard management process, since feedback provides the capability for organizational learning at the executive level. The Balanced Scorecard enables managers to monitor and adjust the implementation of their strategy, and to make fundamental changes in the strategy itself.
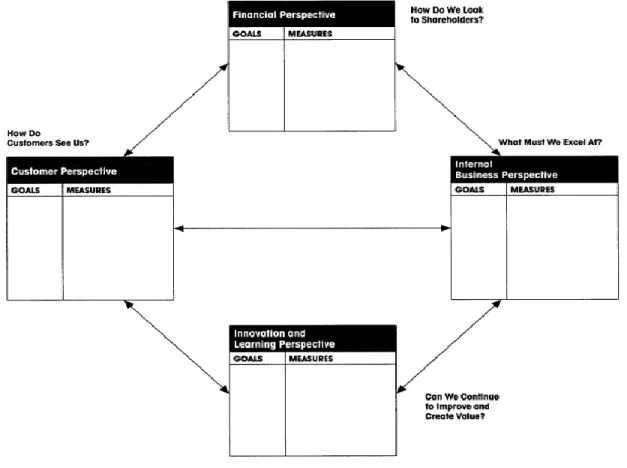
In the following figure, it is illustrated how the BSC looks like. The customer perspective is the value-adding view and the mission is to achieve the company’s vision by delivering value to the customer. The financial perspective represents the shareholders’ view and the mission is to succeed financially, by delivering value to the shareholders. Moreover, the internal perspective is the process-based view and has a task to promote efficiency and effectiveness in the business process. Finally, the innovation and learning perspective embody the future view, since the mission is to achieve the company’s vision, by sustaining innovation and change capabilities, through continuous improvement and preparation for future challenges (Kaplan & Norton, 1992).
26
A more analytical description of the four perspectives of the BSC is given successively.
How do we look to shareholders? Measuring and evaluating financial metrics
The financial performance measures specify whether the company's strategy, implementation and execution plan are effectively contributing to the bottom line improvement of a firm. Financial goals take into account how to achieve “profitability, maintain liquidity and solvency both in short and long term, growth in sales turnover and maximize wealth of shareholders. The financial goals have as a purpose the survival, success and prosperity of the company. Survival is measured by cash flow, success by growth in sales and operating income and prosperity by increased market share and return on equity and capital employed” (Bhagwat & Sharma, 2007).
How do customers see us? Measuring and evaluating customer perspective
The customer performance measures should answer the question of how do customers see the business. The management must translate the general mission statement on customer service into specific measures that reflect the factors that really matter the customers. The customers are concerned for the lead-time, the quality of products and services, the company's performance service and the cost effectiveness (Bhagwat & Sharma, 2007).
What must we excel at? Measuring and evaluating internal business perspective
The internal measures for the BSC represent what the business must excel at. It comes from the business process that have the greatest impact on customer's satisfaction aspects, since the cycle time, the quality, the skills of employees, and productivity are affected. When the organizations decide the processes and competencies that they must excel at, then they should specify measures for each of them (Bhagwat & Sharma, 2007).
Can we continue to improve and create value? Measuring and evaluating innovation and learning perspective
The ability to innovate, improve and learn leads directly the company to create value. The processes that are related with innovation and continuous learning (learning and growth) can affect the efficiency of the businesses’ operation. Furthermore, it can guarantee the cost reduction and product differentiation in order to meet customized requirements. Thus, the financial ability of the organization is boosted through gaining higher profitability and greater degree of profit (Bhagwat & Sharma, 2007).
27
3.3.2.1Principles for developing the BSC
In order to develop the BSC, there are three principles that the companies should adhere based on Kaplan and Norton (1996) and those principles are seen as a group of isolated and eventually conflicting strategies and measures:
– Build in cause-and-effect relationships
The Balanced Scorecard should not be only a collection of critical indicators or key success factors. The multiple measures on an accurately well-build Balanced Scorecard should be consisted of a linked series of objectives and measures that are both dependable and equally supporting (Kaplan & Norton, 1996). In order to translate and communicate firm’s vision and strategy, the cause-and-effect relationships should be adequately reflected on the BSC (Bhagwat & Sharma, 2007).
All or several of the four perspectives in the BSC framework can be engaged by the cause-and-effect relationships. Cause-and-cause-and-effect relationships can be explained with the following example: “flexibility of service systems to meet particular customer needs (internal business operations perspective) will be more likely to meet customer expectations (customer perspective). Higher level of customer expectations will lead companies to supply more innovative products and services (learning and growth perspective). This in turn will increase the market share and profitability (financial perspective)” (Bhagwat & Sharma, 2007).
– Include sufficient performance drivers
An adequately constructed BSC should include a suitable mix of outcome measures which are more or less generic and performance drivers which are more company-specific and will often be based on the particular strategy that is being pursued. “Outcome measures like total supply chain cycle time without performance drivers like buyer–supplier partnership level do not communicate how the outcomes are to be achieved. Furthermore, the performance drivers without outcome measures may enable the achievement of short-term operational improvements, but will fail to reveal whether the operational improvements have been translated into enhanced financial performance” (Kaplan & Norton, 1996).
– Provide a linkage to financial measures
The BSC has as a critical aim to support management in a manner that improves the overall financial performance of the enterprise. “A failure to convert improved operational performance into improved financial performance should send executives back to the drawing board to rethink the company’s strategy or its implementation plans” (Kaplan & Norton, 1996). Additionally, the measurements are not adequate on their own, because they must be used and acted upon by the
28
management. Not only is the BSC an operational tool, but also it can offer the base for strategic management system (Bhagwat & Sharma, 2007).
3.3.2.2Development of BSC
Companies should formulate the goals for time, quality, performance and service and then translate these goals into specific measures for the BSC to work appropriately. In order to implement effectively the BSC as a strategic management system for measuring and evaluating the SC the following steps may be followed:
– Clarify and translate the vision and strategy into specific action programs; – Link strategic objectives to team and individual goals;
– Link strategic objectives to resource allocations;
– Review performance data on a periodic basis and adjust the strategy as appropriate (Bhagwat & Sharma, 2007).
Before developing the BSC, it is essential to have a common understanding of the SCM related tasks in the organization and also the well-defined specific goals and objectives. The metrics included in the BSC should meet three criteria. They should be quantifiable, easy to understand, and ones for which data can be collected and analyzed in cost-effective manner. Moreover, when certain attributes do not have the metrics that can be measured directly into quantifiable terms, they should be measured by quantitative metrics (Bhagwat & Sharma, 2007).
Based on Kaplan’s interview, he mentions the following for the extensive implementation in organizations and the success of the BSC. “It can be said that the BSC provides the missing link
between vision and strategy to employee’s everyday actions by translating into clear strategic priorities and initiatives and relating these to clear tangible strategic outcomes the organization and its employees have to strive for: satisfied shareholders, delighted customers, efficient and effective processes and a motivated workforce” (Waal, 2003).
“In this way, the Balanced Scorecard makes strategy everyone’s job. And because all
organizations face the aforementioned gap, especially when they transfer from the traditional command and control style which used to work well in the old days, to the empowerment style of modern times, they need something like the Balanced Scorecard to help them bridge the gap. The traditional financial system cannot convey the importance of these intangibles (people, processes, innovation) to senior executives and to front line employees. The Balanced Scorecard can” (Waal,