Enhancing the Monitoring of Real-Time
Performance in Linux
Author: Nima Asadi
nai10001@student.mdh.se
Supervisor: Mehrdad Saadatmand mehrdad.saadatmand@mdh.se
Examiner: Mikael Sj¨odin mikael.sjodin@mdh.se
I would like to thank my supervisor Mehrdad Saadatmand for his guidance and help during the helpful discussions that we had in our meetings. Furthermore, I would like to express my thankfulness to Mikael Sj¨odin for his help in publishing a scientific paper based on this thesis work with his comments and feedback. Also, I want to thank Nima Moghaddami Khalilzad for his very insightful advice on the design and modification of the real-time module.
There is a growing trend in applying Linux operating system in the domain of embedded systems. This is due to the important features that Linux benefits from, such as being open source, its light weight compared to other major operating systems, its adaptability to different platforms, and its more stable performance speed. However, there are up-grades that still need to be done in order to use Linux for real-time purposes. A number of different approaches have been suggested in order to improve Linux’s performance in real-time environment. Nevertheless, proposing a correct-by-construction system is very difficult in real-time environment, mainly due to the complexity and unpredictability of them. Thus, run-time monitoring can be a helpful approach in order to provide the user with data regarding to the actual timing behavior of the system which can be used for analysis and modification of it. In this thesis work, a design for run-time monitoring is suggested and implemented on a real-time scheduler module that assists Linux with real-time tasks. Besides providing crucial data regarding the timing performance of the system, this monitor predicts violations of timing requirements based on the current trace of the system performance.
Acknowledgements ii Abstract iii Contents iv List of Figures vi 1 Introduction 1 1.1 Problem Statement . . . 1 . . . 1 1.2 Goals . . . 2 1.3 Thesis Structure . . . 3 1.4 Report Structure . . . 3 2 Background 4 2.1 An Introduction to Real-Time Systems . . . 4
2.1.1 Real-time Operating System Kernel . . . 4
2.1.2 Tasks . . . 5
2.1.3 Scheduling . . . 7
2.2 A Short Overview of the Commonly Used RTOSs . . . 9
2.3 An Overview of the Common Approaches Toward a Real-time Linux . . . 11
2.3.1 Interrupt Abstraction . . . 11
2.3.2 RTLinux . . . 12
2.3.3 RTAI . . . 13
2.3.4 Xenomai . . . 14
2.3.5 Reducing the Latencies . . . 14
2.3.6 Preemptive Kernel Patch . . . 15
2.3.7 Low latency Patch . . . 17
2.3.8 Monta Vista . . . 17
2.3.9 TimeSys . . . 18
2.3.10 Preempt rt Patch . . . 18
2.3.11 LITMUSRT . . . 19
2.3.12 Enhancing the Timing Resolution . . . 21
2.4 Monitoring . . . 23
2.4.1 Linux Native Monitoring Tools . . . 24
2.4.1.1 Sysstat Project . . . 24
2.4.1.2 Mpstat . . . 25
2.4.1.3 Pid Stat . . . 26
2.4.1.4 Top . . . 27
2.4.1.5 Vmstat . . . 29
2.4.1.6 Gnome Desktop Environment Tool . . . 30
2.4.1.7 KDE System Guard . . . 30
2.4.1.8 Proc File System . . . 33
2.4.1.9 Summary . . . 34
2.4.2 An Overview of Related Work on Monitoring of Real-Time Per-formance . . . 35 2.4.3 Hardware Monitors . . . 36 2.4.3.1 Noninterference Method . . . 36 2.4.3.2 PASM . . . 37 2.4.3.3 ART . . . 37 2.4.4 Software Monitors . . . 38 2.4.4.1 PMMS . . . 38 2.4.4.2 Halsall-Hui . . . 38 2.4.4.3 OSE Monitor . . . 39 2.4.5 Hybrid Monitors . . . 39 2.4.5.1 Hybrid Monitor . . . 39 2.4.5.2 ZM4 . . . 40 2.4.5.3 SoC-based Monitor . . . 40 2.4.6 Summary . . . 40 . . . 41 3 Solution 42 . . . 42 3.1 Module . . . 43 3.1.1 ExSched . . . 43
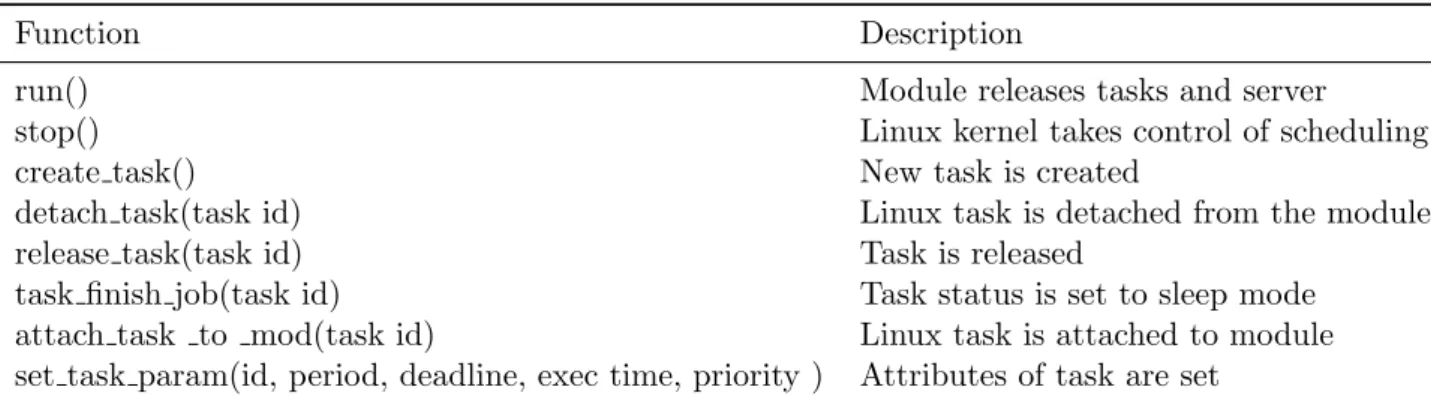
3.1.2 Communication Between Tasks (API) . . . 44
3.1.3 Tasks and Queues . . . 45
3.2 Monitor . . . 46 . . . 46 . . . 47 . . . 48 . . . 49 . . . 50 . . . 51 3.2.1 Design Features . . . 52 3.2.2 Design Limitations . . . 53 3.3 Implementation . . . 53 4 Evaluation 56 5 Summary and Future Work 64 5.1 Summary . . . 64
2.1 A diagram of overall design structure of RTLinux . . . 12
2.2 A diagram of overall design structure of Xenomai . . . 15
2.3 A diagram of how timers are managed inside Linux kernel. . . 22
2.4 An example of Top command output . . . 28
2.5 An example of Vmstat output . . . 31
2.6 An example of KDE System Guard output . . . 32
2.7 An example of Proc File System output . . . 35
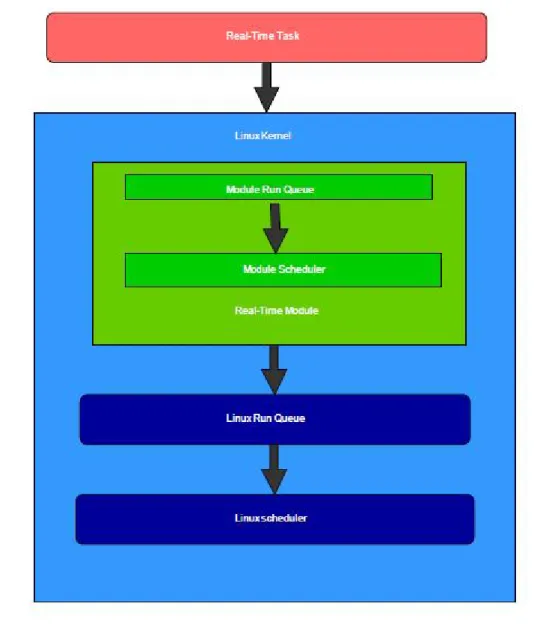
3.1 Module . . . 44
3.2 A schematic view of the data collection and analysis process in the monitor 47 3.3 Accessing Linux Kernel Buffer through applications . . . 48
3.4 A schematic view of the monitor in combination with the real-time module. 49 3.5 As can bee seen, the completion time of T1 is getting closer to its deadline. 51 3.6 Sequence Diagram of the Monitoring Process . . . 52
4.1 scheduling of T, T2, T3, and the monitoring task(M) with EDF . . . 57
4.2 The effect of a high frequency monitoring task on target system’s behavior 57 4.3 T1, with a deadline equal to 1800, has a tardiness of 120 milliseconds. . . 58
4.4 A part of the monitoring output for EDF scheduling of T1, T2, T3, and M 59 4.5 scheduling of T1, T2, and the monitoring task (M) with FPS . . . 60
4.6 The measured amount of the overhead imposed by the monitoring thread with different periods . . . 62
4.7 Rate of deadline misses corresponding to period of the monitoring task . . 63
Introduction
This thesis was carried out at the Intelligent Embedded Systems faculty of the IDT (Innovation, Design, and Engineering) school at M¨alardalen University (MDH), a research university in Sweden. Linux is an open source operating system (OS) which is widely used in computers, mobile phones, cars, electrical appliances, and many other systems. While Linux OS has proven to have the advantages such as flexibility towards different systems and stable performance speed, it has also shown low predictability when it comes to real-time applications. This thesis aims to improve the monitoring capability of Linux’s timing behavior in real-time environments.
1.1
Problem Statement
Despite the development of static timing analysis approaches for achieving a correct-by-construction design for systems regarding their timing constraints, vio-lation of those constraints can still happen in real-time environments due to various reasons. One important way to obtain crucial data regarding the actual timing behavior of systems in real world experience is run-time monitoring. However, despite the improvements in designing run-time monitors, significant amount of work needs to be done in optimizing these approaches regarding the main issues with these monitors. Such issues include latency that the monitor adds to the system, accuracy, device limitations, etc.
Linux operating system has proven to benefit from significant features that makes it adaptable to many frameworks. Nonetheless, like any other general-purpose operating systems, it is highly vulnerable to timing constraint violations in real-time environments. The effort in this thesis work is put on the design and
implementation of a timing behavior run-time monitor for Linux operating system with the emphasis of reducing the latency imposed by the monitor while providing comprehensible monitoring facility.
1.2
Goals
The goals of this thesis work are:
• Study of various methods suggested to enhance the real-time capabilities of Linux OS and different approaches suggested to design a mechanism for monitoring of timing behavior in a system
• Suggesting a low-overhead monitoring system to evaluate Linux OS perfor-mance in real-time environment
• Implement and evaluate the suggested solution for enhancing the monitoring capabilities of timing performance of Linux OS in real-time environment. The goals of this thesis were obtained by:
• Study of concepts related to real-time operating systems
• Study of Linux kernel and evaluating its performance when dealing with real-time tasks
• Study of other common real-time operating systems which are especially used in embedded systems
• Study of approaches suggested for enhancing the real-time performance of Linux OS
• Study of suggested methods for monitoring of timing performance in different systems
• Suggestion of a mechanism to enhance the monitoring capabilities of real-time behavior of Linux OS
• Implementation of the monitoring method in the system with the assistance of a real-time module
• Evaluation of the results of the monitoring method regarding accuracy and latency
1.3
Thesis Structure
This thesis consists of two main parts. In the first part, focus has been put on studying the related work regarding different operating systems used in embed-ded systems, their flaws with handling real-time tasks, the enhancements made to them, and enhancements made to Linux regarding its real-time properties. More-over, a more in depth survey of various methods and tools for run-time monitoring of timing behavior in real-time and non-real-time systems was conducted regarding this part, which can be found in [1]. In the second section, the design, implemen-tation, and evaluation of a mechanism for run-time monitoring of timing behavior in Linux OS in real-time environment is presented.
1.4
Report Structure
The thesis report starts with an introduction in chapter 1. Chapter 2 can be divided in to three main parts; in the first part, an introduction to the neces-sary concepts and definitions in the field of real-time systems is presented. This introduction briefly covers different scheduling methods, task types, and other definitions related to this thesis work. In second part of chapter 2,a very brief overview of some commonly used real-time operating systems as well as common approaches suggested to enhance the real-time performance of Linux is presented. Monitoring of timing behavior is the focus of the third part of chapter 2, which covers a selected number of Linux native monitoring tools as well as a number of tools designed for monitoring of timing behavior in different systems. Chapter 3 is dedicated to the design of a time module developed for enhancing the real-time performance of Linux OS, and design and implementation of a mechanism for monitoring of timing behavior of Linux in real-time environments. In chapter 4, an evaluation of the suggested method is provided. The report is finished by a summary and discussion about the future work in chapter 5.
Background
2.1
An Introduction to Real-Time Systems
The difference between a real-time operating system (RTOS) and a non-real-time operating system is that an RTOS is specially designed to run time-crucial ap-plications within their timing constraints. For example, a vehicle engine control system needs to perform controlling actions on exact times in order to prevent catastrophic consequences. A medical heart signal displayer, an anti-lock brake, and a function controller in a factory are other examples of timing crucial tasks, also known as real-time tasks. Thus, it is clear that the maximum time used for an operation is a necessity for the RTOSs to have. These timing constraints are used and implemented in rules called scheduling policies that mainly prioritize tasks based on how crucial their timing features are. The real-time systems are com-monly divided in to two major groups: hard, and soft. In hard real-time systems the time an application is supposed to be executed plays the main role. In fact, if the system fails to perform a hard real-time application in its specified timing constraints, the consequence can be a catastrophe. On the other hand, a timing failure in performing a soft real-time application does not result in a disaster. An example of hard real-time applications can be the air bag system in a car or the auto-pilot system in an airplane, which must perform decisions on time otherwise the result will be disastrous. An example of a soft real-time applications is an application in a mobile phone, or a game, or live video stream.
2.1.1 Real-time Operating System Kernel
As the main component of an operating system, the kernel is responsible for con-necting the hardware data process mechanism of the system to the application layer. Like most operating systems, the RTOS kernel is responsible for managing
different operations on tasks such as creation, execution, and deletion, according to the policy that the developers set for it. Also, like general-purpose kernels, the tasks of memory management, Interrupt handling, and managing I/O communica-tions are performed by the RTOS kernel. However, the main difference between an RTOS kernel and a general-purpose kernel lies in the fact that the non-real-time kernels do not guarantee that they can perform a real-time application within its timing limitations. Typically, the main constituents of a kernel include the sched-uler, interrupt handler, memory manager, and other services. A brief description of each of the mentioned components is given below.
• Scheduler: the scheduler has the managing role in the kernel. It allocates processor time to different tasks based on the scheduling policy (or policies) that are designed for it. A description of some of the common scheduling policies mentioned in this report is given later.
• Interrupt handler: the interrupt handler is responsible for managing the requests from different hardware tools as well as system calls. An interrupt handler can either be initiated by interrupts coming from the hardware or execution of interrupt codes in software.
• Memory manager: memory management section provides users of kernel re-sources with the location in system memory (memory allocation).
• Other Services: depending on the application requirement and type, and also the kernel design, a number of background activities occur when the kernel is operating. These activities include synchronization of shared resource ser-vices, supervision of the task resource allocation, and timing synchronization. In next sections a description of basic concepts of the field of real-time systems is provided.
2.1.2 Tasks
A task represents a single process or multiple processes that the operating system must execute. A process is a single instance of a task. Processes receive their necessary resources from the operating system. A job is a set of tasks. In real-time world, each task is assigned a set of timing constraints such as release time, period, execution or computation time, response time, and deadline. In the sections below, some of the basic concepts used in real-time system analysis are explained.
• Release Time: the instance that a task gets ready for scheduling is called the release time of that task.
• Period: a task period is a time span after which the next task instance is released. This parameter is used for periodic tasks, i.e. the tasks in which each interval is started in regular interval.
• Execution Time: the time spent by the system to execute a task is called the task execution time.
• Response Time: the time span between a task release and its execution completion is called response time of that task.
• Deadline: a very important task parameter in real-time systems is task dead-line. There are two terms regarding to deadline that are used commonly in real-time analysis: absolute deadline, and relative deadline. A task’s abso-lute deadline is the instance by which the task execution must be completed, and the relative deadline is defined as the maximum allowed response time of a task.
• Periodicity: a single instance of a task execution is called task instance. Some tasks show periodic behavior, meaning that the task instances execute within fixed time intervals. A monitor display update can be an example of a periodic task. However, some tasks do not show the regular behavior of periodic tasks. The reason for such behavior can stem from external interferences. For example, an external signal can be received by the system at any time, whether it comes from the environment or a pressed button. When there is no regular timing between the instances of a task, it is called an aperiodic task. Since because of the irregular nature of aperiodic tasks different instances of such tasks can enter the system in very short time intervals, meeting the deadline cannot be fully guaranteed. Consequently, such tasks are assigned soft deadlines. However, for another type of non-periodic tasks where the minimum time interval between the occurrences of two consecutive instances (Minimum Inter-Arrival Time, also known as MIAT) is given, a hard deadline can be used. Such tasks are called sporadic tasks.
• Task state: since a CPU time must be allocated to all of the tasks, most, or some of the tasks need to stay in a line to wait for their running time to come, where the amount of waiting depends on the tasks. The tasks in the waiting line are in a state called suspended state. Depending on the kernel structure, a task has different types of states. Three general states that a task could have are: ready, running, and suspended.
• Ready state: s task is placed in the ready state when it receives all the resources and data it needs for execution, and is waiting for the scheduler to let it run in its assigned CPU time.
• Running state: when the time reaches for the task to get executed, it is placed in running state.
• Suspended state: a task is in suspended state when it is waiting for the shared resources to be available, or an event to happen.
• Priority: since not all the tasks can be run at the same time, and also, some tasks can be more important than the other ones, each task in real-time systems is assigned a priority. Clearly, the priority of a task depends on its importance. Moreover, the priority of a task depends on the scheduling policy.
2.1.3 Scheduling
As stated before, different tasks are not able to use the CPU time at the same time, thus, there must be an order by which the CPU time is distributed among them. The task of distributing CPU time among all the tasks is performed by the scheduler. The order of execution depends on the policy, or policies, that the programmer designs the scheduler structure in. Below a description of the most common scheduling policies is presented. In general scheduling algorithms are divided in to two major groups: offline scheduling and online scheduling. In offline scheduling all the tasks are scheduled before the execution starts. Clearly, in this method all the tasks to be executed by the system as well as the resources they need to be executed and timing constraints are known. While using this scheduling method the CPU time can be managed optimally, the disadvantage is that it does not take care of tasks that are created during the execution. Also, this method can only manage periodic tasks. In online scheduling however planning is done during the system execution time. In this method task characteristics and needs are presented to the scheduler when the task enters the schedule. An advantage of online scheduling is that it can handle all periodic, aperiodic, and sporadic tasks. However, due to run time computation the scheduling overhead is high. There is also another common classification of scheduling algorithms which places them into periodic or non-periodic tasks algorithms. Rate monotonic scheduling (RMS) and earliest deadline first (EDF) are two most famous periodic algorithms that are briefly described below.
In rate monotonic scheduling the priorities of tasks depend on their period. The shorter the task period, the higher its priority is. Thus, tasks in this method have static priority, meaning that they keep their priority during the whole system execution time.
• Earliest Deadline Frist:
In EDF scheduling policy, whenever a number of task instances are ready to be executed, the scheduler looks for the task instance which is closest to its deadline, and executes it first to make sure that no task loses its deadline. However, the higher overhead of deadline calculations in this method, especially when the system is overloaded, is a disadvantage of this model.
The non-periodic tasks however need different scheduling approaches, because even their release time is not known. The most common scheduling algorithms for non-periodic tasks is presented here:
• Background Scheme:
In background scheme the non-periodic tasks plays the role of a background task, meaning that they are scheduled only if there are no ready periodic tasks. Con-sequently, only the scheduler idle time is allocated to non-periodic tasks. Also, whenever a periodic task is ready again, the scheduler halts the non-periodic task, and runs the periodic task. While this method is easy to implement, it has the disadvantage that it cannot guarantee that all non-periodic tasks meet their dead-lines.
• Polling Server:
In polling server, the periodic task plays the role of a server. Non-periodic tasks are assigned a slice of CPU time, called execution budget. The non-periodic tasks are scheduled to be run in time intervals equal to their execution budgets. This execution budget is consumed by the tasks at rate of 1 per time unit. The non-periodic tasks can be preempted if their execution budget is replenished. When the polling server is released again, the budget is refueled again to its execution time, unless it does not find any non-periodic tasks. In case the polling server does not find any non-periodic tasks its budget is set to zero.
• Deferrable Server:
The aim of using deferrable server is to improve the response time of non-periodic tasks in polling servers. In this method, instead of setting the budget to zero when
there is no non-periodic tasks at the beginning of the server release, the unused budget is retained throughout the server period in order to be used whenever there are aperiodic tasks. Note that the budge in this server is not transferred from one period to the next one.
2.2
A Short Overview of the Commonly Used RTOSs
• Free RTOS
Free RTOS is a famous and simple real-time operating system. This operating system is mainly written in C programming language. Also, making use of a simple and small kernel makes this OS compatible for embedded systems. It also has shown to have low overhead.
Task attributes: priority The scheduling policy: fixed-Priority preemptive schedul-ing, Round-robin(RR) for threads with the same priority
• Enea OSE
Enea OSE is a product of the Swedish firm, Enea AB. This compact real-time operating system has been widely used in mobile phones. A compatible platform for this OS is the ARM family. Also, The multicore version of this OS, Enea OSE Multicore, was released in 2009 based on the same kernel architecture as Enea OSE.
Task attribute: priority Scheduling policy: fixed-Priority preemptive scheduling, periodic scheduling, Round-robin scheduling for tasks with the same priority
• Windows Embedded CE
Windows Embedded CE, also known as WinCE, is a Microsoft product developed for embedded systems and microcontrollers. This OS, which was written in C pro-gramming language, was first released in 1996, and currently, the seventh version of it is available. Obviously, since Windows CE is designed for embedded systems, it uses a small memory size. Many later platforms such as AutoPC, Windows Mobile 2003, and Windows Phone were developed based on Windows CE kernel. Task attribute: priority, 256 priorities Scheduling: fixed priority preemptive schedul-ing, it only supports one level of priority inversion.
• QNX
QNX is another real-time OS that aims mainly embedded systems. This operating system which was first released in 1982 by Research In Motion, is a Unix-like OS which executes most of the operations in form of small tasks called servers.
Task attributes: no WCET or non-functional attributes specifiable Scheduling policies: FIFO scheduling, Round-robin scheduling, Adaptive scheduling
• Lynx OS
Another Unix-like operating system written in C, C++, and Ada languages is Lynx OS. Lynx was first released in 1986, and currently, the fifth version of this OS is available for users. Lynx is a closed source OS. Simple Priority based scheduling Publishes accurate real-time performance numbers that are in accordance with the system’s performance in real-world situations such as interrupt latency, context switch time, preemption time, and many others.
Scheduling policy: fixed priority preemptive scheduling • VxWorks
VxWorks is a 64- bit real-time operating system that can be used on embedded systems. Supporting shared resources services as well as local and distributed message queues and benefiting from a compact design have made this RTOS useful in different industries that make use of embedded systems, such as in airplane and vehicle production.
Task attribute: priority Scheduling policy: preemptive fixed priority scheduling (256 priority levels), Round robin, Can use Posix (FIFO and RR)
• RT Linux
RT Linux is a modified version of Linux OS that was first released in 2007. The main objective of this kernel is to provide support for hard real-time tasks. Fur-thermore, transparency, and modularity are important points in the development of RT Linux. Linux RT is written in C programming language.
Scheduling policy: EDF(Earliest deadline first), RM(Rate monotonic), can use Posix(FIFO and RR)
• Xenomai
Xenomai is another project aiming at providing real-time support for Linux OS. There are major difference in goals and design of Xenomai and RT Linux which will be discussed in next chapter. Xenomai is compatible for common platforms such as ARM and X86.
Task attribute: priority at the time of creation Scheduling policy: fixed priority preemptive scheduling. FIFO and Round-robin for tasks with the same priority are supported as well
• RTAI
RTAI (Real-time application interface) was developed as a real-time extension for Linux OS. This project which is compliant to POSIX (Portable Operating System Interface), uses a real-time abstraction layer architecture for handling real-time tasks. Discussion about the architecture of RTAI is provided in next chapter. Task attribute: priority (16 bit integers with 0 being the highest priority) Schedul-ing policy: fixed priority preemptive schedulSchedul-ing for both periodic and non-periodic tasks
2.3
An Overview of the Common Approaches Toward a
Real-time Linux
A number of solutions have been suggested for making Linux compatible with real-time environments. In this chapter, an overview of the most common solutions for improving the real-time performance of the Linux operating system is presented.
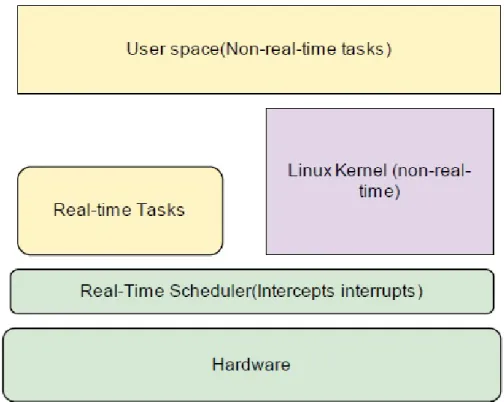
2.3.1 Interrupt Abstraction
The Interrupt abstraction method [2] is based on adding a virtual layer between the kernel and the hardware. This layer, which is called Real-Time Hardware Abstraction Layer (RTHAL), takes the full control of the interrupts and the system timers. This process is done by dividing the interrupt s coming from real-time sources and non-real-time sources. When an interrupt occurs the RHTAL checks if it comes from a real-time source, meaning that it needs to be served immediately. If the interrupt is real-time, it is forwarded to Linux kernel without any hesitations, but if it comes from a non-real-time source, the interrupt is placed in a pending vector along with all other Linux activities, and if there are no real-time tasks, it will be executed. As a matter of fact, all the ordinary Linux threads are given the lowest priority by the abstraction layer, and the real-time events have the high priority. In order to take the full control of the interrupts, the RTHAL renews the cli (disable interrupt) and sti (enable interrupt) function calls so that Linux cannot deactivate the hardware interrupt. When adding an interrupt abstraction layer to the Linux kernel structure provides possibilities such as lowering the latency, it also has disadvantages such as lack of memory protection between the real-time tasks and the Linux kernel due to the fact that the real-time section executes in the same memory space as the Linux kernel codes [3]. In the next sub-sections two main approaches based on Interrupt Abstraction technique, RTLinux and Real-Time Application Interface(RTAI), are discussed.
2.3.2 RTLinux
In RTLinux [2], an interrupt abstraction layer is placed between the Linux kernel and the hardware. A preemptive fixed-priority scheduler takes care of both the real-time tasks and the Linux kernel activities, which run as the lowest priority task. As described before, real-time tasks have the privilege to have direct access to the Linux kernel, meaning that if an interrupt is coming from a real-time source, it is forwarded to the Linux kernel; otherwise it is held in a pending vector. A real-time task in RTLinux is created as a kernel module which can be dynamically loaded, so they do not occupy the virtual memory. When the module is loaded it informs the scheduler about the release time, the deadline, and the period of the task. For starting a real-time task instead of using the system calls, the initialization code is used, which in term gives the information about the three mentioned attributes of a task to the RTLinux kernel [3]. These real-time tasks should be created as simple as possible and the non real-time parts of the code should be left to the user space. Moreover, being compliant with the POSIX 1003.13 the programmers do not have to learn a new API. Though, a disadvantage of the RTLinux is that it is covered by US Patent 5885745, which is not valid outside the USA, which has motivated the programmers to turn to RTAI.
2.3.3 RTAI
RTAI [2] has proven to be a robust and mature approach which has been developed constantly by the community developers. The RTAI project is almost entirely module-based and the kernel patch changes only a few lines of code in the standard Linux kernel. This is best explained in [4]: “it should be noted that Linux is almost unaffected by RTHAL, except for a slight (and negligible) loss of performance due to calling of cli and sti related functions in place of their corresponding hardware function calls, and due to the use of function pointers instead of directly linked functions.”
That real-time tasks are built as modules has the advantage that the RTOS and the real-time task share the same execution space and the system call, therefore, they are implemented as simple function calls instead of slower software interrupts. Moreover, tasks are run in processor supervisor mode which will give them full access to the hardware.
While the main technique used in RTAI is quite similar to the one used in RTLinux, the major architectural difference between these two projects is how they add the real-time features to Linux. Although both of these two use Linux kernel modules that can be loaded to the memory, some differences exist in how much change they make in the standard Linux. In developing RTLinux, the kernel source files are aimed, consequently many modifications have been made in the source file [5]. On the contrary, the interrupt abstraction layer in RTAI has a structure of pointers to the interrupt vector, which localizes the interrupt management. This abstraction layer is built by fewer than 20 lines of modifications and there are only about 50 lines are added to the original code. Also, by changing the pointers in the real-time abstraction layer back to what it was before implementing RTAI, the structure can be changed back to the original one when there is no real-time operation needed. This makes RTAI a more efficient and elegant approach with less intrusion in Linux codes. RTAI task scheduler work is based on preemptive fixed priority scheduling. Also, RTAI gives the permission to have immediate access to the PC hardware by removing the need to first going through the interrupt handling layers of the original Linux kernel [3]. Also by using a loadable module, RTAI executes a subset of POSIX 1003.1.c. As a matter of fact, the POSIX support in RTAI in quite similar to standard Linux except the fact that RTAI does not support signal handling and child parenting function in standard Linux (which are inappropriate for real-time purposes, because all threads are considered as parts of a single process).
2.3.4 Xenomai
Xenomai [6] is a real-time subsystem which can be integrated with Linux kernel in order to increase the predictability of the system. In its latest improved version, it employs a small side kernel that cooperates with the Linux kernel. A major difference that Xenomai makes is that it allows the real-time tasks to work on the user space. In fact, Xenomai makes use of the concept of introducing two domains for executing the tasks, a primary domain, which is controlled by the real-time section, and a secondary domain which is controlled by the Linux kernel. Real-time threads are handled in the primary domain unless the Linux standard API is called. It is worth mentioning that Xenomai has the ability to pull out the real-time processes from the normal tasks which are created by Linux standard POSIX API. This means that the real-time threads in Xenomai kernel inherit the ability of invoking the linux functions when they are not being run in real-time mode [6]. Now when the real-real-time task calls the Linux standard API, it is transported to the primary domain, where the Linux kernel schedules it using the SCHED FIFO (first-in-first-out) or SCHED RR (Round-robin) policies, with regards to the task’s fixed priority. After the function invocation is completed, the real-time task can go back to the primary domain. This way, Linux OS is used more efficiently. The other advantage of this applied isolation is that real-time tasks do not use the same memory space as the other tasks, therefore, the possibility of the occurrence of a crash due to existence of errors in a real-time task is reduced. A problem with Xenomai is the latency that it will still experience when dealing with real-time tasks in primary domain. This latency is longer than the latencies imposed by RTAI. Also, the secondary domain, which is in control of the Linux kernel scheduler, imposes another latency to the system. Thus, the developers in Xenomai project are working on enhancing these problems with the real-time performance of the system.
2.3.5 Reducing the Latencies
A set of other suggestions has been presented to make the Linux kernel itself more predictable. In order to achieve this goal, focus has been on improving the non-deterministic parts of the Linux kernel. The main sources of unpredictability in Linux kernel are latencies, the scheduling method, and the timing resolution of the Linux kernel. The approaches suggested to fix these problems have resulted in an operating system more responsive to the applications without having the need to change those applications. Consequently, now we can expect that pre-emptibility can be a standard specification of Linux kernel. However, according
Figure 2.2: A diagram of overall design structure of Xenomai
to the evaluations and tests a preemptive kernel can reduce the kernel latency for a few milliseconds in some applications, depending on the application type. A number of suggestions have been given to reduce the latencies without changing, or adding to, the standard API of the Linux OS. Two major works in this field were proven to be more efficient: the preemptive kernel patch, and the low latency patch [7] [8]. This section discusses these two methods. The first method was first suggested by Robert Love in Monta Vista’s preemptible kernel patch, which was later used in the next versions of Linux, and the second one was proposed by Ingo Molnar. Other solutions were suggested as well by researchers in order to improve the timing resolution of the Linux kernel, and will be explained in this part. The last solution which will be discussed in this section will be the PREEMPT-RT patch, again suggested by Ingo Molnar.
2.3.6 Preemptive Kernel Patch
The main idea behind the Preemptive Kernel Patch [9] is to provide the scheduler with the opportunity to execute more frequently. This happens by changing the interrupt return codes and spinlock macros, thus the scheduler is called when it is
appropriate for the preemption to happen [10]. In fact, this approach overcomes the limitation of a single execution flow inside the Linux kernel. Consequently, there is no need to disable preemption when an execution enters the kernel. In order to support kernel preemptability, the kernel code must be completely pro-tected by using mutexes or spinlocks. Preemptive Kernel Patch disables kernel preemption by holding a spinlock. Spinlocks are the basic synchronization tools in the Linux kernel for symmetrical multiProcessor systems mode(SMP). To avoid race condition, spinlocked regions are chosen as critical sections in the Linux SMP kernel because basically every processor can use a system call in this mode. In fact, what spinlock does is to make sure that at each time only one process can enter the critical section [10]. This function makes the spinlocks similar to binary semaphores or mutexes with the difference that unlike mutexes, the process that wants to use the spinlock is not put in a waiting queue; it is put in a busy wait con-dition called spinning around until the current process unlocks the spinlock [10]. The point here is that applying spinlocks in uniprocessors is not possible because busy waits are not allowed in uniprocessors. On the Contrary, on single processor OSs there is no need to use spinlocks because the processor executes only one process flow at a time. Another major change that this approach makes in Linux kernel is introducing a new counter semaphore called the preemption lock counter (PLC) which lets the preemption of the Linux kernel happen. Preemption can actually happen when the value of this counter is zero, and it is forbidden when the value is any value bigger than zero. It is important to know that preemp-tion cannot happen in 5 cases:(1) while handling interrupts (2) while processing Soft-IRQs (3) while holding a spinlock, write, or read lock. (4) while the kernel is executing the scheduler (5) while initializing a new process in the fork() system call [10]. Thus, when the processor enters in any of the above conditions the PLC is incremented, so no preemption is allowed. When the scheduler is leaving the critical section, meaning that all the locks that a task uses are released, the PLC is decremented this time, and a test is made to see if preemption has been asked for during the time that spinlock was held, and if so, the preemption will happen immediately. This process usually can happen tens of thousands of times in a second. However, one problem that this approach can face is dealing with long spinlocks, when a protected region is too long and thus preemption is forbidden for a long time. Robert Love suggested a feasible solution for this problem by introducing Monta Vista’s preemption patch. This will be discussed in the next section.
2.3.7 Low latency Patch
Another solution for reducing scheduler latency, called the Low Latency Patch [10], was suggested by Ingo Molnar. This project is maintained by Andrew Morton now. In this method, focus is directed on introducing preemption points (also called rescheduling points) in blocks of code that may execute for longer periods of time. The basic idea is to find blocks of code that iterate over large data structures and find out how to assign a call to the scheduler safely if the loop has gone over a certain threshold and a rescheduling is needed. This sometimes implies a lock breaking to happen, which means a spinlock has to be canceled, and activated again, after the rescheduling process is finished. A preemption point can be placed only where no data inconsistencies are possible due to read/write or write/write conflicts [10]. Most of these preemption points are placed where long lists have to be changed which usually happens in memory management or in drivers. One tool for finding the places where a preemption is necessary is Andrew Morton’s rtc debug patch that modifies the real-time clock driver in order to look for the latencies bigger than a specified threshold. Then the programmer should evaluate the reason why the latency is created by the help of looking at the routines that happen to be the reasons for the long latency sections . Also, the programmer can find the preemption places by applying the patches and comparing the source files before and after applying them. Although Low Latency Patches are based on a simple idea, the implementation is not very easy. Finding and modifying the code sections that cause latencies despite the development of useful device such as Andrew Morton’s suggested tool is a time consuming debugging task. This can be even more difficult considering the dynamic nature of the Linux kernel state. Nevertheless, low latency patches have shown to reduce the maximum Linux kernel latency to a much lower value than what the preemptive kernel patch offers [10]. This method is implemented and used in some real-time versions of Linux such as REDLinux.
2.3.8 Monta Vista
As mentioned before, long spinlocks caused by long sections that need to be pro-tected can turn in to a major problem in Preemptive Kernel Patch approach. A solution for this problem is to combine the preemption patch with parts of the Andrew Morton’s Low Latency Patch [10]. This solution, suggested by Ingo Mol-nar, was used in Monta Vista’s patch which was later accepted and used in Linux 2.4.2 version. The idea is that the preemption points of the Low Latency Patch are used to solve the problem of long spinlocks seen in the Kernel Preemption
Patch, by adding preemption points to the long blocks of code that need protec-tion. As a matter of fact, when the Kernel Preemption Patch makes the Linux kernel preemptible in general, the use of Low Latency Patch makes the spinlock areas preemptible. Monta Vista also provides measurement tools so that devel-opers can measure the preemptiblity performance with their actual applications and environment. Monta Vista has proven to reduce the average latency in Linux kernel. However, it does not guarantee to reduce the maximum latency [10].
2.3.9 TimeSys
The idea behind the design of TimeSys [11] is the same as Monta Vista, meaning that spinlock calls are used to manage the preemptions. Though, the main dif-ference between TimeSys and Monta Vista is that in TimeSys, mutexes are used instead of interrupt counters [11]. Basically, a mutex is a binary semaphore which is used in a system to ensure the mutual access to the same resource. When in the interrupt counter approach preemption is forbidden in the spin locked sections, in mutex approach preemption is available for a higher priority process when the lower priority process is using different resource. This means that it is possible to give the real-time tasks a higher priority than some interrupts. The mutex also uses priority inheritance protocol(PIP) to solve the priority inversion problem. In practice, implementing this protocol is difficult, but it gives the kernel the possi-bility to further reduce the kernel latency even to the level of the latency caused by the interrupt abstraction method. Beside the extension made in the scheduler, the interrupt systems are also changed in TimeSys. In fact, the interrupt service routines (ISR), and IRQs are transformed to kernel threads, meaning that they will be scheduled under the real-time preemptive scheduler too, which is how the real-time threads are able to have a higher priority than the interrupts. Moreover, since all the interrupt handlers are treated as scheduler threads, it is possible to put an interrupt handler to sleep. This way it is possible to substitute the spinlock interrupts with mutexes. TimeSys approach enhances the hard real-time features in Linux, but still it is not possible to preempt the Kernel process at any arbitrary point safely.
2.3.10 Preempt rt Patch
The Preempt rt patch [2] has attracted developers attention with its neat and effi-cient design, and parts of its design were employed by Linux. This patch also uses spinlocks to protect the critical sections from preemption in general, and employs
mutexes to allow preemption in some parts of the protected area in order to re-move the problem of long locks. priority inheritance protocol is also used to handle the spinlocks and semaphores. The other feature of this patch, similar to the suc-cessful features of the above-mentioned approaches, is that it treats the interrupt handlers as a user space thread which is managed by the kernel scheduler. The Preempt rt patch converts the standard Linux timers to separate infrastructures to obtain a higher resolution timer, and a separate one for the time outs, which helps obtaining a high resolution user space POSIX timer [12]. A comparison between the performances of the Preempt rt patch, The standard Linux, and a system that employs both RTAI and Xenomai approaches has been made in [2]. According to the test, the maximum interrupt latency in the preempt rt patch is quite similar to the system using both Xenomai and RTAI patches, but this latency is higher in the standard Linux kernel. These results indicate the improvement made by the Preempt rt patch.
2.3.11 LITMUSRT
Linux testbed for multiprocessor scheduling in real-time systems (LITMUSRT) [13] is a project based on modifications applied to the Linux 2.6.20 kernel configured for a symmetric multiprocessor (SMP) architecture. In this project a scheduler plug-in plug-interface is created that allows new schedulplug-ing algorithms to be added [13]. Another main subsection of the LITMUSRT is the user-space libraries for sup-porting the creation and execution of real-time tasks, as only real-time tasks are scheduled by LITMUSRT. LITMUSRT operates in two modes: real-time, and non-real-time. The system is basically in non-real-time mode at the starting to set up the complete tasks before the scheduling happens. The core LITMUSRT timer tick function (rt scheduler tick()) is responsible for mode switching [13]. For releasing and queuing of real-time tasks, LITMUSRT provides the abstraction of a real-time domain implemented by structure rt-domain-t. This abstraction do-main consists of a ready queue and a release queue, which is ordered by ascending release time of tasks. An EDF order function is used to organize the ready queue. Though, a feedback-control EDF (FC-EDF) algorithm was used for order func-tions in LITMUSR later. Wrapper funcfunc-tions are created for list operafunc-tions such as queuing and excluding tasks from the queue, and functions such as (list insert()) (used for putting a task into the queue) and (list qsort()) (used for sorting the queue) are used to extend the Linux list.h API. Real-time tasks have the high-est static priority upon creation. However, Instead of being kept in the standard Linux run queues, the real-time tasks are managed by scheduler plug-in. Each of
these plug-ins is responsible for its own run queue. When schedule()is invoked, the current scheduler plug-in takes the control, and If it chooses a real-time task to be scheduled on the local processor, then the task is placed into the run queue, thus the Linux scheduler is bypassed. There are thirteen scheduling plug-in decision types used in LITMUSRT, each time one of them used. As a matter of fact, Each scheduling algorithm is created as a plug-in .During the system booting, the ker-nel command-line parameter rtsched determines which of the scheduling decisions should be used. A brief description of these steps [13]:
• When a real-time task is going to be added, a call to prepare task() calls the scheduler plug-in which examines the task. If the new task does not match the plug-in requirements, then it is not accepted.
• When the task-blocks()function is called, the schedule plug-ins are notified of task blockings, and thus, can move the blocking task.
• If the new task is a real-time task, he function try-to-up() invokes wake-up-task()
• When a real-time task exits, a call to tear-down is made to notify the sched-uler plug-ins, so the resources belonging to that task are freed.
• A call to mode-change() notifies the scheduler plug-ins about a switch to, or from the real-time mode. After switching to the real-time mode, the real-time tasks are put in to TASK-RUNNING state in the release queue.
• The scheduler plug-ins are notified of each tick of the timer when a call to scheduler-tick() happens.
• As mentioned before, schedule()is the main scheduling function. After this function is called, a scheduler plug-in should select which real-time task to execute. Only if the scheduler plug-in selects no task, the Linux scheduler takes the responsibility of the scheduling.
• In order to avoid race condition, LITMUSRT re-inserts a preempted real-time task into the ready queue by calling finish-switch()function after the context switch is finished.
• By calling the function sleep-next-period(), the scheduler plug-in is notified about an early completion of a task so that the task will be put back into the release queue.
• To configure scheduler plug-ins through a unified interface, the function scheduler-setup()is created. This is because some schedulers have different parameters for determining the method of scheduling.
• To examine the condition if a newly unblocked task needs to inherit the priority of the task behind it in FIFO for the FMLP(exible multiprocessor locking protocol) protocol, the function inherit-priority()is called.
• In case a task has to give up an inherited priority in FMLP The function return-priority() is called.
• If the priority of the locking task has to be raised according to FMLP rules, the function pi block()is called.
Besides the libraries that LITMUSRT uses, a number of system calls are also added to Linux. These system calls are used in managing real-time tasks, asking for an update about the status of the system, notifying the completion of jobs, setting up the schedulers, and to provide support for FMLP. Scheduling decisions are made in timer interrupts. This implies a unified timing system for all of the processors. In order to align the timings, first the value of the Time Stamp Counter (TSC), a 64 bit counter responsible for recording the current time, is recorded by the processors upon booting the system. Based upon this measurement all the processors calculate how much delay they need to align themselves with respect to processor number 0. After that, each processor disables and resets its local interrupt controller timer, and at this time it generates its next interrupt after a full timer period. By resetting its interrupt controller timer, each processor aligns its time to the others. Moreover, task periods are integral with respect to the length of the systems smallest scheduling time span (quantom) [13].
2.3.12 Enhancing the Timing Resolution
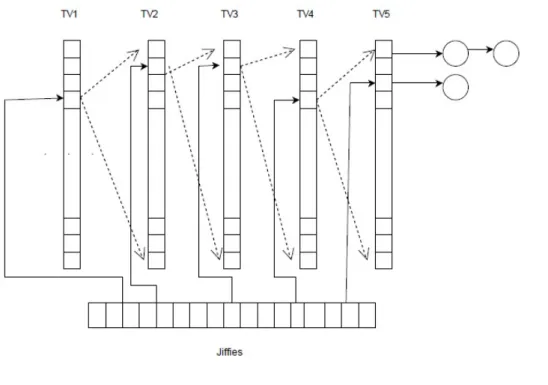
The timer mechanism in Linux works based on a timer notion called jiffy (An unknown short period of time). All of the timeouts of the timers are changed in to jiffies, and for managing them, a Linux system timer is used. This system timer is designed by cascading five timer vectors(TV). When scheduling a timer, it is placed in one of the five vectors based on to the time the system has until the timer expiration time. The vectors can be considered as arrays of jiffies that work by being moved to a time in the future. All needed to do when inserting a new timer is to place it in a timer regarding to its timeout value in jiffies. Now when a timer interrupt is called, it means that the jiffy’s value should be incremented, which
means all the timer values are changed [2]. The cascade design is built In order to make this change possible in all the timer values. A benefit of this method is that it makes timer insertion and deletion faster, because all the timers are shifted at once. On the contrary, since the cascade function disables preemption and interrupts when running, and each time millions of timers are executing at once, very big latency problems emerge. Another problem is that many of the timer functions include big blocks of code. In order to fix these latency problems and obtain real-time features in Linux, a number of solutions have been presented. Two of the solutions are the high resolution timer(HRT), by George Anzinger, and KTimers, suggested by Thomas Gleixner and Ingo Molnar [2]. In next sections these two approaches are reviewed.
Figure 2.3: A diagram of how timers are managed inside Linux kernel.
• HRT
The idea behind HRT is to employ the Linux system timers to manage all the timers in the timer vectors. This timer system is able to use its own system interrupt, which can be used to trigger each of the timers that are put in timer queues by HRT’s Linux system timer [14]. Unlike Linux standard interrupt system, this system timer does not generate an interrupt after a constant interval of time. In fact, interrupt creation depends on the next event scheduled by the OS. As a matter of fact, HRT is built on top of the Linux System Timers and introduces a separate interrupt to obtain a resolution in microsecond scale [2].
• KTimers
The KTimers approach uses a red-black tree to store all the timers, so there is no need for the cascade operation although it is slower than the standard timeout mechanism of Linux [2]. It also keeps the expiration dates by using function called Ktime t, and uses nanosecond time out specifications. When Ktimers approach uses its own interrupt to trigger the timers, similar to the HRT approach, it does not interact with the Linux system timers, and its time preservation mechanism is completely independent of the jiffies values. As a matter of fact, the Ktimers patch does not make any change in the current API in standard Linux, it adds its own entirely new API, which is developed to have a higher resolution. The Ktimers API was accepted and implemented in the 2.6.16 version of the mainline Linux OS. The biggest objection to the Ktimers patch is its use of nanosecond values, which brings up the need for having 64-bit variables, which slows down the 32-bit systems performance. Nevertheless, the additional overhead this patch introduces is not a big problem to get worried about, specially when comparing it to its high resolution [2].
2.4
Monitoring
Despite the significant improvements that have been made in the timing behavior of different systems in real-time environment, proposing a correct-by-construction system is very difficult in real-time environment. This is mainly due to the com-plexity and unpredictability of real-time environments. Thus, run-time monitoring can be a helpful approach in order to provide the user with data regarding to the actual timing behavior of the system. The data that these monitors provide can be used for further analysis by the user, or the monitor itself. As a matter of fact, the intention of run-time monitoring is to determine whether the current execu-tion meets the specified technical requirements [15]. Timing behavior monitors provide the user with necessary information which can be used to detect or predict violations of timing constraints. Examples of such information are deadline misses and context switches [1].Note that in this report, in some parts, the term real-time behavior is used, which refers to the system behavior in real-time environment, meaning that when the system is dealing with real-time tasks. Since some terms are used in this report that are especially common in works related to monitoring of timing behavior, it feels necessary to the author to provide the definition of these terms. :
Target system: The system in which monitoring, run-time checking, or run-time verification is performed is referred as the ’target system’.
Latency and interference: detecting events of interest and processing them can be performed in different ways, each of them causing a different amount of interference with the target system. This is one of the main issues in monitoring of timing behavior, because it can alter the timing behavior of the target system significantly. Probes: Probes are basically elements of a monitoring system which are attached to the target system in order to collect information about its internal operation [1]. Probe effect:As mentioned, including the monitoring code in the target software has the disadvantage of changing its behavior because of the amount of latency being added to it. This is because a part of the CPU time should be dedicated to the monitoring code. This latency is referred as probe effect.
Tracing and Sampling:Data collection can happen in two ways: tracing and sam-pling. In tracing, every occurrence of an event creates a record. So event tracing is characterized by the completeness of knowledge [16]. Sampling yields only a statistical measure of the software’s execution patterns.tracing is mentioned as event-driven monitoring whereas sampling is called time-driven monitoring.
2.4.1 Linux Native Monitoring Tools
In this section an overview of monitoring tools that are available for many version releases of Linux OS is provided. Since a quite big number of such native tools is available, the most famous and common monitors are selected for this section. It is worth mentioning that the selected tools are the ones that are more related to our project.
2.4.1.1 Sysstat Project
The Sysstat project is managed by Sebastien Godard [17]. The monitor in this project derives the raw data about the processes from the Linux /proc file system and makes them ready for display and for building a data base from the processes execution history. The Sysstat stores the information for a period of time after collecting it, and calculates the mean values and makes it possible for the user to have access to the data of interest at predefined time intervals. This project, which is used in many commercial versions of Unix systems, contains different monitoring tools such as sar, sadf, iostat, nfsiostat, cifsiostat, mpstat, and pidstat commands for Linux [17]. The Sysstat package provides system information such as [17]: process names, process IDs, CPU usage and load, total, or per processor ,physical and virtual memory, swap file usage, memory load, and paging ,network
interfaces, NFS servers and clients, number of Interrupts including global and local interrupts, context switches and run queues. While users might be able to obtain some of the mentioned information through other Linux monitoring tools, Sysstat tools facilities have fixed some of the issues the users had with those other tools. For example, the challenge of finding bugs and loops in active programs, which demanded the users to spend long time using tools such as top, is removed by Pidstat, which provides statistics reports for each single Linux tasks. Also, Sysstat tools make it easier for the administrators to use the data from proc file system without the need to have the necessary skills to extract it manually. Moreover, there are some aspects of the monitored system that cannot be easily explored by using tools that give a snapshot of the system execution status. In next subsections an overview of the most important Sysstat project tools is presented.
2.4.1.2 Mpstat
The Mpstat command provides data about the activities of each processor as well as the average global activities, starting with processor number 0 [17]. Although Mpstat command can be used for both SMP and UP systems, in UP systems it only displays data about average global activities. The time span between each report is selected through an interval parameter. The value 0 means that the displayed data includes processor activities since system startup. The count parameter determines how many reports should be submitted during each second. If this parameter is not specified the Mpstat generates reports constantly. All the data Mpstat presents comes from the Proc file system, thus, it needs to be mounted on the system for the Mpstat to work. For example, CPU utilization and interrupts summary data comes from /Proc/stat, the number of interrupts per seconds comes from /Proc/interrupts, and the software interrupts data can be obtained from /proc/softirqs. In order to have the information about the interrupts for instance, after choosing the I option, If the CPU keyword is used, the number of interrupts received by the processor, or the processors, is displayed. In the same way, if the SCPU keyword is used, the number of each software interrupt received by each processor, or all the processors is displayed. If the SUM keyword is used, the total number of interrupts received per second for all processors is displayed, And, by using the keyword ALL, a combination of all the previous information is reported [17]. The Mpstat report that the user sees consists of the following sections: Shows the number of the processor whose data is being displayed. Shows the CPU utilization percentage. Shows the percentage of CPU utilization while execution is happening at the application level with nice
priority. Niceness, or nice value, is the priority that the user sets for the tasks to be executed in Linux. The niceness scale goes from -20 to 19 with 19 being the lowest priority for a task. Shows the percentage of CPU utilization while execution is happening at the system level (kernel) without the time spent for the interrupts. Shows the percentage of time that the CPU or CPUs were idle due to an I/O request from the system. Shows the time percentage spent by the CPU or CPUs to perform the interrupt service. Shows the percentage of time spent by the CPU or CPUs to perform the softirq software interrupt service. Show the percentage of time that the CPU or CPUs were idle. The difference between intr/s Shows the number of interrupts received by the CPU or CPUs per second [17].
2.4.1.3 Pid Stat
Pid Stat tool is used for monitoring single tasks being executed by Linux ker-nel [17]. -p and u options: By using the p command, a list of process ids will be passed.
• d option: The d option provides the I/O statistics of the monitored process. The kB rd/s column in the d option corresponding window gives the amount of data read by the process in kilobytes per second, and kB wr/s column gives the written data by the process in the same rate. Also, the kB ccwr/s gives the kilobytes/sec data writing which has been canceled by the monitored process in case of data rewriting occurrence.
• s option: The -s option displays the stack memory usage. The StkSize column shows the size of stack allocated for the process. The StkRef column shows the size of stack memory used by the process. Note that the stack reserved for the process might not be used completely, so there is a difference between stksize and stkref.
• w option: The -w option reports task switching. The cswch/s column shows the number of voluntary context switches per second, i.e. the context switches that happen due to unavailable resources needed for a thread to be com-pleted. The nvcswch/s column reports the number of non-voluntary context switches per second. Non-voluntary context switches occur when the process is stopped by the kernel due to completion of the CPU time dedicated to it. • r command: The r command reports page fault and memory utilization. There are two types of page faults: the minor page fault and the major page fault. In minor page fault a page of interest is loaded concerned page
is loaded in the memory but it is not confirmed as loaded. The number of this type of page fault per second, is displayed under the mint/s column. In major page fault however, a memory page needs to be loaded from the hard disk into the page cache. A significant number of major page faults can be harmful to the system, thus the system memory should be increased. The VSZ column displays the size of virtual memory for the monitored process, and RSS displays the amount of physical memory used by it.
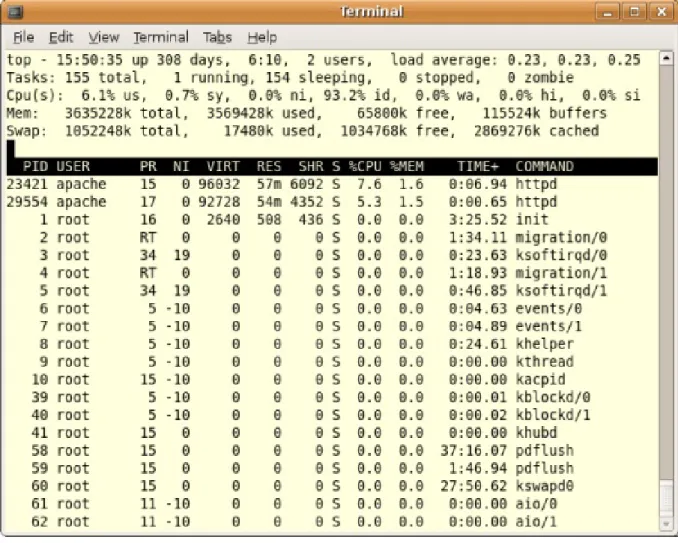
2.4.1.4 Top
Top is another monitoring tool that provides real-time report of the process activ-ities with an interface for the user to filter and manipulate the monitored data by using a command or by specifying the feature in the system configuration file [18]. Four data output areas are presented to the user: the summary area, the mes-sage/prompt Line, the columns header, and the task area. In the following parts the four areas are explained [18]:
• The summary area: the summary area, which is displayed in the first five lines, gives a summary of the system activities. The first line includes the command name, current system time, system uptime, number of users and the average load of the CPU for the last one minute, last five minutes and last fifteen minutes [18].The second line gives the total number of processes in the system as well as their number based on their status. The next line gives CPU utilization between the current time and the time of the last refresh. The next two lines provide information about the memory usage. This information includes the total physical memory, the used and free memory chunks and the part of memory used for blocking I/O buffers, all in kilobytes. Also, the next line gives data about cached, which together with buffers serve the dynamic memory requests from the processes. Finally, in the last line the swap memory (the memory swapped to a disk in order to extend the system physical memory) is shown.
• The message area: the single line after the summary area is the message line. The user can use this area to use prompt commands to perform the sub-commands of top. I this area the error messages are also displayed. • The headline area: as it is clear, the column header area includes the headings
for different columns.
• The task area: in this area, the details of all the processes in the system are displayed. The information given in this section includes: the IDs of the
processes (PID), the owner user name (USER), priority of the process (PR), nice value (NI), total used amount of virtual memory (VIRT), resident size ( the used non-swapped physical memory) (RES), shared memory (SHR), and the process status (S), which can be running (R), sleeping (S), uninterruptible sleep (D), traced or stopped (T) and zombie, which means that the process has finished the execution and has released all its resources but still has an entry in the process table (Z). The other information include CPU time usage percentage since the last refresh.
Although top command provides the user with very well-structured information display and administration as well as a large number of options, it imposes a significant overhead on the system due to a few thousands system calls that it makes to update its output and the fact that it is highly configurable [18].
2.4.1.5 Vmstat
The main use of the Vmstat command is to report the virtual memory statistics. In addition, by using Vmstat the user is able to have access to data about system pro-cesses, physical memory, swap, I/O blocks, interrupts, context switches, and the CPU activity [19]. The most common Vmstat command is vmstat[delay[count]], where the Vmstat sends out data to its output as many times as determined by the count parameter, and the delay parameter determines the time span between two Vmstat reports in seconds. If the count parameter is not specified, the Vm-stat will display the output forever. If the delay parameter is specified, VmVm-stat gives the average value of the data since the last reboot and exits. The files that Vmstat uses to extract data are /proc/meminfo, /proc/stat, and /proc/*/stat. Here is a description of how the Vmstat output looks like with the explanation of the parameters [19]:
• Procs r: the number of processes waiting for run time. b: The number of processes in uninterruptible sleep state.
• Memory swpd: used virtual memory. • free: idle memory.
• buffer: the amount of memory used as buffers • cache: the amount of memory used as cache • inact: the amount of inactive memory • active: the amount of active memory
• Swap si: Amount of memory swapped in from disk • so: amount of memory swapped to disk IO
• bi: blocks received from a blocking tool • bo: blocks sent to a blocking tool System
• in: the number of interrupts occurrence per second
• cs: the number of context switches per second CPU These are percentages of total CPU time.
• us: time spent running non-kernel code. • sy: time spent running kernel code.
• id: time spent idle.(Linux 2.5.41 and later versions)
• wa: time spent waiting for IO.(Linux 2.5.41 and later versions)
• st: time stolen from a virtual machine. (Linux 2.6.11 and later versions)
Some of the most common commands that the user can use to filter the output data are:
• a: this option gives the active (has been used recently) and inactive (has not been used lately) memory columns.
• f: this option gives the number of forks (new processes created) since the system boot including the fork, vfork, and clone system calls, A system call in the Linux kernel that creates a child process, (a process that is created by the parent process) that may share parts of its execution content with the parent process.
• S: this option is used to change the unit s of the memory data. By default, the memory data is provided in the units of Kilobytes (1024 bytes). By using the S option it is possible to change this to 1000, 1024, 1000000 or 1048576 bytes using k, K, m or M parameter respectively.
2.4.1.6 Gnome Desktop Environment Tool
The GNU network object model environment (GNOME) tool is relatively the equivalent of the task manager existing in Windows systems. This international Red Hat project, which is built of open source software, consists of a desktop environment and a graphical interface for the user that runs on an operating system. By using GNOME the users has access to information about general system status, the number of processes, memory and swap usage, and process-level statistics as well as a graphical representation of the mentioned information. Also, system processes can be manipulated through GNOME; for example, the user can kill a process.
2.4.1.7 KDE System Guard
The KDE System Guard also provides statistical data about the system status, load, and the processes as well as the ability to manipulate the processes. The KDE System Guard window has two tabs: the process table, and the system load. The process table lists all the processes with details about the memory, CPU, and
Figure 2.5: An example of Vmstat output
network. The user can sort and filter the list. Here are the items that the process table covers [20]:
• Name: the name of the executable file that has started the process. • Username: the user that the process belongs to
• CPU: the total amount of CPU that the process uses currently, divided by the number of processors existing in the machine (cores)
• Memory: the amount of physical memory being used by the process minus the swapped memory and the space occupied by shared libraries.
• Shared Mem: the amount of physical memory that the process shared li-braries are occupying. This memory is shared among all processes using the shared libraries [20]:.
Additional columns in the process table: • PID: the ID of the processes
• TTY: the controlling terminal on which the process is running • Niceness: the priority of the process running in Linux (-19 to 19).
• CPU Time: the total system time that the process has been executing for,displayed as minutes:seconds
• IO Read: the number of bytes read. • IO Write: The number of bytes written.
• Virtual Size: the amount of virtual memory being used by the process, includ-ing shared libraries, graphics memory, files on disk, etc. Usinclud-ing the context menu to select the Display Units can make the display more useful.
• Command: the command that was used to launch the process.
• System load: this tab gives a graphical representation of the history of the memory, CPU, and network usage.