Faculty of Veterinary Medicine and Animal Science
Department of Animal Nutrition and Management
Plasmin and Plasminogen Variation in
Bovine Raw Milk
Impact of season, breed and milking system
Jaafar Khaled
Master Program - Animal Science
Independent project / Degree project in Animal Science, 30 credits, Second cycle, A2E
Publication: Swedish University of Agriculture Sciences, Department of Animal Nutrition and Management Sweden, Uppsala 2019
Plasmin and Plasminogen Variation in Bovine Raw Milk
Impact of season, breed and milking system
Jaafar Khaled
Supervisor: Monika Johansson, Department of Molecular Sciences, Swedish University of Agricultural Sciences, Uppsala
Assistant supervisor: Hasitha Priyashantha, Department of Molecular Sciences,
Swedish University of Agricultural Sciences, Uppsala
Examiner: Horacio Gonda, Department of Animal Nutrition and Management, Swedish University of Agricultural Sciences, Uppsala
Credits: 30 credits
Level: Second cycle, A2E
Course title: Independent project in Animal Science
Course code: EX0870
Program/education: Master Program - Animal Science
Course coordinating department: Department of Molecular Sciences
Place of publication: Sweden, Uppsala
Year of publication: 2019
Online publication: https://stud.epsilon.slu.se
Keywords: Plasmin, plasminogen, season, breed, milking system, milk composition
Sveriges lantbruksuniversitet
Swedish University of Agricultural Sciences
Faculty of Veterinary Medicine and Animal Science Department of Animal Nutrition and Management
Abstract
Plasmin (PL) is a native proteinase in milk, which combines a complex system consisting of its zymogen called plasminogen (PG), inhibitors and activators, which activity is known to make considerable changes in the dairy products, which represent in irregulating of casein hydrolysis and poor clotting properties, that may slow the cheese ripening process and consequently increase the processing expense. The objective of this study was to investigate if on-farm factors (i.e., seasons breed and milking system) significantly affect the PL and PG-derived activity of raw milk. As well as, to investigate the relationship and/or possible correlations between PL and PG-derived activity and milk composition (i.e., pH, protein, somatic cell count and total bacteria count). Milk was collected from 18 different farms northern Sweden in November 2017, February and September 2018. PL and PG analyses were conducted on milk serum fraction in duplicates obtained by ultracentrifugation of skimmed milk samples. PL and PG-derived activities were analyzed by the spectrophotometric method using multi-mode microplate reader at 37°C. Urokinase (49.5 plough units) was used as PG activator to measure the total proteolytic activity of PL and PG. The production season had no effect (P > 0.05) on the average PL and PG-derived activities. The raw milk PL and PG-derived activities were significantly affected by breed. Jersey had higher (P < 0.05) PL (6,54 U/mL) and PG-derived (139,67 U/mL) activities compared to all other breeds. SRB had higher (P < 0.05) PL activity (16.2%, 31% and 39.8%) comparing to MB, SLB/SRB and SLB, respectively. MB had higher (P < 0.05) PL activity (17.13%) than SLB. With regard to SRB, SLB/SRB and MB had higher (P < 0.05) PG-derived activity (13.5%, 31%, 13.1% and 12.4%, respectively) comparing to SLB. Farms with a conventional milking system (CMS) had higher (P < 0.05) PG-derived activity compared to farms containing automatic milking system (AMS). The mean PG derived activity showed to be higher in CMS (102.66 U/mL) compared to (91.84 U/mL) in AMS. Total protein content and somatic cell count (SCC) were correlated with PL and PG-derived activities. Milk pH and total bacteria count (TBC) were not correlated with PL and PG activity.
Table of Content
List of figures Abbreviations 1. Introduction 1 1.1. Aim 2 1.2. Hypothesis 2 2. Literature Review 3 2.1. Milk composition 32.2. Proteolytic activity in milk 4
2.3. Proteolytic enzymes 4
2.3.1. Plasmin and plasminogen 4
2.4. Plasmin system 5
2.5. Consequences of plasmin in milk 6
2.5.1. Negative effects 6
2.5.2. Positive effects 7
2.6. Plasmin and plasminogen-derived activity measurement in bovine milk 7
2.7. Factors affecting plasmin and plasminogen-derived activities 8
2.7.1. Stage of lactation 8
2.7.2. Lactation number 8
2.7.3. Cow breed 8
2.7.4. Milking system 9
2.7.5. Environmental factors – seasons 9
2.8. Gross milk composition 10
2.8.1. The pH of milk 10
2.8.2. Somatic cell count 10
2.8.3. Mastitis 11
3. Materials and Methods 12 3.1. Samples collection 12 3.2. Sample preparation 12 3.3. Sample preparation 12 3.3.1. Plasmin puffer 12 3.3.2. Substrate solution 12 3.3.3. Urokinase solution 12
3.4. Plasmin and plasminogen isolation 13
3.5. Plasmin and plasminogen-derived activity measuring 13
3.6. Milk composition data 14
3.7. Statistical analysis 14
4. Results 15
4.1. Variation of plasmin and plasminogen-derived activity in raw milk with the seasons 15
4.2. Effect of breed on plasmin and plasminogen in raw milk 19
4.3. Effect of milking system on plasmin and plasminogen in raw milk 21
4.4. Correlations between plasmin/plasminogen and milk composition 22
5. Discussion 23
5.1. Variation of plasmin and plasminogen-derived activity in raw milk with the seasons 23
5.2. Effect of breed on plasmin and plasminogen in raw milk 24
5.3. Effect of milking system on plasmin and plasminogen in raw milk 24
5.4. Correlations between plasmin/plasminogen and milk composition 25 5.4.1. Correlations between plasmin/plasminogen and milk pH 25 5.4.2. Correlations between plasmin/plasminogen and protein content 25 5.4.3. Correlations between plasmin/plasminogen and somatic cell counts 25 5.4.4. Correlations between plasmin/plasminogen and total bacteria count 26
6. Conclusions 27 7. Acknowledgements 28 8. References 29 9. Appendix 36 9.1. Appendix 1 36 9.2. Appendix 2 45
List of figures
Figure 1. Plasmin system in bovine milk.
Figure 2. Variations in mean PL and PG-derived activity in farm milk collected in November 2017,
February 2018 and September 2018. Data points present mean values for 18 farms of triplicates for each farm. Different letters A, B indicate statistically significant differences among seasons at P < 0.05.
Figure 3. Variations in PL activity in farms number 39 and 18 collected in November 2017, February
2018 and September 2018. Different letters A, B indicate statistically significant differences among production seasons at P < 0.05.
Figure 4. Variations in PG-derived activity in farms number 20 and 40 collected in November 2017,
February 2018 and September 2018. Different letters A, B indicate statistically significant differences among production seasons at P < 0.05.
Figure 5. Variations in PG-derived activity in farms number 30 and 32 collected in November 2017,
February 2018 and September 2018. Different letters A, B, C indicate statistically significant differences among production seasons at P < 0.05.
Figure 6. Variations in mean PL and PG-derived activity in silo milk collected in November 2017,
February 2018 and September 2018. Data points present mean values for 3 silos of triplicates for each silo. Different letters A, B indicate statistically significant differences among production seasons at P < 0.05.
Figure 7. Variations in mean PL activity as affected by different breeds. Different letters A, B, C indicate
statistically significant differences among different breeds at P < 0.05.
Figure 8. Variations in mean PG-derived activity as affected by different breeds. Different letters A, B,
C indicate statistically significant differences among different breeds at P < 0.05.
Figure 9. Variation of PL activity according to the milking system; AMS: Automatic milking system and
CMS: Conventional milking system. Different letters A, B indicate statistically significant differences among milking systems at P < 0.05.
Figure 10. Variation of PG-derived activity according to the milking system; AMS: Automatic milking
system and CMS: Conventional milking system. Different letters A, B indicate statistically significant differences among milking systems at P < 0.05.
List of tables
Table 1. PL activity in farm milk as affected by breeds and grouping information using the Tukey Method
and 95% confidence. Means that do not share a letter are significantly different.
Table 2. PG-derived activity in farm milk as affected by breeds and grouping information using the
Tukey Method and 95% confidence. Means that do not share a letter are significantly different.
Table 3. Correlations between different milk compositions in raw farm milk from 18 farms; Cell Content:
Pearson correlation: P-Value.
Table 4. Correlations between different milk compositions in raw silo milk; Cell Content: Pearson
correlation: P-Value.
Table 5. Overview of environmental factors and mean enzyme activity.
Table 6. Overview of milk samples and enzyme activity.
Table 7. Overview of data raw farm milk components from Eurofins Steins Laboratorium AB, Sweden.
Table 8. Overview of data raw silo milk components from Eurofins Steins Laboratorium AB, Sweden.
Table 9. ANOVA test on PL activity versus season in farm milk.
Table 10. Tukey’s test on PL activity versus season in farm milk.
Table 11. ANOVA test on PG-derived activity versus season in farm milk.
Table 12. Tukey’s test on PG-derived activity versus season in farm milk.
Table 13. ANOVA test on PL activity versus season in silo milk.
Table 14. Tukey’s test on PL activity versus season in silo milk.
Table 15. ANOVA test on PG-derived activity versus season in silo milk.
Table 16. Tukey’s test on PG-derived activity versus season in silo milk. Table 17. ANOVA test on PL activity versus season in FB-18 farm.
Table 18. Tukey’s test on PL activity versus season in FB-18 farm. Table 19. ANOVA test on PL activity versus season in FB-39 farm.
Table 20. Tukey’s test on PL activity versus season in FB-39 farm.
Table 21. ANOVA test on PG-derived activity versus season in FC-20 farm.
Table 22. Tukey’s test on PG-derived activity versus season in FC-20 farm. Table 23. ANOVA test on PG-derived activity versus season in FC-40 farm.
Table 24. Tukey’s test on PG-derived activity versus season in FB-30 farm.
Table 26. Tukey’s test on PG-derived activity versus season in FB-30 farm. Table 27. ANOVA test on PG-derived activity versus season in FB-32 farm.
Table 28. Tukey’s test on PG-derived activity versus season in FB-32 farm. Table 29. ANOVA test on PL activity versus breed in farm milk.
Table 30. Tukey’s test on PL activity versus breed in farm milk.
Table 31. ANOVA test on PG-derived activity versus breed in farm milk.
Table 32. Tukey’s test on PG-derived activity versus breed in farm milk. Table 33. ANOVA test on PL activity versus milking system in farm milk.
Table 34. Tukey’s test on PL activity versus milking system in farm milk.
Table 35. ANOVA test on PG-derived activity versus milking system in farm milk.
Table 36. Tukey’s test on PG-derived versus milking system in farm milk.
Abbreviation
α-LA α-lactalbumin
AMS Automatic milking system ANOVA Analysis of variance αS1-CN αS1-caseins
αS2-CN αS2-caseins β-LG β-lactoglobulin
CMS Conventional milking system EACA ε-aminocaproic acid
κ-CN κ-casein
MEC Mammary epithelial cell NFDM Non-fat dry milk
PA Plasminogen activator
PAI Plasminogen activator inhibitor PG Plasminogen
PI Plasmin inhibitor PL Plasmin
pNA p-nitroanilide SCC Somatic cell count TBC Total bacteria count
t-PA Tissue-type plasminogen activator u-PA Urokinase-type activator
1
1. Introduction
Milk from several mammals’ species is used for dairy industry particularly cheesemaking but, issues could appear because milk differs in composition from species to species, and even from animal to animal. In addition, the manufacturer does not rely just on the gross composition, i.e. fat, protein, lactose and ash, but also at the nature of the individual components, such as fatty acids, caseins, albumins, globulins and other variables (Robinson and Wilbey, 1998).
Milk contains a complex mixture of proteases, zymogens, protease activators and protease inhibitors. This array of proteolytic systems allows a small degree of proteolytic activity within the mammary gland. These components derive from mammary epithelial cell (MEC) expression, active or passive transport from blood or secretion by host immune cells (Dallas et al., 2015).
Proteolysis induced by the native proteinase plasmin (PL; EC 3.4.21.7) is one of the most important contributors to the quality of microbiologically wholesome milk and its products. Plasmin is part of a complex system including its inactive form plasminogen, plasminogen activators, and inhibitors. The PL system components interact with each other and with other components of milk to promote or inhibit proteolysis in milk and milk products (Ismail & Nielsen, 2010). Driven by dairy industry concerns, plasmin-induced proteolysis has gained much interest from researchers because of its complexity and versatile effects on the quality of milk and dairy products (Ismail & Nielsen, 2010).
Plasmin activity can be essential and desirable for flavour development and texture changes during ripening of cheese, thus enhancing the product quality. The loss of PL from the casein micelle may slow the cheese ripening process and consequently increase the processing expense. Conversely, uncontrolled proteolysis can have detrimental effects on the quality of pasteurized milk, UHT milk, and non-fat dry milk (NFDM), causing undesirable precipitation or gelation (Ismail & Nielsen, 2010). Many researchers have linked gelation and decreased the stability of stored pasteurized milk to PL activity (Newstead et al., 2006). Additionally, uncontrolled proteolysis can result in poor curd formation (Srinivasan and Lucey, 2002) and degradation in stored casein products intended to be used as functional ingredients (Nielsen, 2002).
Milk composition has a dynamic nature and is economically important to milk producers and processors and nutritionally values are important to consumers. Numerous factors have been identified that influence the level of plasmin (PL) and plasminogen (PG) in bovine milk such as stage and number of lactations, time of year, milking system, breed and animal health. Understanding the function of the PL system components, their interactions with other milk composition and on-farm factors is crucial for efficient control of PL activity. Additionally, determining the factors that enhance or inhibit PL activity and the factors that influence the shift of PL from the casein to the whey fraction can lead to better control of the PL system (Ismail & Nielsen, 2010). Currently, the dairy industry is trying to find the best conditions for the processing of the products to enhance quality.
2
1.1. Aim
The aim of this study was to investigate if on-farm factors (i.e., seasons, breed and milking system) have an influence on the PL and PG-derived activity of raw milk from 18 different farms in northern Sweden, as well as to investigate the relationship and/or possible correlations between PL and PG-derived activity and milk composition (i.e., pH, protein, somatic cell count and total bacteria count).
1.2. Hypothesis
• The raw milk plasmin and plasminogen-derived activities are affected by the seasons, breed and milking system.
• The raw milk plasmin and plasminogen activities are correlated to the raw milk composition (i.e., pH, protein, somatic cell count and total bacteria count).
3
2. Literature Review
2.1. Milk composition
Milk is defined as the secretion of the mammary glands of mammals, its primary natural function is new born offspring nutrition. Milk of some farm animals, especially cows, buffaloes, goats and sheep, is also used for human consumption, either as such or in the form of a wide range of dairy products (Walstra et al., 2005).
Milk and dairy products are important components of most diets of different cultures and peoples. Raw milk composition determines the nutritional value and the technological properties of milk and dairy products (Heck et al., 2009). Specifically, milk protein. An investigation of Swedish dairy milk composition in the 1970s and in 1996 showed a substantial decrease in the casein content of Swedish raw milk during this period. The clarification behind the decrease in casein content in Swedish dairy milk could be the increased milk yield, as well as factors including plasmin activity, breeding, feeding and payment systems may be involved, leading to attention to increase milk yield more than the content of protein and fat (Lindmark-Månsson et al., 2003). Such a decrease in casein content would also be unfavourable for the dairy industry. Cheese yield, for example, increases with casein concentration, and cheese properties like milk coagulation time and curd firmness depend on the casein composition (Wedholm et al., 2006). Therefore, milk composition has great concern for the dairy industry. Furthermore, milk composition and milk proteins could vary with stage and number of lactations, feeding, management strategies, season, health status of the cow and genetic factors (Bobe et al., 1999).
Milk protein accounts for approximately 3.2-3.8%. It consists of about 20% whey proteins with major components α-lactalbumin (α-LA), β-lactoglobulin (β-LG) and 80% caseins, divided into major subclasses α- (αS1- and αS2-), β-, and κ-casein (-CN), which are arranged in micelles (Swaisgood, 1982). Furthermore, minor constituents such as proteolyzed fragments, bovine serum albumin, free amino acids, and immunoglobulins add to the total protein concentration of milk (Maas et al., 1997; Elgar et al., 2000). The reported composition of respective major proteins in milk partly depends on the applied measuring method. In mid-infrared spectroscopy α-LA accounts for 3% of milk protein, β-LG for 9%, and the caseins for 31, 10, 37, and 10% (αS1-, αS2-, β-, and κ-CN, respectively) (De Marchi et al., 2009), whereas in polyacrylamide gel electrophoresis, α-LA and β-LG relate to 5 and 15% of milk protein and α-, β-, and κ-CN for 40, 29, and 11% (Ng-Kwai-Hang and Kroeker, 1984).
Caseins, α-LA, and β-LG are synthesized in the epithelial cells of the mammary gland from primary blood constituents, which serve as precursors. The yield and composition of major bovine milk proteins determine the value of the product, depending on how the milk will be used (Gellrich et al., 2014). For cheese making a higher casein content, particularly higher κ-CN, correlates to increased curd yield, stronger curd firmness, and less casein loss in whey (Hallen et al., 2010).
4
2.2. Proteolytic activity in milk
Proteases are enzymes that degrade proteins. Raw milk may have proteolytic activity from endogenous and indigenous origin which could be caused by unpleasant flavours and odours in milk and dairy products (Fox, 1981). Several bacteria present in raw milk can produce proteases that are considered as an external factor (Fox, 1981). Among them, those from psychrotrophic microorganisms, which produce enzymes under refrigeration, cause the most serious problems (Cousin, 1982). Bacillus subtilis is a psychrotrophic microorganism (Kohlmann et al., 1991) and secretes a thermo-resistant protease (Poffé & Mertens, 1988) which may cause proteolysis in pasteurized or sterilized milk (Law et al., 1977). Decreased thermal stability is a technological result of the presence of bacterial proteases in milk. On the other hand, these enzymes degrade caseins which imply losses in the yield of cheese and an increase of the nitrogen content of the whey (Gebre- Egziabher et al, 1980).
Bovine milk includes abundant complex and interconnected proteolytic systems, including zymogens, active proteases, protease inhibitors and protease activators which has a considerable proteolytic activity of milk and dairy products protein, including plasmin (Korycha-Dahl et al., 1983), elastase (Kelly et al., 2006), cathepsin D (Fox, 1981), cathepsin B (D’Alessandro et al., 2011), kallikrein (Heegaard et al., 1994b) and several carboxy- and aminopeptidases (D’Alessandro et al., 2011). The balance of these system components controls the overall proteolytic activity of milk (Dallas et al., 2015).
These proteolytic enzymes are secreted in their inactive form (as zymogens) and must be cleaved at a specific peptidic bond by a protease activator to become the active enzyme. In addition, bovine milk supplies many protease activators (PA); for instance, tissue-type plasminogen activator (t-PA) and urokinase-type activator (u-PA) as plasmin activators (Wickramasinghe et al., 2012). Milk contains a variety of antiprotease, e.g. α1-antitrypsin in order to counterbalance the effect of the protease activators (Dallas et al., 2013).
2.3. Proteolytic enzymes
2.3.1. Plasmin and plasminogenThe PL and PG found in bovine milk are basically analogous to those found in bovine blood, through their heat and pH stabilities, pH optimum, specificity for casein hydrolysis, inhibition patterns (Reimerdes, 1983), and as indicated by their amino acid sequence (Benfeldt et al., 1995).
Plasmin (EC 3.4.21.7) is a serine proteinase and referred to as milk alkaline proteinase from bovine plasma (Chen et al., 2003). In addition, PL is a heat stable enzyme and pH dependable (Sharma et al., 2014). Plasmin that occurs in milk together with its inactive zymogen, plasminogen, is the most significant protease in total proteolytic activity (Fox, 1981). It mainly acts on the milk caseins and degrade β, α S-1 and α S-2 caseins to γ-casein, proteose peptones and λ–casein, respectively (Bastian and Brown, 1996). The optimal pH range for PL activity is 7.5-8.0 and optimum temperature for PL activity is 37 °C (Fox, 1981).
5
Plasmin, mostly in its zymogen form, PG, enters milk from the blood via the mammary cell wall lining, and associates mainly with the casein fraction of the milk (Ismail & Nielsen, 2010). In fresh milk, PG is the predominant form, where its concentration is 2 to 30 times that of PL (0.8-2.8 μg/mL PG compared with 0.1-0.7 μg/mL PL; Ozen et al., 2003). Therefore, any potential activation of PG could contribute significantly to PL activity in milk. The conversion of PG into PL by PA can occur while the milk is in the mammary lumen, before milking and during milk storage (Alichanidis et al., 1986).
Numerous factors have been identified that influence the level of PL and PG in bovine milk, with higher PL activity being attributed to PG activation (Bastian et al., 1991b). Recent research has focused on factors such as processing conditions (i.e., thermal processing and cheese-making conditions), storage conditions, and bacterial proteases. The interaction between the PL system components can be very complex due to the interference of other milk components, (such as whey proteins) under various conditions (pH, heat and storage) (Ismail & Nielsen, 2010). PL and PG can vary significantly with the stage of lactation, lactation number (Bastian et al., 1991b), and mastitis (Politis et al., 1989a). The levels of PL and PG in milk are higher at the end of lactation, in older cows, and in mastitic milk (Ismail & Nielsen, 2010). Plasmin hydrolyzes αs1-, αs2-, and β-caseins, but has little or no activity on the whey proteins β-LG and α-LA (Caessens et al., 1999).
2.4. Plasmin system
Plasmin is part of a complex protease-protease inhibitor system in milk commonly referred to as the PL system (Ismail & Nielsen, 2010). Plasmin exists in milk primarily in its zymogen form, plasminogen (PG), which can be converted into active PL by plasminogen activators (PA) (Grufferty and Fox, 1988a). The conversion of PG to PL is mediated by at least 2 types of PA, tissue-type (t-PA) and urokinase-type (u-PA) (Bastian and Brown, 1996). The PL system also includes plasminogen activator inhibitors (PAI) and plasmin inhibitors (PI), whose effects on PA and PL, respectively, are greatly dependent on the processing conditions (Precetti et al., 1997). The PL system components (Figure 1) interact together and with other components of milk, such as whey and casein proteins, and promote or inhibit proteolysis depending on the processing and storage conditions of milk (Ismail & Nielsen, 2010).
Figure 1. Plasmin system in bovine milk (Ismail & Nielsen, 2010).
Plasmin Inhibitors (PI) Proteolysis of Casein Plasmin (PL) Plasminogen Activators (PA) Plasminogen (PG) Plasminogen Activator Inhibitors (PAI)
6
Tissue-type PA and u-PA, which are also serine proteinases, are present in bovine mammary tissue (Heegaard et al., 1994a) and milk (Lu and Nielsen, 1993). Urokinase-type PA is associated with somatic cells, and t-PA is associated mainly with casein (White et al., 1995). Urokinase-type PA and t-PA activate PG to PL by cleaving the Arg557-Ile558 bond in PG while the milk is in the mammary lumen before milking and during milk storage (Alichanidis et al., 1986).
The conversion of PG to PL can be slowed by the action of plasminogen activator inhibitors (PAI). Similarly, the proteolysis of casein induced by PL can be slowed by the action of plasmin inhibitors (PI). Plasmin inhibitor and PAI are present mainly in milk serum (whey), and their activity is affected by pH fluctuation and heat treatment (Ismail & Nielsen, 2010). Richardson (1983a) suggested that PAI is inactivated by mild thermal treatments. An increase in activity of PL and a subsequent decrease in the concentration of PG were observed in pasteurized milk compared with raw milk after incubation at 37 °C for up to 80 h (Richardson, 1983a). However, the decrease in PG concentration was greater than the increase of PL activity, suggesting that PAI might have been inactivated by pasteurization while some PI remained active.
PL, PG, and PA associates with the casein micelle by lysine-binding and, to a lesser extent, electrostatic forces (Baer et al., 1994). The presence of PL in the whey fraction is the result of its dissociation from the casein micelle. There are several possible factors that influence PL dissociation from casein micelles such as milk storage temperature, pH, ionic strength, hydrolysis of casein by PL, and action of microbial proteases (Ismail & Nielsen, 2010).
2.5. Consequences of plasmin in milk
Cheeses, ultraheat treatment (UHT), casein and whey protein products and non-fat dried milk (NFDM) are the major dairy products which could be influenced by PL activity. Therefore, the importance of PL activity, including both negative and positive aspects of bovine milk and various other dairy products, indicate the requirement to investigate the different factors leading to the activation of PG and hence the PL activity.
Negative effects
Regulation of casein hydrolysis is critical for the manufacture of dairy products. The lower quality dairy products caused by high activity of proteolytic enzymes resulting in casein degradation in fluid products or before forming of casein coagulation in products derived from milk gels (Bastian and Brown, 1996). Poor clotting properties (longer clotting times and reduced curd firmness) are often observed with late lactation milk (Grufferty & Fox, 1988b). Such milk often contains higher concentrations of proteose peptones (Phelan et al., 1982), γ-caseins and other casein breakdown products than mid-lactation milk (Okigbo et al., 1985). This has led to theories that increased plasmin activity is responsible for the poor clotting properties of late lactation milk (O’Keeffe et al., 1982).
7
2.5.1. Positive effects
Hydrolysis of casein after the gel has formed, e.g., cheese, can have a positive influence on product quality (Bastian and Brown, 1996). In relation to the hydrolysis extent and type of cheese. PL activity has been shown to improve the flavour and gross quality on some cheeses, for instance, Swiss and Cheddar cheese (Bastian et al. 1997). In Swiss cheese, rennet has little or no contribution to proteolysis due to chymosin and most other coagulant enzymes are inactive at the high cooking temperature used during manufacturing (Bastian et al. 1997). This leaves the bacterial proteinase-peptidase system in combination with PL to hydrolyse casein in the cheese (Garnot and Molle, 1987). Stoeckel et al (2016) reported that indigenous milk plasmin is highly heat-stable and are able to resist UHT heating processes.
2.6. Plasmin and plasminogen-derived activity measurement in bovine
milk
Several methods have been described in the literature for the detection of proteolytic activity in milk and dairy products. For quantitative determination of proteolytic enzymes, PL activity is often measured using a specific synthetic substrate because of their well-defined structure and purity, and PL activity is referred to the release of chromogenic (Rollema et al., 1983) or fluorogenic (Richardson and Pearce, 1981) products per unit time. The sensitivity and specificity of these substrates are controlled by the primary structure of the peptide part (Rollema et al., 1983). To investigate PG, it is activated to PL by PA and then derived PL activity is measured. These activity assays have many restrictions such as whey proteins interference (Hayes et al., 2002) and competitive inhibition by caseins (Bastian et al., 1991a). Therefore, multiple steps of sample preparation should be taken to remove casein and whey protein interferences before measurement (Wang et al., 2006).
Recently a fluorogenic synthetic peptide was reported to be suitable for the assay of plasmin and plasminogen in milk and milk products (Richardson and Pearce, 1981). The chromogenic substrate H-D-valy1-L-leucyl- L-lysyl-4-nitroanilide (S2251), absorbing light at 450 nm, being released from the substrate due to PL action (Rollema et al., 1983), has been used for the detection of the alkaline milk proteinase associated with isolated casein fractions (Snoeren and van Riel, 1979). Conversely, these chromogenic and fluorogenic measurements have some defects. For instance, although the described methods include a few sample preparations, the impact of other proteinases such as bacterial protease cannot be avoided in measurements (Bastian and Brown, 1996).
8
2.7. Factors affecting plasmin and plasminogen-derived activities
2.7.1. Stage of lactationPlasmin activity and plasminogen (measured after activation) increase at the end of lactation even after adjusting for reduced milk production (Bastian et al., 1991b). There are more γ-casein and less β- and αS1-γ-caseins in late than in mid-lactation milk (Barry & Donnelly, 1981). Richardson (1983b) suggested that increased plasmin activity occurs because more plasmin enters the mammary gland rather than increased plasminogen activation (because of increased levels of plasminogen activators). Politis et al. (1989a) reported plasminogen to plasmin ratios of 6.55 during early lactation and 3.29 at the end of lactation, indicating that there is increased activation of plasminogen to plasmin during late lactation. Bastian et al. (1991b) found that plasmin and plasminogen (total enzyme) increased during the first 6 months of lactation and then remained constant to the end of the lactation period (10 months), but plasmin as a percent of total enzyme was constant during lactation except for the last 3 months when it increased dramatically. This suggests that the flow of enzyme from the blood into milk increases in early lactation and remains constant at the end of lactation, but greater activation of plasminogen occurs toward the end of lactation (Bastian and Brown, 1996).
2.7.2. Lactation number
Milk from older cows has higher plasmin activity though plasminogen levels are constant (Bastian et al., 1991b). Plasmin activity increases in milk from older cows, even after statistically adjusting for somatic cell count (SCC), season, stage of lactation and milk yield (Bastian and Brown, 1996). Therefore, it has been concluded that the PL activity is quite affected by the lactation number compared to the other factors such as breed, stage of lactation and season (Bastian et al., 1991a). Plasmin activity in milk remains constant throughout the lactation of first lactation cows, but it increases dramatically in milk collected from older cows during lactation (Bastian et al., 1991b). This increase in PL and PG-derived activity in older cows could be explained by increased leakage of these enzymes from blood serum to milk, as well as, losing the integrity of tight junctions between mammary epithelial cells (Stelwagen et al., 1997).
2.7.3. Cow breed
Higher plasmin activity has been observed in milk from Holstein-Friesian cows (0.27-0.53 mg L-1) compared to Jersey cows (0.154-0.37 mg L-1) (Richardson, 1983b). A similar trend was observed in Swedish Friesian and Jersey cattle (Schaar, 1985). The different casein contents of milk may cause milk from different breeds to exhibit varying PL activity (Bastian et al., 1991a). On the other hand, Schaar (1985) concluded that the negative correlation between plasmin activity and casein content is probably caused by competition between casein and the synthetic substrate used to measure plasmin activity. Bastian et al. (1991a) found that casein interferes with plasmin assays that utilize synthetic substrates. From this, it seems that there
9
are no differences due to breed. The interference can be modelled as competitive inhibition and can be avoided by reducing the casein substrate ratio. Bastian et al. (1991a) found no significant differences between individual cow milk samples collected from a herd of Jerseys (19 cows) compared to a herd of Holsteins (19 cows) after adjusting the casein substrate ratio to avoid interference by casein.
2.7.4. Milking system
The automatic milking system (AMS) have an opportunity to fulfil several improvements, through relieving the farmer from the labour-intensive routine of the conventional milking system (CMS) parlour and allowing a voluntary increase in milking frequency (MF) of the cow, which has been associated with an increase of 2 to 8% of milk production for multiparous cows (Svennersten-Sjaunja and Pettersson, 2008). In addition, AMS is shown to produce milk with good quality and safety and therefore, have gained popularity in dairy farming (De Koning, 2010). AMS implies variability in MF, generally affected by several factors related to the cow (parity, days in milk (DIM) and health status) and management (Spolders et al., 2004). Like a cascade, different MF within AMS, also characterized by irregular milking intervals, may affect milk production (Speroni et al., 2006), milk quality (Abeni et al., 2005b), and some metabolic aspects (Abeni et al., 2005a).
Cows in AMS milk more frequently compared with cows in CMS (Hovinen and Pyörälä 2011). Abeni et al. (2008) evaluated the effect of CMS and AMS on PL and PG derived activities that the PG and total (PL+PG) activities were lower in AMS as compared to CMS. MF acts through the effect of milking interval on the time available for PG to be converted to PL, resulting in decreased PG: PL ratio changing from to thrice-daily to twice-daily milking (Sorensen et al., 2001). MF influencing the PL and PG-derived activities in milk from Holstein Frisian cows. Further, the PL and PG derived activities were significantly higher in cows having reduced milking frequency (Kelly et al. 1998).
2.7.5. Environmental factors - seasons
Reliance on pasture and seasonal calving has produced irregularities in the milk supply in terms of both quantity and composition and is accompanied by seasonal variations in the manufacturing properties of the dairy product. Therefore, environmental changes in temperature and day length may also impact on milk composition and the PL and PG-derived activity (Gina et al., 2002).
There was a strong influence of time of year on activities and yields of plasminogen and total enzyme, with activities highest in spring followed by summer (Gina et al., 2002). An opposite finding was observed by Bastian et al. (1991b) that activities were greatest during autumn and winter, but these authors did not include cow management details and it is difficult to rationalize these contrasting findings. Level of feeding can, however, have an influence on proteolytic activity (Nicholas, 1998), and the quantity and quality of feed in the pasture-based systems varies considerably, especially between seasons (McCall & Smith, 1998). Leiber et al (2006) found that there were clear effects on the plasmin system in relation to forage maturity. PL activity increased and PG derived activity decreased with increasing sward maturity.
10
2.8. Gross milk composition
2.8.1. The pH of milkPlasmin is most active at pH 7.5 to 8.0 and at 37°C (Fox, 1981), but is stable and active over a broad pH range as indicated in part by its activity in various cheeses (Bastian and Brown, 1996). Lowering the pH of milk, such as in the case of cheese and yoghurt production, will cause the precipitation of casein proteins, thus forming a curd. Low pH causes dissociation of the casein micelle and with it the dissociation of PL and PG from the micelles into the whey fraction of milk (Ismail & Nielsen, 2010). Politis et al. (1989b) found a significant and positive correlation between PL activity and pH. There was also a significant correlation after adjustment for SCC, which indicates an independent relationship between PL and pH in bovine milk. It has been shown in the study conducted by Bastian et al. (1991b) that neither pH, protein nor fat content influences PL or PG activity. In this study, the correlation coefficient between pH and PL activity was r = 0.22, that suggest that there is little (linear) correlation between PL or PG and pH in bovine milk.
2.8.2. Somatic cell count
Somatic cells (SC) consist of leukocytes such as lymphocytes, polymorphonuclear neutrophils and macrophages. Milk SCC is used to assess inflammation, the health status of the mammary gland, and milk quality (Larsen et al., 2010). The normal SCC of bovine milk is 7.5×10⁴ cells/mL with macrophages contributing mostly to the SCC (by 61%) (Boutinaud and Jammes, 2002). SCC in milk may be influenced by mammary infection, stage and/or the number of lactation (Dulin et al.,1983), animal species, milk production level and management practices (Rupp et al., 2000). SC secrete endogenous enzymes like PAs that have a direct affecting on the PL activity of milk (Li et al., 2014). Politis et al. (1989a) reported that as SCC in milk increased from less than 250,000 to more than 1,000,000 the concentration of plasmin and plasminogen increased from 0.18 to 0.37 mg L-1 and from 0.85 to 1.48 mg L-1, respectively.
11
2.8.3. Mastitis
Mastitis is one of a major disease in dairy cattle that could be a real reason for significant economic losses in result to decrease milk production, increase veterinary costs, and discarded milk (Windig et al., 2005). It involves inflammation of the mammary gland because of the invasion and multiplication of pathogenic microorganisms such as Escherichia coli and Staphylococcus aureus (Bradley, 2002), resulting in induction of the innate immune defence system in the mammary gland. Somatic cells such as polymorphonuclear leucocytes (PMN) and macrophages are the major cellular immune components that respond to infection by secreting various substances, for example, cytokines disrupt the tight junctions between the secretory epithelial cells, which results in increased levels of the PL and PG-derived activity in the infected glands (Larsen et al., 2010). Furthermore, some bacteria secrete activators of protease zymogens (Larson et al., 2006). Higher plasmin activity in mastitic milk may be attributed to plasminogen activators (Grufferty & Fox, 1988c) or proteolytic enzymes (Barry & Donnelly, 1981) that occur in somatic cells. Thus, proteolysis of casein increases in bovine milk during elevated SCC and mastitis (Andrews, 1983).
2.8.4. Bacterial proteases
Bacterial proteases affect the PL system, which in turn will affect the quality of dairy products. For instance, psychotropic microorganisms producing metalloproteinases during refrigerated storage that have proteolysis activity in milk (Cousin, 1982). Dairy industries heading to minimize the milk frequency collection; thus, the refrigerated storage of milk has been lengthened, allowing the psychotropic bacteria to dominate the microflora (Ismail & Nielsen, 2010). The heat-stable proteases produced by the psychrotrophic bacteria can destabilize the casein micelles by hydrolyzing κ-CN (Cromie, 1992), resulting in reduced cheese quality, production of small peptides that contribute to bitter flavour, UHT gelation, and fouling of heat exchangers (Champagne et al., 1994).
Decreased PL activity was observed in fresh raw milk after 4 d of storage at 4°C, with the psychrotrophic bacterial count reaching 106 to 107 cfu/mL (Guinot-Thomas et al., 1995). A reduced PL activity in the casein fraction and an increased activity in the whey fraction were observed with the growth of psychrotrophic microorganisms and the presence of proteases they produced (Fajardo-Lira et al., 2000). Frohbieter et al., (2005) concluded that some bacterial proteases can enhance the activity of PA, or act as a PA, to increase plasmin activity.
12
3. Materials and Methods
3.1. Samples collection
Raw milk samples of farm milk and silo milk were collected from 18 different dairy farms with different environmental and management factors in northern Sweden, (i.e., cow management system, milking system, breed and number of cows). Milk was sampled on a seasonally basis in three different occasions: Nov 2017, Feb 2018 and Sep 2018. All analyses of milk samples were conducted at the dairy products laboratory, Department of Food Science, BioCenter at the Swedish University of Agricultural Sciences SLU, Uppsala.
3.2. Sample preparation
The collected milk samples were defatted by centrifugation (Himac CT15RE, Hitachi Koki Co., Ltd.) at 10 000 g at 4°C for 10 minutes. A cotton stick was used to remove the fat layer from the surface. The defatted milk samples were transferred to 2 mL Eppendorf safe lock tubes (Eppendorf, Germany) and stored at -20 °C for further analyses.
3.3. Material preparation
3.3.1. Plasmin bufferThe buffer components were calculated according to given equation m (g) = M (mol) x C (M) x V (L). Plasmin buffer was prepared as described by Saint-Denis et al. (2001), consisting of 3.41 g ε-aminocaproic acid (EACA) 20 mM (Sigma-Aldrich, catalog nr. A2504, Mw 131.17, China), 10.85 g Trizma buffer 53 mM (Trizma hydrochloride, Sigma-Aldrich, catalog nr. T5941, Mw 157.6, USA) and 8.9 g NaCl 117 mM (Sodium Choloride, Sigma-Aldrich, catalog nr. S7653, Mw 58,44) prepared in 2 litters of distilled water. pH was adjusted to 7.4 using 7 M sodium hydroxide NaOH (Sigma-Aldrich, USA) by using a pH meter (PHM210, Standard pH meter, MeterLab®, Germany). The buffer was stored at room temperature (20 °C).
3.3.2. Substrate solution
A vial of 25 mg of freeze-dried Chromogenic substrate (BIOPHEN CS 41 (03), HYPHEN BioMed, Neuvillec-sur-Oise, France) was diluted with 10 ml of distilled water to a concentration of 2.5 mg/ml-1. The substrate solution was aliquoted and stored at 8 °C.
3.3.3. Urokinase solution
A vial of 10 000 IU of freeze-dried Urokinase from human kidney cells was diluted with 600 μL of distilled water to a concentration of 16 666 IU urokinase/ml-1. The enzyme solution was aliquoted and stored at -20 °C.
13
3.4. Plasmin and plasminogen isolation
PL and PG isolation were performed according to the method described by Korycha-Dahl et al. (1983). The milk samples were dissolved at room temperature and vortexed for 30 seconds (Vortex Genie2, Bergman Labora AB, Sweden). A volume of 320 μL of skimmed milk was mixed with 4680 μL of plasmin buffer in 15 mL Falcon tubes (Sartedt, Germany). Falcon tubes were vortexed for 30 seconds and incubated at room temperature for 2 hours to dissociate the PL and PG from casein micelle. Korycha-Dahl et al. (1983) described that the EACA, which is a lysine derivative, will dissociate PL and PG from casein by binding to the lysine binding sites of PL and PG. The NaCl of the plasmin buffer will also contribute to the dissociation of PL and PG from casein (Saint-Denis et al., 2001). The incubated solution containing skimmed milk and plasmin buffer were then centrifugated by ultracentrifugation machine (OptimaTM MAX-XP, Beckman Coulter, Inc., Bromma, Sweden) using RP55T angle rotor, at 4 0C for 1 h at 100 000×g. Then, milk serum fractions were transferred to 2 mL Eppendorf safe lock tubes (Eppendorf, Germany) and stored at -20 °C.
3.5. Plasmin and plasminogen-derived activity measuring
PL and PG-derived activities of milk were measured using a spectrophotometric method according to Korycha-Dahl et al. (1983). A 96-well multi-mode microplate reader (FLUOstar Omega, BMG Labtech, Ortenberg, Germany) was used to determine p-nitroanilide (pNA) that produced from chromogenic substrate.
PL activity was measured in a solution containing 150 μL milk serum and 40 μL chromogenic substrate. The mixture was pipetted on a 96-well plate. All samples were analysed in duplicates. The same reaction mix of the chromogenic substrate and milk serum was used for determining the total proteolytic activity of PL and PG. An addition of 4.5 μL of urokinase (49.5 Plough U) was pipetted to duplicate wells. 200 μL of plasmin buffer was pipetted into each of three wells as blank for both assays.
The level of PG-derived activity is then calculated by the difference between total activity and PL activity, as the isolate contained both PL and PG. PL and PG-derived activity were measured spectrophotometrically (FLU-Ostar Omega, BMG LABTECH). Absorbance was measured for 2 hours (41 cycles, 3 min/cycle), at 405 nm, at 37°C. Data were analysed by using MARS Data Analysis Software (BMG LABTECH).
The PL activity and total activities were measured as change in absorbance during a specific period using the linear part of the absorbance curves against time. Both PL and PG derived activities were measured in the same unit i.e. the amount of PL or urokinase activated PG that causes a 0.001 change of absorbance at 405 nm during 1 minute at pH 7.4 and 37 °C under the experimental conditions.
14
3.6. Milk composition data
Data over raw milk components were obtained from Eurofins Steins Laboratorium AB, Sweden. Milk components included in the investigation were: pH, protein (%), SCC (cells/ml) and TBC (cells/ml). SCC was analysed with flow cytometry and fluorescence techniques using Fossomtic equipment from Foss. Total protein content was measured with Fourier Transform Infrared (FTIR) analysis, using CombiFoss 6000 equipment from Foss. Control system of received values was based on known reference values, both national and international obtained.
3.7. Statistical analysis
Statistical analyses were performed using Minitab® 18 (Minitab, Inc., USA) to identify the effect of breed, milking systems and seasons on PL and PG-derived activity. A one-way Analysis of variance (ANOVA) was carried out to test treatment effect. The level of significance was declared at 0.05, meaning a p-value of < 0.05 was considered significant. Pearson’s correlation was used to measure the strength of a linear correlation using the same software. PL and PG-derived activity were tested for correlation with pH, protein, SCC and TBC. Graphical illustrations were made using Microsoft Excel and SigmaPlot (Systat Software, San Jose, CA).
15
4. Results
4.1. Variation of plasmin and plasminogen-derived activity in raw milk
with the seasons
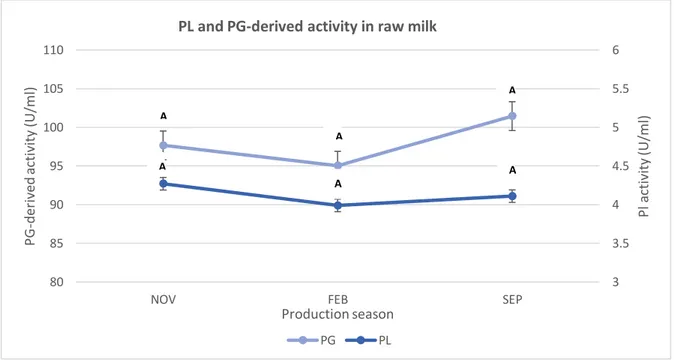
The variation in mean PL and PG-derived activities in raw milk for all farms among different production season are shown in Figure 2. PL activity in farms milk (n=18) was on average (4.27 U/ml), (3.99 U/ml) and (4.11 U/ml) over autumn, winter and summer respectively. There was a trend of decreasing PL activity from November. PG-derived activity in farms milk (n=17) was on average (97.66 U/ml), (95.03 U/ml) and (101.45 U/ml) over autumn, winter and summer respectively. Statistically, the production season had no effect (P > 0.05) on the average PL and PG-derived activities by using the one-way ANOVA-test. Autumn, winter and summer were grouped together and did not differ significantly from each other when conducting Tukey’s method on PL and PG-derived activity.
Figure 2. Variations in mean PL and PG-derived activity in farm milk collected in November 2017, February
2018 and September 2018. Data points present mean values for 18 farms of triplicates for each farm. Different letters A, B indicate statistically significant differences among seasons at P < 0.05.
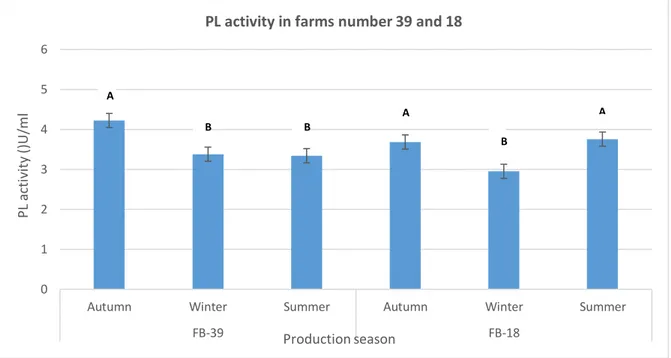
The production season had an effect (P < 0.05) on the average PL or PG-derived activities for some farms when compared the effect of the three production seasons factor on each farm participating in this study separately by using the one-way ANOVA-test. In the individual statistical test within 18 farms involved in this study, some farms showed significant differences in PL and PG-derived activities during the three seasons concerned. The variation in mean PL activity in raw milk in farms number 18 and 39 at different production seasons is shown in Figure 3. Farm number 18 that contains a conventional milking system and Holstein cow breed showed higher (P < 0.05) PL activities. When conducting Tukey’s method on PL
3 3.5 4 4.5 5 5.5 6 80 85 90 95 100 105 110
NOV FEB SEP
P l a cti vi ty (U/ m l) PG -der ived acti vi ty (U/ m l) Production season PL and PG-derived activity in raw milk
PG PL A A A A A A
16
activity of the farm number 18, two groups are formed, with summer (3.76 U/mL) and autumn (3.69 U/mL) are being the seasons differing significantly from winter (2,95 U/mL). While farm number 39 that contains conventional milking system and a mixed breed of Swedish Red/Holstein had higher (P < 0.05) PL activities in autumn (4.22 U/mL) than in winter (3.38 U/mL) and summer (3.34 U/mL).
Figure 3. Variations in PL activity in farms number 39 and 18 collected in November 2017, February 2018 and
September 2018. Different letters A, B indicate statistically significant differences among production seasons at P < 0.05.
The variation in mean PG-derived activity in raw milk in in farms number 20, 40, 30 and 23 among different production season is shown in Figure 4 and 5. Farm number 20 that had an automatic milking system and mixed breed of Swedish Red/Holstein showed higher (P < 0.05) PG-derived activities in summer (111,08 U/mL) than in autumn (86,03 U/mL) and winter (88,57 U/mL). Similar results for farm number 40 that had a conventional milking system and Mountain breed showed higher (P < 0.05) PG-derived activities in summer (128,05 U/mL) than in autumn (82,75 U/mL) and winter (88,57 U/mL).
Farm number 30, with a conventional milking system and Swedish Red cattle had higher (P < 0.05) PG-derived activities in winter (98,78 U/mL) than in autumn (93,28 U/mL) and summer (78,67 U/mL). Farm number 32, with an automatic milking system and mixed breed of Swedish Red/Holstein, had also higher (P < 0.05) PG-derived activities in autumn (93,74 U/mL) and in summer (86,25 U/mL) than winter (76,11 U/mL).
0 1 2 3 4 5 6
Autumn Winter Summer Autumn Winter Summer
FB-39 FB-18 P L acti vi ty () U/ m l Production season
PL activity in farms number 39 and 18
A A
B
A
17
Figure 4. Variations in PG-derived activity in farms number 20 and 40 collected in November 2017, February
2018 and September 2018. Different letters A, B indicate statistically significant differences among production seasons at P < 0.05.
Figure 5. Variations in PG-derived activity in farms number 30 and 32 collected in November 2017, February
2018 and September 2018. Different letters A, B, C indicate statistically significant differences among production seasons at P < 0.05. 0 20 40 60 80 100 120 140 160
Autumn Winter Summer Autumn Winter Summer
FC-20 FC-40 PG -der ived acti vi ty (U/ m l) Production season
PG-derived activity in farms number 20 and 40 A A B B B B 0 20 40 60 80 100 120 140
Autumn Winter Summer Autumn Winter Summer
FB-30 FB-32 PG -der ived acti vi ty (U/ m l) Production season
PG-derived activity in farms number 30 and 32
B B A A A C
18
The variation in mean PL and PG-derived activities in raw milk for all silos among different production season are shown in Figure 6. PL activity in silos milk (n=3) was on average (4.32 U/ml), (5.10 U/ml) and (5.48 U/ml) over autumn, winter and summer respectively. PG-derived activity in silos milk (n=3) was on average (90.83 U/ml), (97.12 U/ml) and (97.26 U/ml) over autumn, winter and summer respectively. Statistically, the production season had no effect (P > 0.05) on the average PL and PG-derived activities by using the one-way ANOVA-test. Autumn, winter and summer were grouped together and did not differ significantly from each other when conducting Tukey’s method on PL and PG-derived activity.
Figure 6. Variations in mean PL and PG-derived activity in silo milk collected in November 2017, February 2018
and September 2018. Data points present mean values for 3 silos of triplicates for each silo. Different letters A, B indicate statistically significant differences among production seasons at P < 0.05.
3 3.5 4 4.5 5 5.5 6 80 85 90 95 100 105 110 115 120
Nov Feb Sep
P L ac ti vi ty (U/ m l) PG -der ived acti vi ty (U/ m l) Production season
Mean PL and PG-derived activity in silo milk
PG PL A A A A A A
19
4.2. Effect of breed on plasmin and plasminogen in raw milk
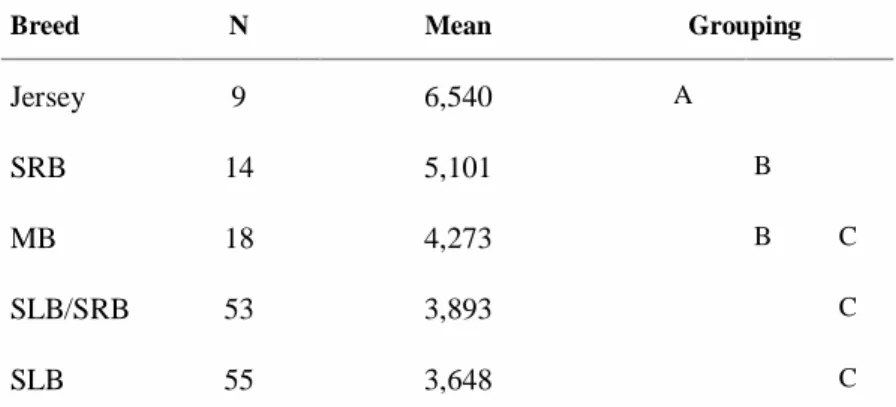
The variation in mean PL activity of raw milk as affected by different breeds is shown in Figure 7. The grouping information when conducting Tukey’s method on PL activity is shown in Table 1. Farms with a Jersey breed showed higher (P < 0.05) PL activity (6,54 U/ml) compared to all other breeds in other considered farms. It was observed that farms containing Swedish Red cattle (SRB) had higher (P < 0.05) PL activity (16.2%, 31% and 39.8%) comparing to the farms having a Mountain Breed, a mixture of breeds SLB/SRB and SLB, respectively. Mountain Breed farms had higher (P < 0.05) PL activity (17.13%) than farms having Holstein (SLB).
Figure 7. Variations in mean PL activity as affected by different breeds. Different letters A, B, C indicate
statistically significant differences among different breeds at P < 0.05.
Table 1. PL activity in farm milk as affected by breeds and grouping information using the Tukey Method and
95% confidence.Means that do not share a letter are significantly different.
0.00 1.00 2.00 3.00 4.00 5.00 6.00 7.00 SLB SRB MB Jeresy SRB/SLB P L acti vi ty (U/ m l) Breed
Mean PL activity in farm milk
Breed N Mean Grouping
Jersey 9 6,540 A SRB 14 5,101 B MB 18 4,273 B C SLB/SRB 53 3,893 C SLB 55 3,648 C A B B, C C C
20
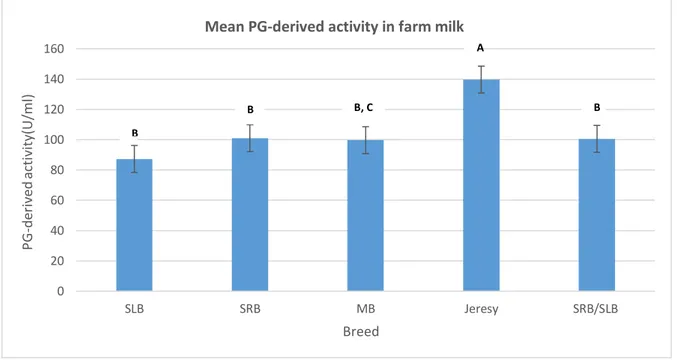
The variation in mean PG-derived activity in raw milk as affected by different breeds is shown in Figure 8. The grouping information when conducting Tukey’s method on PG-derived activity is shown in Table 2. Farms with a Jersey breed had higher (P < 0.05) PG-derived activity (139,67 U/mL) compared to all other breeds under study. It was observed that farms containing Swedish Red cattle (SRB), a mixture of breeds (SLB/SRB) and Mountain Breed had higher (P < 0.05) PG-derived activity (13.5%, 31%, 13.1% and 12.4%, respectively) comparing to the farms having Holstein (SLB).
Figure 8. Variations in mean PG-derived activity as affected by different breeds. Different letters A, B, C indicate
statistically significant differences among different breeds at P < 0.05.
Table 2. PG-derived activity in farm milk as affected by breeds and grouping information using the Tukey Method
and 95% confidence.Means that do not share a letter are significantly different.
0 20 40 60 80 100 120 140 160 SLB SRB MB Jeresy SRB/SLB PG -der ived acti vi ty( U/ m l) Breed
Mean PG-derived activity in farm milk
Breed N Mean Grouping
Jersey 9 139,67 A SRB 14 101,00 B SLB/SRB 53 100,51 B MB 18 99,70 B C SLB 55 87,29 C A B B, C B B
21
4.3. Effect of milking system on plasmin and plasminogen in raw milk
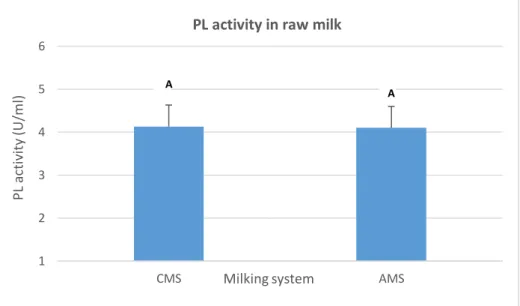
The variations in mean PL activity in raw milk with regard to the milking system are shown in Figure 9. The milking system had no effect (P > 0.05) on the average of PL activity of the considered farms. The mean PL activity presented to be closed in CMS and AMS (4.13 and 4.10 U/ml) respectively.Figure 9. Variation of PL activity according to the milking system; AMS: Automatic
milking system and CMS: Conventional milking system. Different letters A, B indicate statistically significant differences among milking systems at P < 0.05.
The variations in mean PG-derived activities in raw milk for each of the milking systems are shown in Figure 10. There was a significant difference observed in mean PG-derived activities in raw milk between the milking systems. Farms with a CMS had higher (P < 0.05) PG-derived activity compared to farms having AMS (102.66 and 91.84 U/ml, respectively).
Figure 10. Variation of PG-derived activity according to the milking system; AMS:
Automatic milking system and CMS: Conventional milking system. Different letters A, B indicate statistically significant differences among milking systems at P < 0.05. 0 20 40 60 80 100 120 CMS AMS PG -de ri ved a ct iv it y (U /m l) Milking system
PG-derived activity in farm milk A B 1 2 3 4 5 6 CMS AMS P L acti vi ty (U/ m l) Milking system PL activity in raw milk
A A
22
4.4. Correlations between plasmin/plasminogen and milk composition
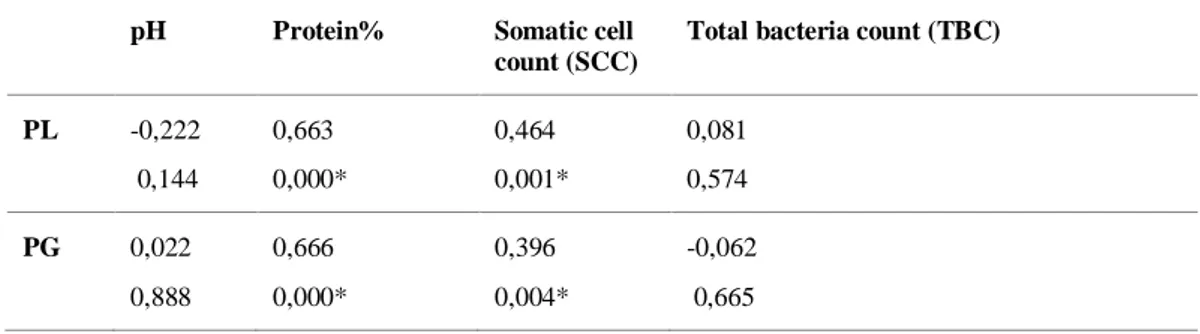
Correlations between the analysed variables in raw milk samples from 18 farms are shown in Table 3. From these results, the p-values for the correlation between PL and PG-derived activity and between total protein and somatic cell count (SCC) are both less than the significance level of 0.05, which indicates that the correlation coefficients are significant. The p-value between PL and PG-derived activity and between milk pH and total bacteria count (TBC) are 0.144 and 0.574, respectively. Since the p-value is greater than the significance level at 0.05, there is inconclusive evidence about the significance of the association between the variables.Table 3. Correlations between different milk compositions in raw farm milk from 18 farms; Cell Content:
Pearson correlation: P-Value
* Correlation is significant at the 0.05 level (2-tailed)
Correlations between the analysed variables in raw silo milk samples are shown in Table 4. From these results, the p-values for the correlation between PL and PG-derived activity and between milk pH, total protein, somatic cell count (SCC), total bacteria count (TBC), Psychrobacter and Thermobacteria are greater than the significance level at 0.05, indicating that there is inconclusive evidence about the significance of the association between the variables.
Table 4. Correlations between different milk compositions in raw silo milk; Cell Content: Pearson correlation:
P-Value
* Correlation is significant at the 0.05 level (2-tailed)
pH Protein% Somatic cell count (SCC)
Total bacteria count (TBC)
PL -0,222 0,144 0,663 0,000* 0,464 0,001* 0,081 0,574 PG 0,022 0,888 0,666 0,000* 0,396 0,004* -0,062 0,665
pH Protein (%) SCC (Units) TBC (Units) Psychrobacter (Units) Thermobacteria (Units) PL -0,483 0,187 0,536 0,137 -0,020 0,969 0,506 0,164 -0,294 0,443 0,566 0,112 PG 0,344 0,364 0,324 0,395 -0,155 0,770 0,084 0,829 -0,130 0,739 0,352 0,353
23
5. Discussion
5.1. Seasonal variation of plasmin and plasminogen-derived activity in
raw milk
In the current study, the production season had no effect on PL and PG-derived activities for all considered farms. In Sweden, calving patterns are nonseasonal, resulting in bulk milk from cows at various stages of lactation all year round (Jordbruksverket, 2012). This would reduce seasonal variation in raw milk composition, although not eliminate it (Auldist et al., 1998). Seasonal variation was not significantly different on PL and PG-derived activities. In agreement, with the current study, Politis et al., (1989b) reported that there is no evidence for an independent relationship between PL activity and production season after statistical adjustments for milk yield, SCC, lactation stage and lactation number. In addition, and like in the present study, Karlsson et al. (2017) concluded that the seasonal effect on the proteolytic activities of raw milk was not significantly different.
In a New Zealand study, Nicholas et al. (2002) investigated the effect of stage of lactation and season on PL and PG-derived activity. They found no effects of stage of lactation or season on PL activity; however, both PG-derived and total PL/PG-derived activities were affected. his might be due to the significant effect of reduced milk yield with advancing lactation, leading to higher PG and total PL/PG-derived activities, or a high increase in the entry rate of total enzyme into mammary gland from the blood. Moreover, different feeding levels in the pasture-based systems between seasons with regard to quality and quantity may have an impact on proteolytic activity (Nicholas, 1998).
However, some farms in the present study showed a significant difference in PL and PG-derived activities during the three seasons after testing them statistically and individually. The purpose behind it was to deepen the study of the production season as an independent effect on proteolytic activity. Hence, removal of some heterogeneous factors (i.e., breed, stage of lactation and milking system) and unknown variables (i.e., feeding levels and management strategies) among the farms that may affect the PL and PG-derived activities. In agreement with findings collected from farm number 18, Nicholas et al. (2002) reported that the highest PL activity was in summer and the lowest in winter. With regard to PG, the highest PG-derived activity was in spring and the lowest was in winter, this is somewhat consistent with results collected from farms number 20 and 40. Nicholas et al. (2002) reported that the PL and PG-derived activities are related to the quality and quantity of feeding and housing conditions that could be affected by the seasons. Furthermore, the effect of the production season could be influenced by some heterogeneous factors such as breed and milking system, since most of the representative breed type and milking systems varied between the farms under present study. Therefore, it is not possible to draw a clear connection to the individual effect of production season on PL and PG-derived activities rather than the holistic effect of all main parameters. Politis et al., (1989b) concluded that the seasonal variation did not have a significant effect because of the large variation within groups. Other factors such as, cow management and feed and level of feeding can also play a role and make difficult to explain the results.
24
Regarding silo milk, Tjernberg (2016) concluded that it's complicated to determine factors influencing PL and PG-derived activity, due to the diversity of farms which are the origin of this milk mixture, with each farm using different milking systems, milking frequencies, and keeping cows of different ages and breeds.
5.2. Effect of breed on plasmin and plasminogen in raw milk
The results of the current study showed that PL and PG-derived activities were significantly affected by breed. Nevertheless, the PL and PG results of this study are in contrast with Richardson (1983b) reported that higher PL activity has been observed in milk from Holstein-Friesian cows (0.27-0.53 mg L-1) compared to Jersey cows (0.154-0.37 mg L-1). Schaar (1985) found a similar finding in Swedish Friesian and Jersey cattle. On the other hand, Fantuz et al. (2001) reported that there was no effect by Holstein and Jersey cows on either PL or PG derived activities. Bastian et al., (1991a) concluded that the different casein contents of milk may cause milk from different breeds to exhibit varying PL activity. In the present study, there are no obvious reasons for the results to be contradictory. Since it was not probable inferencing the same breed effect on PL and PG-derived activity. Supposedly, caused by the interferences with other unknown variables which were not included in this study design (i.e. stage of lactation, parity, age). The implementation of this study was within a larger project, currently lead by Monika Johansson, SLU.
5.3. Effect of milking system on plasmin and plasminogen in raw milk
In this research, PL activity of raw milk was not significantly affected by the milking system. Conversely, the current study reports significant differences in PG-derived activities as affected by the milking system. Abeni et al. (2008) evaluated the effect between CMS and AMS on PL and PG-derived activities and observed that PG and total (PL+PG) activities were lower in AMS as compared to CMS. This is somewhat consistent with the results referred to in this study. In addition, Johansson et al. (2017) reported that PL and the total enzyme activities (PL+PG) were lower in AMS as compared to CMS. This is contrary to the outcomes obtained in the present study.The variations in PL and PG-derived activities as affected by the type of milking system could be explained by the differences in milking frequencies (MFs). Sorensen et al. (2001) concluded that MF lengthens the interval between milking, allowing additional time or PG to be converted to PL. Furthermore, the increase in milking frequencies in AMS leads to maintain the integrity of epithelial tight junctions resulting in resistance to the leakage of proteolytic enzymes from blood to milk.