Department of Animal Nutrition and Management
Cow traffic in an automatic milking rotary
system
– With or without parallel guiding of cows for
milking
Kotrafik i ett automatiskt mjölkningskarusellsystem – Med eller
utan parallell guidning av kor till mjölkning
Lisa Pettersson
Degree project • 30 credits
Agricultural Science Programme - Animal Science Management, RuminantsCow traffic in an automatic milking rotary system – With or
without parallel guiding of cows for milking
Kotrafik i ett automatiskt mjölkningskarusellsystem – Med eller utan parallell guidning av kor till mjölkning
Lisa Pettersson
Supervisor: Jan Olofsson, Swedish University of Agricultural Sciences, Department of Animal Nutrition and Management
Examiner: Rolf Spörndly, Swedish University of Agricultural Sciences, Department of Animal Nutrition and Management
Credits: 30 credits
Level: Second cycle, A2E
Course title: Degree Project in Animal Science - E30
Course code: EX0551
Programme/education: Agricultural Science Programme - Animal Science Course coordinating department: Department of Animal Nutrition and Management Place of publication: Uppsala
Year of publication: 2019
Online publication: https://stud.epsilon.slu.se
Keywords: cow traffic, parallel guiding, automatic milking rotary, cow behaviour
Swedish University of Agricultural Sciences Faculty of Veterinary Medicine and Animal Science Department of Animal Nutrition and Management Management, Ruminants
Abstract
Automatic milking systems and automatic milking rotary systems (AMR) where the cows are gathered and held in a waiting area prior to milking are dependent on cows to enter the milking unit voluntarily. A low rate of cows that voluntarily enter the milking unit affects both the economy, working safety and cow health negatively. Both the flow of animals as well as the interactions in this enclosed area can be affected by various designs of the waiting area. The present study examined dairy cow behaviour, milking time and labour in an AMR with two different waiting area designs: with parallel guiding or no parallel guiding. The parallel guiding consisted of two railings placed in front of the entrance to the AMR. These railings separated the cows, creating what could be seen as three corridors in front of the AMR. A control treatment without parallel guiding and a treatment with parallel guiding was applied for two weeks each. Two groups, G1 and G2, of approximately 60 lactating cows each of Swedish Red and Swedish Holstein breeds were included in the study. The G1 group consisted of mainly primiparous cows and G2 of mainly multiparous cows. For analysis of the behaviours, 20 focal animals were marked in each group. The staff gathered the cows in one of the two waiting area designs prior to milking but were not permitted to interact with the cows for 40 minutes after that. During these 40 minutes, the cow behaviour was studied. An ethogram was used. For example, it was noted if a cow pushed another cow. Both the performing and the receiving animal was noted. When 40 minutes had passed, the staff were allowed to fetch cows that had not entered the AMR. The period from the staff’s first interaction to the last cow entering the milking unit was also studied, each time staff interacted with a cow was noted as well at the total time for staff interaction. Data was collected during 6 milking occasions per group on the second week of each treatment. This was performed twice for each treatment, resulting in a total of 48 milking occasions studied, 24 during each treatment. The results showed a lower frequency of behaviours when parallel guiding was practised (p=0.04), as well as lower total staff interaction time (p=0.04) and staff interactions (p=0.0002). The majority of behaviours were performed by the lightest (40%) or heaviest animals (37%), and multiparous cows (58%). The number of performed, as well as received behaviours, seemed to be increasing with days in milk. The animal receiving a behaviour was in most cases primiparous cows (63%). The majority of the staff interactions were also performed on first parity cows (57%) and the heaviest cows (50%). The number of received staff interactions seemed to be increasing with days in milk. No difference was found between treatments in total time for milking, total walking and waiting time before milking or time spent in waiting area. Neither was a difference found regarding the time spent in waiting area as a group retrieved from the video recordings. However, the parallel guiding did overall not result in longer time intervals when compared to no parallel guiding. The milk yield during the periods when parallel guiding was practised was found to be higher compared to when no parallel guiding was practised (p<.0001). The parallel guiding was not found to have any negative effects on either working time, animal behaviour or milk yield. Further studies are needed to investigate the effects of the parallel guiding in more depth.
Innehållsförteckning
Abbreviations 1
1 Background 2
2 Literature review 3
2.1 Waiting area 3
2.2 Behaviour and social dominance 4
2.3 Labour 5
2.4 Milking and waiting time 7
2.5 Factors affecting milk yield 9
3 Aim and hypotheses 10
4 Material and methods 11
4.1 Animals, Management, and Housing 11
4.2 Study design 12 4.2.1 Milking routines 14 4.3 Data collection 14 4.3.1 Behaviour registrations 14 4.3.2 Staff interactions 15 4.4 Statistical analysis 16 4.4.1 Behaviour 16 4.4.2 Staff interaction 17 4.4.3 Time intervals 17 4.4.4 Order of entrance 17 4.4.5 Milk yield 17 5 Results 18 5.1 Behavioural analysis 18
5.2 Analysis of staff interaction 20
5.3 Time interval analysis 22
5.4 Order of entrance 23 5.5 Milk yield 23 6 Discussion 24 6.1 Behaviour 24 6.2 Staff interaction 25 6.3 Time intervals 26 6.4 Milk yield 27
6.5 Study limitations and further studies 27
7 Conclusion 29
Acknowledgements 30
1
Abbreviations
AMS Automatic milking system AMR Automatic milking rotary WA Waiting area
WP With parallel guiding NP No parallel guiding
G1 Group 1
G2 Group 2
FA Forward area
BA Backward area IPC Interactions per cow DIM Days in milk
2
1
Background
The dairy industry has developed considerably during the last decades. A combined effect of significant advances in genetics, nutrition, farm management and milking machines has led to the dairy industry we know today (Jacobs & Siegford, 2012a). The first automatic milking system (AMS) were installed in the Netherlands in 1992 (Svennersten-Sjaunja & Pettersson, 2008) and by the year of 2016 about 90 000 (28%) of all dairy cows, in Sweden were housed in an AMS (LRF Mjölk, 2017; Jordbruksverket, 2019). One of the most recent AMS systems is the automatic milking rotary (AMRTM, DeLaval International AB, Tumba, Sweden). This system, which was launched in 2010, has 24 milking places and 5 robotic arms. An AMR of this size has a maximum capacity of approximately 90 cows per hour and is designed to operate larger groups of animals, between 300 to 800 cows (Jacobs & Siegford, 2012a).
The efficiency of an AMS depends on cows to voluntarily enter the milking unit as an individual, apart from its herd and without assistance from staff (Jacobs et al., 2012). If the cow does not enter the AMS voluntarily, fetching will be required, resulting in economic losses (Drach et al., 2017). In an AMS or AMR system, the cows may be gathered in a confined area prior to milking, here called waiting area (WA). In such a batch milking system, it is essential that cows are moving voluntary from the waiting area into the parlour. A low animal flow resulting in long waiting time in the WA is not only bad for the economy, it is also likely a stressful environment for the cow (Dijkstra et al., 2012). The flow of animals entering the AMR, as well as the interactions between them, can be affected by various designs of the entrance area of the milking parlour (Wierenga, 1990; Dahlgren, 2013)
It is important to find solutions, making the voluntary movement of cows in the barn more efficient and thereby improving the situation for both the farmer and the animals. In this study, the chosen area for investigations regarding the movement of cows are the WA in an AMR, but the results may be applied in any situation where a queuing situation may arise. Investigations regarding the design of the waiting area and the behaviour of the cows in confined situations are therefore of importance. One way of improving the way cows are entering the parlour, or any other situation where the cows are queuing is by using a parallel guiding of animals in front of the rotary. Parallel guiding is the use of railings to separate the cows. Because of this, the present study examines dairy cow behaviour, milking time and labour in an AMR with two different waiting area designs: with parallel guiding (WP) or no parallel guiding (NP).
3
2
Literature review
2.1 Waiting area
The productivity of an automatic milking system depends on the productivity of the milking equipment and the intensity of the cow traffic (Mangalis et al., 2015). The ideal would be that each cow would occupy the milking place in due time, not reducing or stopping the rotation speed (Mangalis et al., 2015). A well-planned WA is the key to a fast and efficient entrance into the parlour (Albright et al., 1992). The WA is an area in front of the milking unit where the cows usually are gathered and held prior to milking. The characteristics of the WA differs between systems. It can be a closed WA where the only way out is through the milking unit (Hermans et al., 2003), or an open WA where the cows have the opportunity to return to the resting area (Melin et al., 2006). Some systems do not even have a WA, the selection is then performed in the milking unit (Stefanowska et al., 1999a) or in a selection gate located in front of the milking unit (Stefanowska et al., 1999b). Advantages with a closed WA are that it ensures that all cows go through the milking unit (Uetake et al., 1997) and that it encourages the flow of queuing cows through the milking system (Jacobs et al., 2012).
The waiting area should be dimensioned according to the throughput of the milking system (Albright & Arave, 1997). The International Commission of Agricultural and Biosystems Engineering recommend 1.4-2.0 m2 per cow (Flaba et al., 2014). Consequently, it is the size of
the milking herd, which is dependent on milking time and size of the milking parlour, that decides the total size of the waiting area (Fernández et al., 2009). Mangalis et al. (2015) concluded that cow crowding in the WA has an impact on the intensity of cow traffic. For instance, if the crowding was 1.1-1.2 m2 per cow in a WA with mechanic drivers, the traffic intensity was higher compared to a crowding of 1.5-1.7 m2 (Mangalis et al., 2015). Generally, higher stocking densities have been found to potentially reduce the welfare due to an increased frequency of agonistic interactions because of competition over resources (Metz & Mekking, 1984; Fregonesi & Leaver, 2002). Kondo et al. (1989) found that the number of agonistic encounters decreased if space allowance increased.
In order to ensure a high and continuous cow traffic entering the rotary platform and to make the staff labour easier, mechanical drivers (crowding gate) can be used (Mangalis et al., 2014). These mechanical drivers crowd the cows in the WA by reducing available space (Albright et
al., 1992), ensuring a continuous movement into the milking unit (Mangalis et al., 2015). The
mechanical drivers keep the stocking density stable, even though cows are leaving the WA. Mangalis et al. (2015) state that excess cow crowding has been found to promote the occurrence of stressful situations when cows are entering a rotary type milking equipment. For example, a situation where two cows are trying to enter the milking equipment at the same time (Mangalis
et al., 2015).
A master thesis by Andersson (2014) examined the behaviour and throughput of dairy cows when entering and exiting two types of parallel rotaries. The two types of rotaries had either a one-cow entry lane or a 1.5-cow entry lane. In the one-cow entry lane, the cows had to walk one after the other to the rotary. The 1.5-cow entry lane was wider, resulting in cows being able
4 to pass each other before entering the platform. She found no difference in behaviour of the cows between the two rotaries, except for more pushing being performed in 1.5 cow entry lane.
The master theses by Dalemar (2017) and Dahlgren (2013) studied differently shaped waiting areas at the same location as the present study. Dalemar (2017) compared single alley and open waiting area. Dahlgren (2013) compared a large waiting area, a reduced waiting area and a single alley. The results of the two different master theses were contradictory, Dahlgren (2013) concluded that the use of the single alley design decreased the frequency of aggressive interactions as well as time spent herding cows. Dalemar (2017) did on the other hand conclude that aggressive interactions were more frequent in the single alley design compared to the open waiting area.
2.2 Behaviour and social dominance
The complex of relationships found in groups of animals, which is the result of the phenomenon that one animals’ behaviour within a pair can be inhibited by the other, is called social order, rank order, dominance, or hierarchy (Beilharz & Zeeb, 1982). When establishing these relationships, many factors are involved. Once formed, they are usually stable for a long time (Beilharz & Zeeb, 1982; Wierenga, 1990). Regarding these influencing factors, the literature is inconsistent. Philips and Rind (2002) used the term dominance value. This value was attributed to a cow, based on at least one aggressive interaction with at least ten other cows and can be seen as a measure of social dominance. In the study, dominance value was positively correlated with parity number as well as body weight. O’Connell et al. (1989) found that age was related to social rank. But in a study by Ketelaar-de Lauwere et al. (1996), social rank and age or parity number showed no correlation, but social rank and days in milk were positively correlated. The lack of correlation between social rank and age or parity number could be explained by the fact that all cows in the study were in their first to third lactation (Ketelaar-de Lauwere et al., 1996). Due to the fact that it has been observed that dominance values differ over the years for cows (Wierenga, 1990), it is difficult to state if dominance values are affected by age or parity number. Several authors have found no correlations between dominance value and milk yield (Collis, 1976; Ketelaar-de Lauwere et al., 1996; Phillips & Rind, 2002). Cows in late gestation tend to avoid agonistic interactions. Hence, stage of gestations might be a factor that influences the dominance status of a cow (Beilharz & Zeeb, 1982). Body weight is another factor, found by several authors to correlate to social rank (Wagnon et al., 1966; Dickson et al., 1967a; Bouissou, 1972). Bouissou (1972) studied the influence of body weight and horns on social rank during the establishment of social hierarchy in heifers. It was concluded that horns were the major affecting factor, although both factors were of importance.
Beilharz and Zeeb (1982) highlight the importance of separating social dominance and aggression. Dominance is present whenever the behaviour of one animal is inhibited in the presence of another animal. Aggression does on the other hand involve motivation and behaviours that result in repelling other animals. It can be described as an interaction where a butt or push is performed against another cow (DeVries & von Keyserlingk, 2006). Aggression might be involved when dominance relationships are established, but a high ranked cow is not
5 necessarily aggressive once stable relationships are formed (Beilharz & Zeeb, 1982). Although, it is shown that the subordinate animal showed fewer displacements than the dominant animal in 95% of all pairs (Wierenga, 1990). Moreover, Collis (1976) found that the animals dominance value and amount of initiated aggressive interactions were positively correlated. But there are situations where the subordinate animal can displace the dominant animal and this action is more common in situations of overcrowding (Wierenga, 1990).
Cows do often have to stand during long periods of time, waiting in the WA. The dominance value and arrangement of cow traffic affects this waiting time (Thune et al., 2002). Due to this waiting, the WA is likely to be a stressful environment for the cows; they are restricted from performing many behaviours such as feeding, eating and lying down, and furthermore is the locomotion activity reduced (Dijkstra et al., 2012). The cow´s daily budget of behaviours is negatively affected by this waiting. It can result in behaviours being lost from their daily repertoire (Dijkstra et al., 2012). The restriction in performing these lost behaviours may cause stress (Dijkstra et al., 2012), which is shown to impair health, welfare and productivity. In a behavioural study by Dijkstra et al. (2012) it was found that the most prevalent activity in the WA was rumination. In average, 30-50% of the cows ruminated while waiting. The majority of rumination was seen in the WA with the smallest group size, shortest waiting time and the largest space per cow (Dijkstra et al., 2012). The presence of rumination can be seen as an indicator of the absence of stress, since only healthy and unstressed animals ruminate normally (Dado & Allen, 1994; Lidfors, 1996). However, as the animals in the study were not individually identified, it couldn’t be said if the cows started ruminating as time elapsed or if the ruminating cows were performing the behaviour throughout the waiting time and were among the cows remaining last in the WA (Dijkstra et al., 2012). Other behaviours such as aggression, self-grooming, cows grooming another cow, mounting and vocalization seemed to be poorly expressed in the WA. These behaviours occurred below 2% among the cows. Dijkstra
et al. (2012) concluded that the percentage of these behaviours decreased as the group size in
the WA decreased. This could be the result of the social environment in the WA being less stressful for the remaining cows as other cows exit (Dijkstra et al., 2012).
It is important that the cow has time to perform the behaviour of lying down. Rushen & de Passillé (1999) states that high producing dairy cows spend approximately 40% or 50% of their day laying down to ensure high production. When cows lay down, the blood flow to the udder doubles and the rumination lasts for longer periods. Hence, a decreased waiting time, resulting in more time lying down and ruminating, can improve productivity (Rushen & de Passillé, 1999) as well as health status (Galindo & Broom, 2000). It has also been shown that increased time spent standing (Galindo & Broom, 2000) and time away from the resting area (Cook & Nordlund, 2009) give increased risk as well as incidents of lameness. Lameness does not only cause pain, it can also negatively affect the cows’ motivation to visit the milking unit since lameness limits their movements (Klaas et al., 2003).
2.3 Labour
One of the largest costs in dairy production is the cost of labour (Gustafsson, 2009). In Sweden, labour has been found to constitute around 24% of the total cost per kg ECM (Hedlund, 2008).
6 The amount of labour needed is decreasing with increasing herd size (Hadley et al., 2002; O’Donovan et al., 2008; Gustafsson, 2009) and is dependent on work routines and automated tasks (O’Brien et al., 2012). A study by O´Brien et al. (2007) indicated that larger farms tend to use more labour efficient technologies, such as better facilities and less intensive work routines compared to the more traditional labour-intensive methods. A study by O´Donovan et
al. (2008) states that labour input per cow had decreased with a rate of approximately 1 h per
year over 20 years when the results of the study were compared to data of O´Shea et al. (1988).
The AMS requires that cows voluntarily enter the robot or rotary without assistance from staff in order to be efficient (Jacobs et al., 2012). If the cow does not voluntarily visit the AMS, the farmer has to manually fetch the cow. This does also apply to systems where the cows are gathered in a WA prior to milking. Fetching a small number of cows requires minimal effort and can in many barns be combined with other tasks such as cleaning (Rodenburg, 2017). Fetching a larger number of cows requires more labour and interferes with the voluntary traffic to the robot (Rodenburg, 2017) and results in economic losses (Drach et al., 2017). The need to fetch cows could be one of the largest factors reducing the expected decrease in labour when converting to AMS (Bach et al., 2007).
Investigations regarding the willingness of cows to voluntary enter a milking parlour (non AMS), performed by Albright et al. (1992), showed that only 21.4% of the cows in the study voluntary or by vocal request by the farmer entered the parlour. More recently, in a Canadian survey of 43 herds in robotic systems, it was reported that 14.6 ± 10.3 % of the cows needed fetching once or twice per day. In that study, the producers reported that the top three reasons for fetching were; “lazy cows” (57.6%), lame cows (19.0%) or due to cows that were new to the system (11.0%) (Rodenburg & House, 2007). In an even more recent study by King et al. (2016), data from 41 Canadian AMS herds showed a lower fetching rate, where 8.1 ±6.7 % of the cows were fetched at least once a day. It has also been observed that voluntary entering increased as weeks in lactation increased (Jacobs & Siegford, 2012b). After the first week of lactation, 60% of the cows entered milking voluntary. This increased to 75% after two weeks. One month after introduction to the AMS, 95% of the cows voluntarily entered the milking. Cows that were deemed unsuitable, based on teat and udder conformation, needed to be fetched more often (Jacobs & Siegford, 2012b).
Type of cow traffic has an impact on the fetching frequency. The number of fetched cows was considerably higher in free cow traffic compared to forced (Ketelaar-de Lauwere et al., 1998; Rodenburg & House, 2007; Forsberg, 2008). In a study by Rodenburg and House (2007) farms with free cow traffic reported an average of 16.2% fetched cows, while farms with some kind of guided cow traffic fetched on average 8.52% of the cows once or twice daily. Rodenburg (2017) found similar results regarding free and guided cow traffic when excellent management was applied or when the number of cows was well below the capacity of the robot. When circumstances were less ideal and the guided traffic was combined with a waiting area it resulted in longer standing times and stress, especially for the low ranked cows. If the
7 management was poor when free cow traffic was conducted, more labour was needed for fetching.
Working safety
According to 3§ in the Swedish work environment regulations on animal work state that the buildings were animals are kept should be dimensioned and maintained so that working with animals offers safety (AFS 2008:17). Further, 4§ states that if the animals are kept in loose housing systems, the staff must be able to quickly get away safely. According to 9§ regarding driving paths, trusses, gates and other aids shall offer the possibility of protection or escape routes for those who perform the work of moving animals (AFS 2008:17).
A survey among 110 dairy producers in Minnesota reports that the producers view was that cattle-related injuries predominantly were the handlers fault. Either because of lacking attention to the animal or due to poor cattle handling skills. The least important factor regarding the worker injuries was considered the facility design (Sorge et al., 2014). A study on 12 dairy farmers with loose housing systems states that the producers considered the facilities to be of importance for the safety when handling cattle. Especially old facilities were considered to be a risk regarding the safety. Escape routes for the handler and gates with horizontal rails that are easy to climb were among other factors mentioned by the farmers to be of importance in making a facility safer (Lindahl et al., 2012).
2.4
Milking and waiting time
Milking is the most time-consuming task on a dairy farm (O’Donovan et al., 2008; Taylor et
al., 2009). For instance, it required up to 57% of farm labour when 20 farms in New Zealand
using batch milking in grazing dairy systems were studied (Taylor et al., 2009). A reduced need for labour regarding the daily milking routines and less heavy work are reasons for using an AMS (Stal et al., 2003; Jacobs & Siegford, 2012a). A survey among 107 farmers that recently invested in an AMS in Belgium, Denmark, Germany and The Netherlands reported an average labour saving of 19.8% (Mathijs, 2004). When only farms that had kept their herd size more or less stable were considered, the average labour saving was increased to 21.3% (Mathijs, 2004). A study by Gustafsson (2009) comparing working time in various milking systems found that batch milking systems, such as tandem/herringbone/parallel/rotary, are the most time-consuming systems while AMS require the least time per cow. The rotary parlour required 2.15 minutes per milked cow, which is the lowest time for labour associated with milking of all batch milking systems (Gustafsson, 2009).
The waiting time, which is time spent in waiting area prior to milking, in the study by Dijkstra
et al. (2012) varied from 1 minute to almost 2 hours. Dijkstra et al. (2012) examined three
cowsheds. The first cowshed consisted of 519 dairy cows with a mean annual milk production of 6374 kg per cow. The cows were divided into four groups according to milk yield. The cows in cowshed 1 were milked in a 2 x 12 DeLaval tandem milking parlour twice a day. The mean initial space in the WA were 1.5 m2 per cow. The second cowshed consisted of 561 dairy cows with a mean annual milk production of 7916 kg per cow. The cows were divided into two
8 groups according to milk yield and milked in a 2 x 20 Strankgo tandem milking parlour three times a day and had an mean initial space in the WA of 1.1 m2 per cow. The third cowshed consisted of 693 dairy cows divided into five groups according to milk yield with a mean annual milk production of 7675 kg per cow. The cows were milked in a 2 x 12 DeLeval tandem milking parlour three times a day. The mean initial space in the WA were 1.9 m2 per cow. All three cowsheds used automated crowd gates in the WA. The cows were gathered in the WA prior to milking. The mean waiting time in the three cowsheds was 44, 63 and 27 minutes respectively. Social rank and cow traffic arrangement have been found to affect the waiting time. Submissive and dominant cows had an average waiting time of 95 and 78 minutes respectively in a free cow traffic system, against 240 and 140 minutes respectively with guided cow traffic (Thune
et al., 2002). Halachmi (2009) investigated the effect of hierarchal order on cow queue length
when cows voluntary visited an AMS. The mean waiting time in the queue to the AMS was 69 minutes for low ranked cows and only 3.5 minutes for the high ranked cows in an AMS. Melin
et al. (2006) did also observe that low ranked cows spent longer time in the waiting area to an
AMS
.
A study using a prototype of a robotic rotary reported a median waiting time before milking of 129 min, and just over 70% of the cows had entered the rotary after 4 h (Scott et al., 2014). Scott et al. (2014) report that heifers exited the waiting area more rapidly compared to cows later in lactation and that older cows spend at least 1.4 times longer in the WA.The degree of motivation to enter the milking unit is essential for effective cow traffic (Melin
et al., 2006). Prescott et al. (1998) found that the motivation to be milked is variable between
cows, but overall, the motivation is weak. The conclusion was that the motivation to be milked is not enough to attract the cows to an AMS. Compared to being milked, feeding is significantly more rewarding and could be used to motivate cows to be milked (Prescott et al., 1998). In contrast to this, concluded Melin et al. (2006) that both the motivation to milked and to be fed are significant motivations in attracting a cow to the milking unit in an automatic milking system. However, it was concluded that a high motivation to feed was given priority over the motivation to be milked. Kolbach et al. (2013) found that the proportions of bails that were occupied in a robotic rotary were significantly higher when the cows were fed in the bail. Since feeding contributed to voluntary entry to the milking unit, it was concluded that feeding could avoid delays in cow traffic (Kolbach et al., 2013). In a study by Scott et al. (2014), the time spent waiting was nearly halved when the cows were offered feed in a prototype of a robotic rotary compared to no feed. Pirkelmann (1992) concluded that the cows could be motivated not only by supplying concentrate or roughage in the milking unit, but also by locating the milking unit between the lying area and the feeding area when forced cow traffic is conducted.
The entrance order into the milking unit has been found to be relatively constant by several authors (Rathore, 1982; Grasso et al., 2007). Rathore (1982) found that high yielding cows voluntarily entered the milking unit earlier than low yielding cows. This is supported by several more recent studies, also concluding that high yielding cows enter the milking parlour first (Albright et al., 1992; Phillips & Rind, 2002; Grasso et al., 2007; Berry & McCarthy, 2012). Milking order in an AMS is also influenced by dominance. Low ranked cows spent longer time in the WA compared to high ranked cows (Ketelaar-de Lauwere et al., 1996; Phillips & Rind, 2002; Melin et al., 2006). Furthermore, health status does also affect the order of entrance.
9 Cows with health problems such as lameness (Main et al., 2010) and udder diseases tend to enter the milking parlour towards the end of the milking (Dijkstra et al., 2012) and cows entering early have been found to have lower somatic cell count (Rathore, 1982; Berry & McCarthy, 2012). Hence, high yielding healthy cows tend to enter the milking unit first, while lame and low yielding cows enter last.
2.5
Factors affecting milk yield
Mixing groups of cows do sometimes result in a reduction in milk yield, but there are great variations between studies. Jezierski and Podluzny (1984) report a mean decrease in milk yield of approximately 4% due to social tensions after a group change. Phillips and Rind (2001) investigated the effect of mixing primi- and multiparous cows during grazing on the milk production. The mixing of primi- and multiparous cows resulted in a reduction in milk yield, which probably was due to reduced grazing time and increased standing time. Collis et al. (1979) found no change in milk yield despite an increase in aggression due to minor regroupings.
10
3
Aim and hypotheses
The aim of this study was to compare cow traffic, social interactions, milking efficiency and working environment and time with or without a so-called parallel guiding of cows for milking in an AMR. The hypotheses were that the parallel guiding: 1) would give a better working environment because of a higher frequency of voluntary entrance to the AMR and consequently a reduced working time fetching cows, 2) would make the milking more efficient because of a higher animal flow through the AMR and that 3) aggressive behaviour would be less frequent when the WA had parallel guiding.
11
4
Material and methods
4.1 Animals, Management, and Housing
The study was performed at the Swedish Livestock Research Centre at Lövsta, Swedish University of Agricultural Sciences, Uppsala. Two groups of cows (G1 and G2) of both Swedish Red (SRB) and Swedish Holstein (SH) breed were used in the study, approximately 120 dairy cows in total. The reason for the group arrangement were the already established housing of cows in the barn, the two groups were housed in different pens. All cows were not present during the whole experiment due to regroupings, drying off or for health reasons. Group 1 consisted mainly of primiparous cows and G2 consisted of both primi- and multiparous cows. The characteristics of each group are described in table 1. No correlation between body weight and breed was seen, but a slightly positive correlation between body weight and the number of calvings was noted (r=0. 30372, <.0001).
Table 1. Description of the characteristics of the two groups, G1 and G2. Showing the share of breeds, Swedish Holstein (SH) and Swedish Red (SRB), mean body weight and mean milk yield.
G1 G2
Breed 48% SH 52% SRB 38% SH 62% SRB
Body weight (mean) 588 kg 634 kg
Milk yield (mean per milking) 15 kg 16 kg
Share of primiparous cows Mainly primiparous cows Both primi- and multiparous cows
In each group, 20 focal animals were marked, by painting the number of the cow on the back of the animal, approximately every second day. These cows were selected, looking for normal distribution regarding days in lactation. As G2 consisted of both primi- and multiparous cows, 10 primiparous and 10 multiparous cows were marked. There was a positive correlation between body weight and the number of calvings regarding the focal animals (r=0.45285, p<.0001).
Each group was batch milked twice daily, G1 first and G2 secondly, at approximately 05:30 and 15:30, in the DeLaval Automatic Milking RotaryTM (AMRTM). The AMR had a platform containing 24 milking places and 5 robotic arms. Two out of these five robotic arms prepared the udder by cleaning and pre-milking the teats. Two robotic arms attached the teat cups and one robotic arm sprayed the teats after milking. The milking was performed on quarter level. The working time for the robotic arms for cleaning and pre-milking was 35s. The arms that attached teat cups had a maximum working time of 50s and the arm applying teat spray operated during 30s. The AMR had a time-out set for 60s, meaning that the AMR would rotate one milking place if it had been inactive, i.e. no cow had entered the available milking place, for 60s.
The cows in the study were housed in a free-stall system, separated in two pens with a stocking density of ≤ 1:1 (cow:cubicle). Each group of animals had four concentrate feeders, where the cows were fed concentrates according to their calculated requirements in relation to their individual milk yield. The cows were fed silage ad lib. but the number of feeding places differed
12 between the groups, G1 had an cow:feeding place ratio of 3:1 whereas G2 had a ratio of 2:1. A rough overview of the barn is shown in figure 1.
Figure 1. A rough overview of the whole cow barn. The yellow and blue outlines the pen where G1 resp. G2
were housed. The red boxes are selection gates, the green boxes are feeding places (waved) and concentrate feeders (dotted). The arrows indicate the way cows move to and from milking.
4.2 Study design
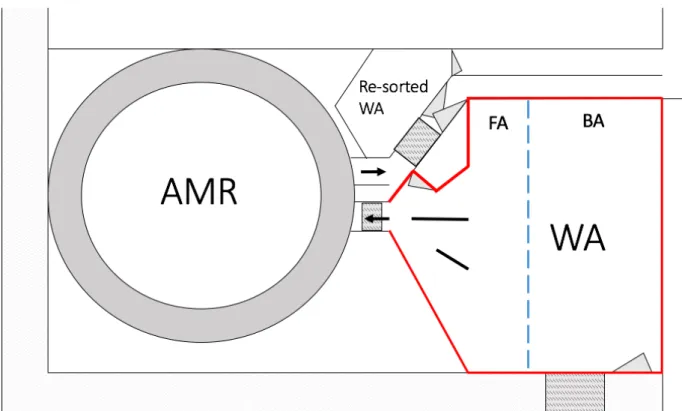
In this study, two differently designed waiting areas were studied; an open waiting area with or without parallel guiding of cows for milking in an AMR. A crowd gate, automatically decreasing the available space in the waiting area was used in both treatments. The parallel guiding consisted of two railings (approximately 2m x 1.7m and 2.5m x 1.7m, respectively) in front of the entrance to the AMR (fig. 2), creating what could be seen as three corridors in front of the AMR. During the video analysis it was noted if the action was performed in the backward or forward area of the waiting area (fig. 3). This separation was only a theoretical separation, not a physical separation of the waiting area.
13
Figure 3. Indicates placement of the two railings and outlines the WA. The blue line shows the theoretical
separation of the forward area (FA) and backward area (BA) and red lines mark the outline of the WA. The railings are indicated by the two black lines in the FA. Three cow identifying portals are plotted, marked by small black lines; one is located in the raceway to the WA, one at the entrance to the AMR, and one after milking where the cows are either redirected back to the AMR, back to the feeding area in respective pens or to the re-sorted WA to the left. Arrows show entrance and exit in the AMR.
Each treatment was repeated twice during two week periods in 8 consecutive weeks; data was collected the second week in each period. Hence, 14 milkings (morning and afternoon) was recorded each data collection week for each group. Out of these 14 milkings, the last 6 fully functioning milkings for each group were chosen to be studied, resulting in 48 group milkings being studied in total. This is visualised in table 2.
Table 2. Visualisation of the study layout for data collection during the two treatments, with parallel guiding (WP) and no parallel guiding (NP) for the two groups, G1 and G2. The first week was habituation (H) and during the second week data from 6 milkings (m) per group were collected. This was performed twice for each treatment.
NP WP NP WP Total
Week 1 Week 2 Week 3 Week 4 Week 5 Week 6 Week 7 Week 8
G1 H 6 m H 6 m H 6 m H 6 m 24
G2 H 6 m H 6 m H 6 m H 6 m 24
14 4.2.1 Milking routines
The staff gathered the 60 cows from one pen to the waiting area prior to milking. When the gate to the waiting area was closed behind the cows, the staff were not allowed to intervene with the cows for 40 minutes. If the AMR had been inactive for 10 minutes, an exception was made and the staff was allowed to look for the reason for inactivity. In that case, the staff was for instance allowed to herd the cow blocking the entrance to the AMR. When 40 minutes had passed, the staff could complete the milking according to normal milking routines. Cows that did not complete the milking was automatically re-sorted once back to the waiting area. If the cow were not completely milked despite the resorting, she was directed to a separate waiting area for re-sorted cows. These cows were brought back to the WA by the staff at the end of the milking. Cows that needed any special treatment or had an udder not appropriate for the AMR was set for manual milking and redirected to the waiting area for re-sorted cows.
Exceptions to the routines were made once a week when CMT (California Mastitis Test) and bacteria test were performed. Cows that were new to the system were excluded from the mentioned routines; during the first four consecutive milkings, a complete udder emptying was performed.
4.3 Data collection
4.3.1 Behaviour registrations
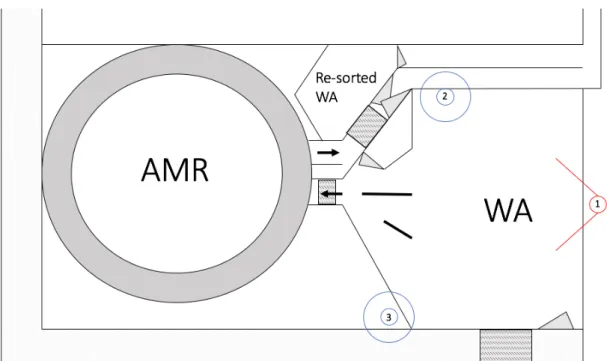
Behaviours were registered by three surveillance cameras. The three cameras were placed overlooking the WA (fig. 4). Two were placed on the sides of the WA (Fisheye view, SAMSUNG SNF-8010VMP) and the third was placed overlooking the WA and the entrance to the WA (regular view, SAMSUNG QNV-7010RP).
Figure 4. The numbers indicate where cameras were located. Number 1 was the regular surveillance
camera and number 2 and 3 were the fisheye cameras. Note that the visual field is not marked on the drawing. All view fields were overlapping.
15 The behaviour registrations were recorded continuously through observations of recorded videos. The behavioural observation started when the first cow entered the WA and ended at staff’s first interaction (approximately 40 minutes after closed gate). The ethogram used for behaviour observations is shown in table 3. The ethogram in table 3 is the same as in the master thesis by Dalemar (2017) with the addition of mounting, attempt to mount and licking. Both the animal performing the behaviour and the animal receiving the behaviour was noted. During each experimental treatment, six milkings were analysed for social behaviours. It was also noted if the behaviour was performed in the backward or forward area of the WA (fig. 3).
Table 3. Ethogram of behaviours and definition used for analysing. Including description of each
behaviour and source of behaviour and the description. Partly modified from Dalemar (2017).
Behaviour Description Author and study
Butting Punch with head on the body of another cow. Usually neck, shoulder or rump. Short time behaviour, less than 1s. If there are several actions during 3s it will be calculated as one interaction.
Dickson et al. (1967), Reinhardt et al. (1978), and Bouissou et al. (2001).
Pushing Pressing body against on another cows’ body and giving a push. Registered if it occurs for a longer time (2s or more).
Rousing and Wemelsfelder (2006).
Displacement When a butt or push from a cow results in a withdrawn from the attacked animal. Registered when a cow flee from the actor cow, or trying to.
Huzzey et al. (2006), and DeVires et al. (2004).
Mounting Raising the anterior part of the body onto the body of
another cow. Hurnik et al. (1995), Reinhardt et al. (1978) and Dahlgren (2013)
Attempt to mount Attempt to mount that not succeeds, e.g. falls of or the receiving animals flees before succeeded mounting.
Hurnik et al. (1995) and Dahlgren (2013).
Licking The tongue is slid over the surface of an object or animal.
Hurnik et al. (1995)
4.3.2 Staff interactions
Staff interactions was analysed from continuous observations of recorded videos, starting from staff’s first interaction to the last cow entering the AMR. The number of animals left at the time for the staffs first interaction and working time was noted. Staffs interactions were observed according to table 4.
Table 4. Definition of the observed interactions performed by staff.
Type of interaction Description
Physical Physically touching the cow. One
interaction is >10 s. Hence, six interactions on the same cow can be observed during one minute.
Body language When the staff by gestures or other non-physical actions affect the cow to move.
16 4.3.3 Milking time registrations
The herd management software DelPro TM (DeLaval International AB, Tumba, Sweden) collected data regarding the gate passages automatically. This information resulted in individual time intervals for each cow and treatment. Three data sets for investigating total walking and
waiting time before milking, time in waiting area and total time for milking were analysed. Total walking and waiting time before milking corresponds to the time from when the cow left
the pen until she entered the AMR. Time in waiting area corresponds to the time from when she entered the WA until she entered the AMR. The time from the cow left the pen until she entered the pen again after milking is referred to as total time for milking.
Two time intervals were retrieved from the videos. These were the total time in the waiting
area for the whole group and total time for labour. Total time in the waiting area for the whole milking is the waiting time for the whole group and was calculated from the first animal entered
the WA in the video recordings until the last animal entered the AMR. The time from staff’s first interaction, after the 40 minutes with no interactions, to the last animal to enter the AMR is referred to as time for labour. It should be noted that this is the whole time interval between first interaction to last animal to enter the AMR, not only the time staff is actively there.
4.4 Statistical analysis
Each cow was grouped according to body weight into three classes of similar size; weight class I <600 kg, weight class II <660 kg and weight class III >660 kg. For each cow, days in lactation (DIM) was calculated as the number of days from calving to the date when each milking was performed. The cows were divided into five DIM classes with a similar number of cows in each; DIM class I <100 days, DIM class II < 150 days, DIM class III < 190 days, DIM class IV <230 and DIM class V >230 days. Regarding the number of calves, the cows were grouped in two classes, either primiparous or multiparous cows.
4.4.1 Behaviour
For analysis of behaviour data as described in table 3, the number of behaviours was registered in Microsoft Excel (2016). The frequency of each behaviour was summarized for each treatment day and group (G1 and G2). The frequency of the behaviours was used to compare treatments and groups (G1 and G2) with a Student’s paired t-test in Excel. Differences between the two groups of cows and treatments are presented as MEAN ± STDEV.
The behaviour registrations in Microsoft Excel (2016) was merged with data of days in milk, number of calvings and body weight. A chi-square test within the FREQ procedure (SAS 9.4, SAS Inst. Inc., Cary, NC, USA) was used to see what characteristics the cow that performed or received a behaviour. The share of cows with a certain characteristic that is performing or receiving a behaviour are presented as percentages. Due to the characteristics of the groups, this was only analysed for G2 where the focal animals where both primi- and multiparous cows.
17 4.4.2 Staff interaction
Registrations of staff interaction were registered in Microsoft Excel (2016). The number of staff interactions was summarized for each treatment and group (G1 and G2). Total staff interaction time was calculated using registered time from Microsoft Excel. The frequency of the interactions as well as the time intervals were used to compare treatments and groups (G1 and
G2) with a Student’s paired t-test in Excel. Differences between the two groups of cows and
treatments are presented as MEAN ± STDEV.
The staff interaction registrations in Microsoft Excel (2016) was merged with data of number of calvings, days in milk and body weight. The cows were divided into three body weight classes and five classes depending on days in milk with close to equal number of cows in each, as in the behaviour analysis. A chi-square test within the FREQ procedure (SAS 9.4, SAS Inst. Inc., Cary, NC, USA) was used to see what characteristics the cow that was left when staffs first interaction was performed and those who needed interactions. The share of cows with a certain characteristic are presented as percentages. Due to the characteristics of the groups, this was only analysed for G2 where the focal animals where both primi- and multiparous cows.
4.4.3 Time intervals
The data from the herd management software DelPro TM was through Microsoft Excel adjusted to fit SAS. The effect of treatment, number of calvings, days in milk and body weight on total walking and waiting time before milking, time in waiting area and total time for milking was tested with a linear mixed model (SAS 9.4, SAS Inst. Inc., Cary, NC, USA). The statistical model included the fixed effects of treatment, group, days in milk, number of calvings and body weight. Interaction effect of treatment × group was used. Solution was used in the model statement to see the effect of the significant results. Data on time intervals are retrieved from individual time intervals for each cow and is presented as LSMEAN ± SE.
4.4.4 Order of entrance
Factors affecting milking order were investigated with proc MIXED and proc CORR in SAS. First, each cow was ranked according to the entrance time; the cow entering the AMR first received a 1 and the second received a 2 and so on. The statistical model included the fixed effects of the number of calvings, days in milk, body weight and milk yield. The same fixed effects were used to test any correlations.
4.4.5 Milk yield
The effect of treatment, group and the interaction effect of treatment × group on milk yield was tested with proc MIXED in SAS. Cow was included as a repeated measure and compound symmetry was added to correct for the date.
18
5
Results
Not all gate passages were registered in DelProTM, which resulted in some time intervals could not be retrieved for each cow. The number of cows registered in each time interval is shown in table 5.
Table 5. Mean number of cows per group registered in each time interval during the studied milkings.
In each group a maximum of approximately 60 cows could have been registered.
Time interval Number of registered cows (mean ± STDEV) Total walking and waiting time before milking 49 ± 9.7
Time in waiting area 49 ± 9.7 Total time for milking 54 ± 7.6
5.1 Behavioural analysis
When all behaviours were considered, more behaviours occurred in the no parallel guiding treatment (NP) compared to the treatment with the parallel guiding (WP) (p=0.04; table 6). All of the specific behaviours (butting, pushing, displacement, mounting, and attempt to mount) occurred more often in NP. However, no significant difference between the treatments was found (table 6). A difference in the number of behaviours was found between treatments for G1 (p=0.03; table 7) and for treatment NP between G1 and G2 (p=0.04; table 7).
Table 6. Mean number of behaviours performed in the two treatments, with (WP) or without parallel
guiding (NP). P-values (t-test) indicating differences between treatments for each behaviour, where *= (p<0.05), ** = (p<0.01), NS = not significant.
Behaviour NP (mean ± STDEV) WP (mean ± STDEV) P-values
All 34.8 ± 12.4 28.2 ± 8.4 * Butting 20.6 ± 5.0 19.5 ± 6.1 NS Pushing 8.8 ± 4.8 6.5 ± 3.1 NS Displacement 2.0 ± 4.0 0.8 ± 1.2 NS Mounting 1.5 ± 2.5 0.8 ± 1.6 NS Attempt to mount 2.2 ± 3.3 0.8 ± 1.6 NS
19
Table 7. Mean number of behaviours performed by the two groups, G1 and G2, in the treatments and
significance levels between different comparisons. Groups compare within and between the no parallel guiding treatment (NP) and with parallel guiding treatment (WP). P-values (t-test) indicating differences between treatments for each behaviour, where *= (p<0.05), ** = (p<0.01), NS = not significant.
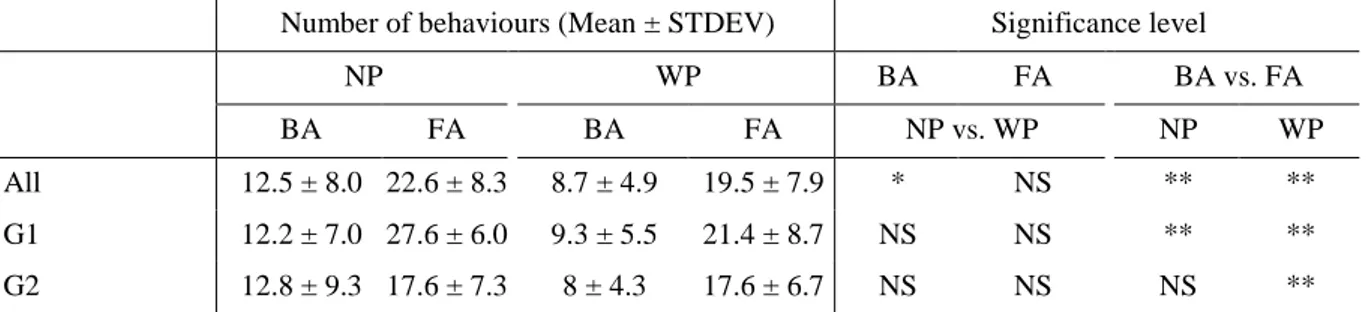
Significant more behaviours were performed in the forward area (FA) compared to the backward area (BA) in both treatments (p<0.01; table 8). Fewer behaviours were performed in BA when WP was compared to NP (8.7 ± 4.9 and 12.5 ± 8.0 respectively, p=0.05; table 8). No difference in the total number of interactions in FA between the treatments. A significant difference between BA and FA was found in nearly all comparisons, the exception was for G2 in NP (p=NS; table 8).
Table 8. Mean number of behaviours performed in backward (BA) or forward (FA) area during the two
treatments, with parallel guiding (WP) or no parallel guiding (NP). P-values (t-test) indicating differences between treatments for each group and treatment, where *= (p<0.05), ** = (p<0.01), NS = not significant.
Number of behaviours (Mean ± STDEV) Significance level
NP WP BA FA BA vs. FA BA FA BA FA NP vs. WP NP WP All 12.5 ± 8.0 22.6 ± 8.3 8.7 ± 4.9 19.5 ± 7.9 * NS ** ** G1 12.2 ± 7.0 27.6 ± 6.0 9.3 ± 5.5 21.4 ± 8.7 NS NS ** ** G2 12.8 ± 9.3 17.6 ± 7.3 8 ± 4.3 17.6 ± 6.7 NS NS NS ** 5.1.1 Focal animals
The animal performing a behaviour was in 40% of the cases in weight class I and 37% of the cases in weight class III. Most performed behaviours were by multiparous cows (58%). Regarding the animals performing a behaviour, the number of behaviours increased with increasing DIM class. The animals in DIM class V were in most cases the animal performing a behaviour (40%), DIM class IV performed 32% of the behaviours, DIM class III 19%, DIM class II 6% and DIM class I 3%.
The animal receiving a behaviour was in most cases primiparous cows (63%), the distribution among the weight classes of animals receiving a behaviour was fairly even; weight class I 30%, weight class II 29% and weight class III 41%. Regarding the animals receiving a behaviour, the
Number of behaviours ( Mean ± STDEV) Significance level
G1 G2 G1 G2 G1 vs. G2 NP WP NP WP NP vs. WP NP WP All 39.8 ± 10.3 30.8 ± 8.5 29.8 ± 12.6 25.6 ± 7.7 * NS * NS Butting 22.2 ± 4.5 20.8 ± 5.9 19.1 ± 5.3 18.1 ± 6.2 NS NS NS NS Pushing 10.7 ± 5.6 6.9 ± 3.1 7.2 ± 2.5 5.8 ± 3.5 NS NS NS NS Displacement 3.0 ± 5.0 0.5 ± 1.2 1.1 ± 2.6 0.9 ± 1.8 NS NS NS NS Mounting 2.1 ± 2.7 0.8 ± 1.4 0.8 ± 2.1 0.9 ± 1.8 NS NS NS NS Attempt to mount 2.5 ± 3 1.3 ± 2.1 1.8 ± 3.6 0.3 ± 0.7 NS NS NS NS
20 number of behaviours increased with increasing DIM class. The animals in DIM class V were in most cases the animal receiving a behaviour (55%), DIM class IV received 19% of the behaviours, DIM class III 10%, DIM class II 9% and DIM class I 7%.
5.2 Analysis of staff interaction
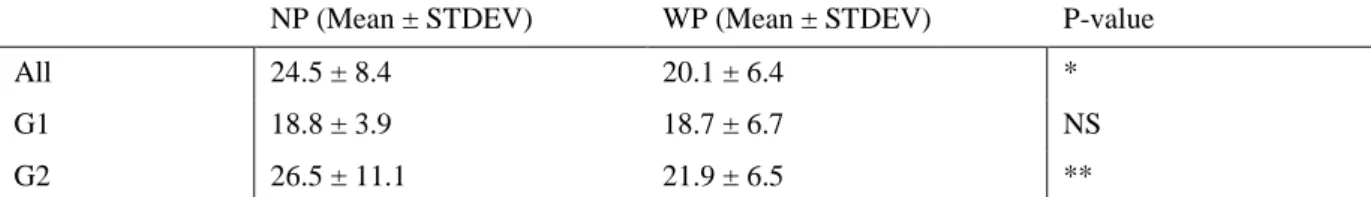
The total time for staff interactions was lower in WP compared to NP when both groups were considered (p=0.04; table 9). No difference was found in G1 regarding total time for staff interaction. Less time was needed in WP compared to NP in G2 (p=0.01; table 9). It was also found that the parallel guiding lowered the total number of interactions needed when both groups (p=0.0002; table 10), as well as only G2 (p=0.008; table 10), was considered.
Table 9. Mean number of minutes from staffs first interaction to last cow entering the milking unit in
the two treatments, with parallel guiding (WP) or no parallel guiding (NP). P-values (t-test) indicating differences between treatments, where *= (p<0.05), ** = (p<0.01), NS = not significant.
NP (Mean ± STDEV) WP (Mean ± STDEV) P-value
All 24.5 ± 8.4 20.1 ± 6.4 *
G1 18.8 ± 3.9 18.7 ± 6.7 NS
G2 26.5 ± 11.1 21.9 ± 6.5 **
Table 10. Mean number of staff interactions performed after labour started in the two treatments, with
parallel guiding (WP) or no parallel guiding (NP). P-values (t-test) indicating differences between treatments, where *= (p<0.05), ** = (p<0.01), NS = not significant.
Interactions NP (Mean ± STDEV) WP (Mean ± STDEV) P-value
All 28.9 ± 10.7 19.9 ± 7.6 **
G1 28.5 ± 13.3 21.3 ± 6.6 NS
G2 29.3 ± 8.0 19.3 ± 8.7 **
The parallel guiding lowered the number of animals left at staffs first interaction in G2 (p=0.04; table 11). Group 2 had more animals left when at staffs first interaction compared to G1 in both NP and WP (p=0.0002 and p=0.05, respectively). Both the time for staff interaction as well as the number of staff interactions were positively correlated with number of animals left at staffs first interaction (r=0.749, p<.0001 and r=0.417, p=0.0032, respectively).
Table 11. Mean number of animals left at staffs first interaction in the two treatments, with parallel
guiding (WP) or no parallel guiding (NP). P-values (t-test) indicating differences between treatments, where *= (p<0.05), ** = (p<0.01), NS = not significant.
NP (Mean ± STDEV) WP (Mean ± STDEV) P-value
All 21.5 ± 7.0 18.6 ± 6.3 NS
G1 16.8 ± 5.2 16.1 ± 5.8 NS
21 5.2.1 Staff interactions per cow
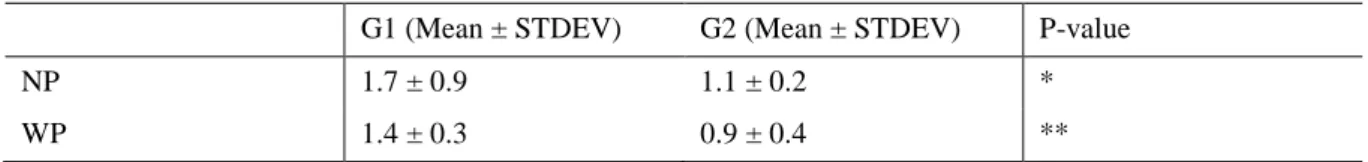
When the number of animals left at staffs first interaction was taken into account regarding the number of staff interactions (table 12) and time (table 13), no differences were found between the treatments. In treatment NP, G2 needed less interactions per cow (IPC) compared to G1 (1.1 ± 0.2 IPC and 1.7 ± 0.9 IPC respectively; p=0.03, table 14). Less IPC was also needed for G2 compared to G1 in treatment WP (0.9 ± 0.4 IPC and 1.4 ± 0.3 IPC respectively; p=0.01, table 14).
Table 12. Mean number of interactions per cow left at staffs first interaction in the two treatments, with
parallel guding (WP) or no parallel guiding (NP). P-values (t-test) indicating differences between treatments, where *= (p<0.05), ** = (p<0.01), NS = not significant.
Group NP (Mean ± STDEV) WP (Mean ± STDEV) P-value
All 1.4 ± 0.7 1.1 ± 0.4 NS
G1 1.7 ± 0.9 1.4 ± 0.3 NS
G2 1.1 ± 0.2 0.9 ± 0.4 NS
Table 13. Mean number of minutes of total time for staff interaction per animal left at staffs first
interaction in the two treatments, with parallel guiding (WP) or no parallel guiding (NP). P-values (t-test) indicating differences between treatments, where *= (p<0.05), ** = (p<0.01), NS = not significant.
Group NP (Mean ± STDEV) WP (Mean ± STDEV) P-value
All 1.2 ± 0.3 1.1 ± 0.3 NS
G1 1.1 ± 0.2 1.2 ± 0.4 NS
G2 1.2 ± 0.3 1.0 ± 0.2 NS
Table 14. Mean number of interactions per cow left at staffs first interaction in the two groups, G1 and G2, in the two treatments with parallel guiding (WP) or no parallel guiding (NP). P-values (t-test)
indicating differences between the groups, where *= (p<0.05), ** = (p<0.01), NS = not significant.
G1 (Mean ± STDEV) G2 (Mean ± STDEV) P-value
NP 1.7 ± 0.9 1.1 ± 0.2 *
WP 1.4 ± 0.3 0.9 ± 0.4 **
5.2.2 Focal animals
The majority, 57%, of the staff interactions regarding the focal animals was performed on first parity cows. Further, 50% of the staff interactions was performed on the heaviest animals, weight class III. Weight class II received the least number of staff interactions (21%) and weight class I received 29%. Regarding the days in milk, it was found that higher DIM class resulted in more staff interactions was received. Cows in DIM class I received 9%, DIM class II 7 %, DIM class III 18%, DIM class IV 30 % and DIM class V received 36%.
22 5.3 Time interval analysis
5.3.1 Time in waiting area
No significant difference was found between NP and WP regarding time in waiting area (32.2 ± 1.7 min and 33.2 ± 1.7 min respectively, p=0.1916) and treatment had no significant effect on the time spent in the WA (p=0.3758). No significant difference between treatments within each group was found, neither was there any significant differences between the two groups, G1 and G2 (33.4 ± 2.2 min and 32 ± 2.2 min respectively, p=0.6193). The time in waiting area for both groups in the two treatments are presented in table 15. No significant differences between combinations of groups or treatments where found. Days in lactation and body weight had a significant effect on the time spent in the WA (p<.0001 and p=0.0330 respectively); increasing number of days in lactation and higher weight resulted in longer periods of time in the WA.
5.3.2 Total walking and waiting time before milking
No significant difference was found between treatments in total walking and waiting time before milking (39 ± 1.7 min and 39 ± 1.8 min respectively, p=0.9484) and treatment had no significant effect on the total walking and waiting time before milking (p=0.3429). No significant difference between treatments within each group was found, neither between G1 and G2 (39.2 ± 2.3 min and 38.9 ± 2.3 min respectively, p=0.9137). The total walking and waiting time before milking for both groups in the two treatments are presented in table 15. No significant differences between combinations of groups or treatments where found. Days in lactation and body weight had a significant effect on the total walking and waiting time before milking (p<.0001 and p=0.0167 respectively), where cows in later lactation and heavier cows had longer waiting times.
5.3.3 Total time for milking
No significant difference was found between treatments, with parallel guiding and no parallel guiding, regarding the total time for milking (63.9 ± 1.6 min compared to 64.9 ± 1.66 min, p=0.2332) and treatment had no significant effect on total time for milking (p=0.1076). No significant difference between treatments in either G1 or G2. Further, no difference between G1 and G2 in total time for milking was found (63 ± 2.2 min and 65.9 ± 2.2 min respectively, p=0.343). The two groups total time for milking in the two treatments are presented in table 15. No significant differences between combinations of groups or treatments where found. Days in milk and body weight had a significant effect on the total time for milking (p=0.0009 and p=0.0091 respectively). Cows later in lactation and heavier cows had longer milking times.
23
Table 15. Least square mean of minutes for the two groups, G1 and G2, in the no parallel guiding treatment (NP) and with parallel guiding treatment (WP) for the three different time intervals; time in waiting area (WA), total walking and waiting time before milking (WT) and time for milking (MT).
Time intervals (LSMEAN ± SE)
NP WP G1 G2 G1 G2 WA 33.8 ± 2.3 32.5 ± 2.3 33.0 ± 2.3 31.5 ± 2.2 WT 39.0 ± 2.4 39 ± 2.4 39.4 ± 2.4 38.6 ± 2.4 MT 62.6 ± 2.3 67.4 ± 2.4 63.4 ± 2.3 64.4 ± 2.4 5.4 Order of entrance
The order of entrance was found to be affected by the body weight (p=0.0183) and milk yield (p<.0001). Cows with a higher milk yield entered the AMR earlier compared to cows with a lower milk yield, and heavier cows entered later compared to lighter cows.
5.5 Milk yield
The milk production differed in both G1 and G2 between the WP and NP treatments (table 16). Overall, the milk production was 0.95 kg higher in the WP treatment (15.24 ± 0.39 kg and 14.29 ± 0.39 kg respectively; p <.0001) and G2 had a higher milk production than G1 (15.62 ± 0.46 kg and 13.91 ± 0.48 kg respectively; p=0.0019)
Table 16. Least square mean and significance level for the number of kilogram milk yield in the two groups G1 and G2 in the two different treatments with parallel guiding (WP) and no parallel guiding (NP). Significance level showing the difference in milk yield between the treatments in each group.
Milk yield (LSMEAN ± SE)
WP NP Significance level
G1 14.24 ± 0.50 13.58 ± 0.49 0.0016
24
6
Discussion
6.1 Behaviour
A significant difference between treatments was found regarding the total number of behaviours. Although not significant, the WP treatment resulted in lower numbers in all the specific behaviours. The reduced total number of behaviours in WP could be a result of the gates separating the cows, and preventing cows from as easily blocking the entrance of the AMR. The significantly higher number of total behaviours in G1 and the fact that G1 had a higher frequency of all behaviours (except mounting in the WP treatment) could be a result of heifers being included in G1 before calving. Regroupings have been found to increase aggressive interaction (Bouissou et al., 2001), especially when dominance relationships are being established (Beilharz & Zeeb, 1982).
Another factor affecting the number and types of behaviours in the study may be the crowd gate. The crowd gate keeps the stocking density in the WA close to constant. Because of this, when the crowd gate is started, little to no space is left for the animals to perform some, or any, behaviours. This was noted during the analysis of the video recordings since the behaviour of mounting, which requires space to be performed, was performed almost exclusively at the beginning of the session when the WA was not filled with animals and the crowd gate had not been started yet. Higher stocking density has been found to increase the frequency of agonistic interactions because of competition for resources (Metz & Mekking, 1984; Fregonesi & Leaver, 2002). However, one may argue that this is only applicable until a point where the available space is too small for agonistic behaviours to be performed. Hence, the crowd gate may have had an impact on lowering the number of behaviours in the study. More behaviours were performed in the forward area compared to the backward area. This was expected and most likely a result of the crowd gate pushing the animals forward, leaving less time and space for the animals to perform behaviours in the backward area.
The results of the present study show that multiparous cows performed behaviours on primiparous cows, hence, older cows performed behaviours on younger cows. This support the findings that parity number as well as age are correlated to dominance value and social rank (Philips and Rind 2002 And O´Connell 1989), since the number of initiated aggressive interactions and dominance value has been found to be positively correlated (Collis, 1976). The present study did also find that cows later in lactation performed more behaviours. This support the findings of Ketelaar-de Lauwere et al., (1996) that social rank and days in milk are positively correlated.
Further, several authors have found social rank to be correlated to live weight (Wagnon et al 1966; Dickson et al 1967; Bouissou 1972; Philips and Rind 2002). But the results of the present study regarding the focal animals are contradictory since the animals in weight class I, the lightest animals, was the performing animal in 40% of the behaviours. Although, the heaviest cows, weight class III, was the animal performing a behaviour in almost as many cases (37%). A reason for the high number of light weight cows performing a behaviour could be that the
25 animals were at different stages of gestation. Cows later in gestation may avoid such interactions with other cows.
6.2 Staff interaction
The parallel guiding lowered both the total staff interaction time and the number of staff interactions needed in total. This is positive for the farmer since the cost of labour is the largest cost in dairy production (Gustavsson, 2009). The parallel guiding did also lower the number of animals left at staffs first interaction (21.7 ± 6.8 cows resp. 18.6 ± 6.3 cows) but the difference was not significant. However, the fact that fewer animals where left at staffs first interaction as parallel guiding was practised indicate that the treatment results in a lower need of fetching cows. Since fetching of cows requires more labour it results in economic losses (Drach et al., 2017). The parallel guiding could because of this be of interest when reduced labour is desired.
No difference between the treatments was found regarding time for total staff interactions in G1. On the other hand, the WP treatment did have a lower total staff interaction time compared to the NP treatment in G2. The same was found regarding the number of staff interactions. No difference between treatments in G1 but lower number of staff interactions needed in WP compared to NP in G2. Hence, the parallel guiding did have a bigger positive effect on G2, which consisted of both primi- and multiparous cows. This may indicate that groups where primi- and multiparous cows are mixed receive most benefits from the use of the parallel guiding.
The majority of the staff interactions was performed on first parity cows. A reason for this could be that most of these were new to the system since it has been found that one of the top three reasons for fetching is that the cow is new to the system (Rodenburg & House, 2007). As well as it has been found that the voluntarily entering is increasing as days in lactation increases (Jacobs & Siegford, 2012b), which could be interpreted as cows learn to use a system. Another reason may be that they are subordinate animals and therefore not likely to get access to the AMR as fast as the dominant animals. The majority of staff interactions where also performed on cows in weight class III (50%). This contradictory result, that the majority of staff interaction where performed on the primiparous cows as well as the heaviest cows may be explained by the primiparous cows not being the lightest animals despite them probably being the youngest. It was also found that the number of staff interactions increased as days in milk increased. This may be explained by the milk yield decreasing in the mid and late lactation (Sjaastad et al., 2010) and therefore maybe also the motivation to be milked.
Working safety
The Swedish work environment regulations on animal work stipulate that the work environment should be dimensioned and maintained to offer a safe work environment, as well as it should offer escape routes for the farmer (ASF 2008:17). In a study by Lindahl et al. (2012) the farmers mentioned horizontal rails as an important factor in making the facility safer, since it offers escape routes for the farmer. The railings in the present study had vertical rails. This type of railing increases the risk for the staff to get crushed or stuck between a cow and the railing. An