TIMBRO
SHARING
ECONOMY
Academic conferences for economists tend to be thoroughly civilized
events. Yet a year ago, I listened to two professors get into an
unusually heated argument on stage. “It’s just the economy, stupid,”
one of them cried, paraphrasing Bill Clinton’s advisor. “But it’s not!” the
other barked. “Only an idiot can be blind to the disruptive force of the
sharing economy. This time it’s different!”
This report might not bring an end to public or academic discussions on the nature, force and purpose of the sharing economy, but it can make them more constructive by formulating a clear, operationalizable definition of what the sharing economy is. Moreover, it provides a unique insight into what actually drives the development of peer-to-peer services, while teasing out some of the most important drivers of capitalism itself. Perhaps most important is however to provide a resource for the research community at large to help enhance our understanding of the sharing economy.
The global index — the very first of its kind — tests a number of hypotheses on the correlation between the development of the sharing economy and the regulatory context. Are these services hampered or propelled by high levels of government intervention in the economy? Can the sharing
economy help alleviate a lack of general social trust, which is a significant obstacle to all eco-nomic activity? Or do activities of this kind require a public that generally thinks well of strangers in order to gain ground in the first place?
For Timbro, founded in 1978 and the largest free market think tank in the Nordic countries today, these are vital questions to explore. Political responses have varied, but in many countries there have been moves to ban, prohibit or inhibit the growth of the sharing economy. Companies like Uber and Airbnb have become symbols for a gig economy that labor unions abhor, while providing tough competition to incumbent interests whose business models are based on complying with regulations that do not – and often should not – apply to newcomers.
At the end of the day, the sharing economy places politically existential issues on the table.
Foreword
Are there other ways of providing consumer protection than by lawmaking? What hap-pens when the distinction between employee and service provider is increasingly muddled? Will capitalism itself change if digitized busi-ness models push down transaction costs to levels that eventually challenge the notion of the firm itself?
An outstanding team of researchers has produced this report. Head researcher Alexander Funcke is a postdoctoral fellow in the Philosophy, Politics and Economics program at the University of Pennsylvania. His research examines the underpinnings and dynamics of social coordination, and social norms in particular. Andreas Bergh is Associate Professor in Economics at Lund University and at the Research Institute of Industrial Economics in Stockholm. His research focuses on the welfare state, institutions, develop-ment, globalization, trust and social norms.
Joakim Wernberg is research director of the megatrends program at the Swedish Entrepreneurship Forum. He has a back-ground in engineering physics and holds a Ph.D. in economic geography from Lund University. His primary research interests are complex systems and the interaction between technological and economic development. The contributors Kate Dildy and Gylfi Ólafsson have provided the team with invaluable support throughout the process of finalizing the Timbro Sharing Economy Index. We are greatly indebted to them for their efforts and hard work.
Karin Svanborg-Sjövall CEO, Timbro
The Timbro Sharing Economy Index is the first global index of the
sharing economy. The index has been compiled using traffic volume
data and scraped data, and provides a unique insight into the driving
factors behind the peer-to-peer economy.
4,651 service candidates worldwide were considered, 286 of which were classified as sharing economy services.
Monthly traffic data was collected for the services in 213 countries. 23 of the services also received a complete count of its active suppliers using automated “web scraping” techniques.
Previous cross-country studies we have seen have employed surveys or self-reported indicators. Given the many different
colloquial notions of what the sharing economy is, these studies are inheriently fuzzy about what they actually measure. To overcome this problem, we developed a definition of the sharing economy that allows for an exact classification of the services. The definition, thereby, enables us to know that the data we collected is concerned with a now well-defined concept, the sharing economy.
Comments and questions are welcome and should be addressed to:
Executive
Summary
Karin Svanborg-Sjövall CEO, Timbro Email: karin.svanborg.sjovall@timbro.se Telephone: +46-725-170077 Twitter: @KarinSjvaAlexander Funcke, Head Researcher TSEI Postdoctoral fellow, University of Pennsylvania Email: funcke@sas.upenn.edu
Telephone: +1-347-781-8303 Twitter: @funcke
Iceland, the Turks and Caicos Islands, Montenegro, Malta and New Zealand top the list. Generally, countries with a mature Internet infrastructure and a tourism- fueled economy have large sharing economies. The report takes a more in-depth look at the curious case of Iceland. As the traditional Icelandic economy was recovering from economic turmoil, the country saw a spike in tourism. The sharing economy grew rapidly to meet the demand in a way that is hard to imagine in a traditional tourist industry.
→ The largest company in our data set is Airbnb, with almost 1.5 million suppliers judged as active in an average week. Of the 286 companies classified as sharing economy services, one third supply housing and one half fall into the broad category of business services.
→ We find that the same economic
freedom indicators that predict a large traditional economy are also significant predictors for the size of the sharing economy (controlling for GDP per capita and Internet speed). This goes against the hypothesis that the sharing economy mainly serves to avoid regulations. If this hypothesis were correct, we would expect a larger sharing economy in areas where providers have more regulations.
→ We also find that the sharing economy does not correlate with society-wide measures of trust once we control for share with broadband. The loss of significance may be due to the fact that sharing economy services often help bridging a lack of trust between trading parties, thus contradicting the hypothesis that the sharing economy in contrast to the economy at large, relies on well-established interpersonal relations of trust.
→ One significant caveat with regard to the index is that it typically under- estimates app-centric services. This affects ride-sharing service contribu-tions in particular. Most notably, services such as Uber and Lyft do not impact the rankings to the degree that otherwise could be expected. This may explain why, for example, a country such as Denmark ranks surprisingly high, despite having banned ride-sharing services.
Founded in 1978, Timbro is the largest free market think tank in the Nor-dics. Its mission is to build opinion in favor of free entrepreneurship, indi-vidual freedom and an open society by publishing works from classic liberal thinkers, making policy recommendations and organizing educational youth programs.
Timbro is part of the European think tank network Epicenter and has close contact with the Atlas Network in the United States.
Each year Timbro publishes two indices in English: Timbro’s Populist Index, which maps the rise of populist parties in Europe, and beginning in 2018, the
Timbro Sharing Economy Index.
→ www.timbro.se
→ www.facebook.com/tankesmedjantimbro
→ www.instagram.com/tankesmedjan_timbro
→ www.twitter.com/timbro
The following think-tanks are collaborating on the launch of the index: Americans for Tax Reform (US), Australian Taxpayers’ Alliance (Australia), CAAS (Serbia), Center for Indonesian Policy Studies (Indonesia), IDEAS (Costa Rica), IDEAS (Malaysia) and Institute for Market Economics (IME) (Bulgaria).
About
Timbro
Partnering
Organizations
The scraped data has been collected by Zeta Delta OÜ using low- intensity automatic web-scraping techniques similar to the ones used by search engines, such as Google, to index web pages. All legal responsibility for the data collection is assumed by Zeta Delta OÜ.
1. Global Overall Ranking
8
2. Making Sense of the Sharing Economy
14
3. Defining the Sharing Economy
18
4. Measuring the Sharing Economy
24
5. The Sharing Economy and Free Markets
32
6. The Sharing Economy and Trust
36
7. Making the Sharing Economy Thrive?
38
8. Research Team
40
Appendix A Services that were studied in detail
42
Appendix B Categories table
42
Global
overall
ranking
IRELAND
TSEI 41 TURKS AND CAICOS ISLANDS TSEI 66.902
TSEI 10001
FAROE
ISLANDS
TSEI 49.307
BERMUDA
TSEI 34.312
DENMARK
TSEI 45.908
CURAÇAO
TSEI 32.313
ARUBA
TSEI 43.109
MONACO
TSEI 32.214
10
BARBADOS
TSEI 29.415
AUSTRALIA
TSEI 26.217
PORTUGAL
TSEI 25.618
FRANCE
TSEI 25.119
DOMINICA
TSEI 25.120
UNITED STATES VIRGIN ISLANDS TSEI 40.811
NORWAY
TSEI 2916
MALTA
TSEI 58.203
MONTE-
NEGRO
TSEI 5804
NEW
ZEALAND
TSEI 52.805
CROATIA
TSEI 52.206
ICELAND
COUNTRY Iceland
Turks and Caicos Islands Malta Montenegro New Zealand Croatia Faroe Islands Denmark Aruba Ireland
United States Virgin Islands Bermuda Curaçao Monaco Barbados Norway Australia Portugal France Dominica Seychelles Andorra Spain Greece Cuba Italy
United Kingdom of Great Britain and Northern Ireland Georgia Cayman Islands Bahamas Cyprus Saint Lucia Canada Isle of Man Switzerland Grenada French Polynesia Netherlands Estonia Palau New Caledonia Sweden
Antigua and Barbuda Israel Finland Greenland Uruguay Mauritius Belize Chile Gibraltar
Saint Vincent and the Grenadines United States of America Belgium
Northern Mariana Islands Maldives Liechtenstein Latvia Jamaica San Marino Hungary Cabo Verde Bulgaria
Bosnia and Herzegovina Singapore
Saint Kitts and Nevis
The former Yugoslav Republic of Macedonia South Africa Malaysia Guam Serbia Vanuatu Fiji Brazil
China, Hong Kong Special Administrative Region Armenia Germany Sri Lanka Albania Tonga Dominican Republic Mexico
Trinidad and Tobago Argentina
United Arab Emirates Morocco Suriname Romania Thailand Republic of Korea Japan Poland Nicaragua Turkey Ecuador Samoa Tunisia Mongolia Brunei Darussalam Saudi Arabia
China, Macao Special Administrative Region Lebanon Philippines INDEX 100 66.9 58.2 58.0 52.8 52.2 49.3 45.9 43.1 41.0 40.8 34.3 32.3 32.2 29.4 29.0 26.2 25.6 25.1 25.1 25.0 23.6 22.7 22.5 21.4 21.2 20.5 20.3 20.3 18.9 18.8 18.6 16.6 16.3 16.0 15.4 15.1 14.6 14.0 13.8 13.6 13.4 13.4 13.1 12.5 12.1 11.7 11.3 11.0 9.8 9.6 9.5 9.5 9.4 8.5 7.8 7.4 6.9 6.9 6.7 6.5 6.2 6.1 5.7 5.6 5.6 4.7 4.7 4.4 4.2 4.2 4.1 4.0 4.0 3.9 3.7 3.4 3.4 3.3 3.2 3.0 3.0 3.0 2.9 2.6 2.5 2.4 2.4 2.4 1.9 1.9 1.8 1.8 1.8 1.8 1.7 1.6 1.6 1.5 1.4 1.4 1.4 1.3
GLOBAL OVERALL RANKING
# 1 2 3 4 5 6 7 8 9 10 11 12 13 14 15 16 17 18 19 20 21 22 23 24 25 26 27 28 29 30 31 32 33 34 35 36 37 38 39 40 41 42 43 44 45 46 47 48 49 50 51 52 53 54 55 56 57 58 59 60 61 62 63 64 65 66 67 68 69 70 71 72 73 74 75 76 77 78 79 80 81 82 83 84 85 86 87 88 89 90 91 92 93 94 95 96 97 98 99 100 101 102 103
Sao Tome and Principe Russian Federation American Samoa Kenya Lithuania Guatemala Puerto Rico Republic of Moldova Botswana State of Palestine Cambodia Austria Vietnam Panama Jordan Tuvalu Kazakhstan Senegal Costa Rica Somalia Nauru Azerbaijan El Salvador Kyrgyzstan Bhutan Ukraine
United Republic of Tanzania Egypt Czechia Gambia Indonesia Gabon Guyana Qatar Oman Nepal Slovenia Honduras Paraguay Peru Swaziland Colombia Marshall Islands Bahrain Libya
Iran (Islamic Republic of) China
South Sudan
Bolivia (Plurinational State of) Zimbabwe
Ethiopia
British Virgin Islands Zambia
Ghana
Micronesia (Federated States of)
Uganda Algeria
Lao People’s Democratic Republic Djibouti Yemen Belarus Mauritania Rwanda Haiti Angola Solomon Islands Kiribati Côte d’Ivoire Madagascar India Togo Timor-Leste Lesotho Slovakia Mozambique Cameroon Benin Turkmenistan Mali
Venezuela (Bolivarian Republic of) Sudan Kuwait Tajikistan Congo Burkina Faso Iraq Malawi
Syrian Arab Republic Sierra Leone Myanmar Comoros Liberia Chad
Papua New Guinea
Democratic Republic of the Congo Niger
Nigeria Guinea-Bissau Uzbekistan Guinea
Central African Republic Pakistan
Afghanistan Bangladesh Equatorial Guinea Burundi
Democratic People’s Republic of Korea Luxembourg
Saint Martin (French Part) Eritrea 9.5 9.5 9.4 8.5 7.8 7.4 6.9 6.9 6.7 6.5 6.2 6.1 5.7 5.6 5.6 4.7 4.7 4.4 4.2 4.2 4.1 4.0 4.0 3.9 3.7 3.4 3.4 3.3 3.2 3.0 3.0 3.0 2.9 2.6 2.5 2.4 2.4 2.4 1.9 1.9 1.8 1.8 1.8 1.8 1.7 1.6 1.6 1.5 1.4 1.4 1.4 1.3 1.3 1.2 1.2 1.2 1.2 1.1 1.0 1.0 1.0 0.9 0.9 0.9 0.8 0.8 0.8 0.8 0.7 0.7 0.7 0.7 0.7 0.7 0.6 0.6 0.6 0.6 0.6 0.6 0.6 0.6 0.6 0.6 0.5 0.5 0.5 0.5 0.5 0.5 0.4 0.4 0.4 0.3 0.3 0.3 0.3 0.3 0.3 0.3 0.3 0.3 0.3 0.3 0.3 0.3 0.2 0.2 0.2 0.2 0.2 0.2 0.2 0.2 0.2 0.2 0.2 0.2 0.2 0.2 0.1 0.1 0.1 0.1 0.1 0.1 0.1 0.1 0.1 0.1 0.1 0.1 0.1 0.1 0.1 0.1 0.1 0.1 0.1 0.1 0.1 0.0 0.0 0.0 0.0 0.0 0.0 0.0 0.0 0.0 0.0 0.0 0.0 0.0 0.0 0.0 0.0 0.0 0.0 0.0 0.0 0.0 104 105 106 107 108 109 110 111 112 113 114 115 116 117 118 119 120 121 122 123 124 125 126 127 128 129 130 131 132 133 134 135 136 137 138 139 140 141 142 143 144 145 146 147 148 149 150 151 152 153 154 155 156 157 158 159 160 161 162 163 164 165 166 167 168 169 170 171 172 173 174 175 176 177 178 179 180 181 182 183 184 185 186 187 188 189 190 191 192 193 194 195 196 197 198 199 200 201 202 203 204 205 206 207 208 209 210 211 212 213
I
celand tops the list of the size of the sharing economy. Aside from the absence of Uber, Iceland is a country where the sharing economy, and especially Airbnb, has been of remarkable importance for the tourist-fueled economic recovery. Iceland is a well-developed country with a high level of Internet connectivity, rapid adoption of new technologies, a high level of education, high social trust and a high GDP.The
curious
case
of
After Iceland’s financial crisis of 2008, however, the country’s GDP fell considerably and unemployment rose quickly. At the same time, the exchange rate fell sharply, making Iceland an attractive tourist destination. At least two other factors contributed to the meteoric rise of Iceland’s tourism: the Eyjafjallajökull volcano eruption of 2010, which garnered a high degree of international publicity, and the Arab Spring, after which travel to some previously popular destinations was considered unsafe.
The rise in tourism strained the small tourism industry. In particular, the supply of accommo-dation could not keep up with the increase. The excess demand was quickly absorbed by individ-uals who, primarily through Airbnb, but also to a lesser extent through other platforms, provided accommodation. During this period, the GDP rose quickly, unemployment fell, apartment prices in downtown Reykjavík rose and the hotel sector started building more in order to increase capacity. In some neighborhoods, the increased demand drove average families out, affecting even the number of children in preschools and primary schools.
The regulatory framework for home accom-modation needed to be revised, and clear signs of tax evasion could be seen. Like other Western welfare states, the tax wedge in Iceland is quite high, making tax evasion attractive.
Hotel construction is now catching up and tax authorities are getting a tighter grip on the sharing economy. Although the exorbitant growth rates of previous years are not likely to be repeated, there are no signs of a reversal of this trend. Without a doubt, the flexibility of the sharing economy has helped the Icelandic economy to absorb the quick rise in demand and thus con-tribute the lion’s share of the economic recovery. The extent to which the sharing economy conforms to the idea of individuals making use of spare capacity is, however, another question. The vast majority of properties are whole apart-ments, while renting out a spare room is less common. Also, around 60% of revenue is asso-ciated with so-called multi-listers (hosts with more than one property available on Airbnb).
Making Sense of the
Sharing Economy
The notion of a rising sharing economy powered by
digitization caught on sometime during the second half of
the 2000’s. Since then it has has become a global
phenomenon spanning a wide range of different sharing
services across several sectors of the economy, provided
by multinational firms as well as small local actors.
In the most comprehensive study to measure activity in Europe, PricewaterhouseCooper researchers Vaughan and Daverio (2016) estimated, using survey data from consumers and businesses, that the number of collab-orative platforms in Europe in 2015 was over 275, with transactions worth over 28 billion euros. Sharing as such is not new, nor are decentralized peer-to-peer exchanges. In fact, sharing in the form of bartering has a long history. It was more common before mass production, large-scale distribution and large firms were introduced in the wake of the industrial revolution. New to the contemporary sharing economy are large-scale sharing activities between strangers that transcend established social networks and local communities. We still lack, how-ever, a commonly accepted definition of what the sharing economy actually is.
Some would argue that this vagueness follows from a rising interest in the sharing economy along with a pos-itive connotation which, while making it an attractive club to belong to, stretches its meaning considerably. In some sense, this holds true for small firms that rent out apartments via Airbnb or rental car firms that use an app to match the location of cars to customers. Many would-be sharing economy services are re-lawould-beled as platform economies or gig economies, in which spare time is utilized to provide services (Felländer et al., 2015). Alter- natively, the sharing economy can be said to capture another step in digitization that spans most, if not all, parts of our society.
The combination of computational power and digital networks constitutes a new general purpose technology that is being integrated across the economy and utilized in
a wide variety of ways. Against this backdrop, the sharing economy does not specify a certain type of business model or sharing activity. Rather, it describes new types of interactions and exchanges made possible by reduced transaction costs and improved matching between supply and demand. It might be argued that this is better described as a general platform economy. However, when the exchanges are restricted to the utilization of peo-ple’s property and time on a case-by-case basis, it is best described as a sharing economy. Thus, the sharing eco- nomy may be thought of as a subset of platform economies, while the so-called gig economy constitutes a subset of the sharing economy.
These two lines of argument — the narrow and the wide scope — reveal two surprisingly different basic assumptions about the activity of sharing. The first defines sharing based on the intent of the supplying party, while the second defines sharing based on the ability for
demand-side parties to utilize a decentralized supply. At first glance, this may seem like splitting hairs, but it turns out to have important implications for how we describe and think about the sharing economy.
With the assumption about supply-side intent, the sharing economy is restricted to “consumers granting each other temporary access to underutilized physical assets (’idle capacity’), possibly for money” (Frenken et al., 2015). In other words, paying for a seat in a car that was already going to drive between points A and B is part of the sharing economy, while hailing an Uber to travel the same route is not, since the Uber driver was not planning to make that specific trip (Frenken and Schor, 2017). Similarly, if a person buys a summer house with the intent to rent it out five weeks every summer via Airbnb,
this would not be considered part of the sharing econo-my. There are two problems with this description. First, it requires the observer to know or be able to determine the intent of the supplying side, in order to eliminate from the data anyone who, for example, owns a summer house for the sole purpose of renting it out. Second, and more importantly, this narrow description aims to exclude a wide range of activities that follow the same economic incentives and draw on the same technological develop-ment but do not match the narrow constraint on moral intent. This means not only that the sharing economy is defined primarily by its moral ideals, but also that sharing-similar behavior falls somewhere between the traditional platform economy and sharing economy.
The assumption about demand-side ability, on the other hand, focuses on access to decentralized supply so that a private vehicle can turn into a de facto taxi on a ride-to-ride basis, just as a private summer house can become a temporary hotel on a stay-to-stay basis, regardless of how the car or summer house would other-wise have been utilized. This approach to the sharing economy is less apt to describe people’s moral inclination to share, but better geared towards describing the aggregated effects of people being able to share parts of the capacity of their property and also their time. If capacity, measured in the utilization of physical goods or people’s time, can be utilized in smaller packets, this means not only that previously unattainable idle capacity can be mobilized, but also that the total capacity can be allocated in new ways. This in turn allows for assets and skills to be used at aggregate levels closer to their capacity, yet it also blurs the line between different forms of work (Sundararajan, 2016).
These differences also seem to carry over to a large extent to the political interpretation of the sharing econ-omy. On one hand, there are those who frame the sharing economy as a reaction against capitalism and an expression of anti-consumerism or collaborative consumption, as
The so called gig economy constitutes
a subset of the sharing economy.
opposed to hyperconsumption (Botsman and Rogers, 2011; Heinrichs, 2013). These focus primarily on the social values associated with sharing resources. On the other hand, there are also definitions that frame the sharing economy as a largely market-based extension of capitalism and market economies. Put differently, people are able, thanks to new technologies, to engage in exchanges that make more efficient use of their property and overall resources, regardless of whether the exchanges are commercial or not (Sundararajan, 2016). This description is focused on opportunities made possible by new technologies. While the former description is focused on the value of a “social movement centered on genuine practices of sharing and cooperation in the production and consumption of goods and services” (Schor et al., 2014) and excludes capitalistic motivations, the latter may actually include both. If we think of the sharing economy as exchanges between people made possible by reduced transaction costs and improved matching between supply and demand, it only makes sense that the result would be a hybrid between market-based exchange and social motivations (Lessig, 2008).
Interestingly, a rising critique against the wider demand-side ability and technology-oriented defini-tion seems to be that it is too technology-normative or technology-optimistic. That is, this approach and the implications that follow from it do not sufficiently take into account how the new technologies may impact people and our society with respect to, for instance, labor market regulations, unionization or social security. This type of critique is often voiced by incumbent businesses, but we have also encountered it from proponents of a supply-side intent-oriented sharing economy during our work on this report. It is noteworthy that the opposite argument, i.e. that any new economic activity that competes with or complements existing businesses should be constrained by the same regulations regardless of how well they fit, is actually regulation-normative. In other words, existing regulations are assumed to be suitable (and necessary) regardless of the output of technological development
and innovation.
Neither approach taken to its extreme is very infor- mative in the long run, since the outcome of each depends at least partly on interactions with the other (Elert et al., 2016). For instance, with respect to reliability, restrictions on who is allowed to drive a taxi were at least to some degree made redundant with the introduction of GPS, since the knowledge needed to navigate in a city was essentially externalized.
Arguably, there might still be concerns about the level of trust needed to ride with a stranger, but the growing range of ride-hailing apps suggests that such issues may also be overcome without requiring drivers to pay for a certain license or medallion. A study on data from the carpooling company blablacar suggests that the sharing economy may be introducing a new form of trust infrastructure that could render obsolete some regulations aimed at promoting trust (Mazzella et al., 2016). Their results indicate that 88 percent of the respondents rated their trust in a blablacar driver they have never met higher than trust in their co-workers or neighbors (though still lower than trust in family and friends). Conversely, sharing economy companies such as Uber and Airbnb have had to adapt to some common denominators of regulatory frameworks and existing institutions in order to be able to scale up their business across economies.
In this report, we take the wider demand-side ability and technology driven approach to the sharing economy. Aside from the discussion above, there are two main reasons for this. First, this interpretation allows for the inclusion of a wider variety of activities that, taken together, constitute a pattern, rather than selected parts of that pattern. Second, focusing on this wider pattern makes it easier to relate it to overall economic conditions and to make comparisons between countries.
A conceptual
definition
of the
sharing economy
W
e start out by building on a set of definitions provided in an overview by Sundararajan (2016), including Botsman and Rogers (2011), Stephany (2015), Gansky (2010) and Benkler (2004). We identify three common denominators that cover a sig-nificant portion of the variation between these different definitions: (1) excess capacity, (2) large digital networks and (3) trust between strangers (Bergh and Funcke, 2016). The definitions, divided into three categories corresponding to the common factors, are presented in Table 3.1. These common denominators also match stricter definitions that constrain in various ways the type of sharing activities included (Frenken and Schor, 2017; Hamari et al., 2015). A lot of recent research on the sharing economy highlightsreasons for individuals to participate and the impact of specific firms on incumbent businesses, but such considerations are not taken into account here (Zervas et al., 2013; Olson and Connor, 2013).
Two factors from Sundararajan’s definition (2016) are left out: blurred boundaries between different forms of employment and between the personal and the professional realm. These refer more to the impact of the sharing economy than its basic characteristics. Accordingly, they are labeled consequential factors in Table 3.1. For a more extensive description, see Bergh and Funcke (2016).
VARIABLES Common factors Excess capacity
Large decentralized Networks
Trust between strangers Consequential factors SUNDURARAJAN (2016) Sharing economy/ crowd-based capitalism High-impact capital Largely market-based Crowd-based networks Blurring personal/ professional Blurring fully employed/
casual labor
BOTSMAN & ROGERS (2010) Collaborative consumption Idling capacity Critical mass Belief in commons Trust in strangers STEPHANY (2015) Sharing economy Value Underutilized assets Reduced ownership Online accessibility Community GANSKY (2010) The Mesh Shareability Immediacy Digital networks Global in scale and potential Advertising replaced by social promotions
Table 3.1: Sharing economy definitions.
BENKLER (2004) Sharing as a modality of economic production Lumpy mid-grained goods Distributed computing Population-scale digital networks Trust reduces transaction costs
Excess capacity refers to the mobilization on a case-by-case basis of resources and time distributed among many people rather than being supplied by a centralized stock. Benkler (2001) describes many physical goods as “lumpy” and “mid-grained,” meaning their capacity supersedes their owners’ needs in terms of both maximum capaci-ty (lumpiness) and utilization over time (granularicapaci-ty). Benkler uses car seats and processor capacity as examples of resources that are seldom maximally employed by their owners. This is very similar to what in the other defini-tions in Table 3.1 is referred to as idling capacity, the value of underutilized assets and shareability. The same argu-ment can be made for an individual’s time and human capital beyond what is already being utilized by work and other activities (Sundararajan, 2016). Note, however, that none of the definitions (including our own) include trans-actions that involve the transferal of ownership between peers, i.e. second-hand markets.
Drawing on Benkler’s use of the term granularity, we can describe the sharing economy as arising from the ability to detect and utilize or share excess capacity on a much finer level of granularity. In other words, people are able to realize a greater share of the value of their property and time, regardless of whether they share it out of generosity or for profit. Some recent policy-oriented re-ports describe sharing economy services as primarily peer-to-peer operations of micro-capitalism and temporary usage or shared access, in which individuals supply access to goods or services temporarily and without a binding contract across several transactions (European Commis-sion, 2016; Wosskow, 2014).
Other important criteria for assessing goods and services that are mentioned in government reports include ownership of goods and assets, the level of contractual terms and conditions, and the degree to which prices are set by the platforms.
As mentioned previously, this does not only apply to existing excess capacity, but may also change the overall allocation of capacity. First, people may acquire new capacity and share most or all of it. For example, people who otherwise would not be able to afford a second home may be able to buy one because they can monetize a greater share of the excess capacity that arises when they do not use it. Furthermore, people may invest in extra capacity and rent it out as a pure investment. Similarly, a person may choose to enlist as a driver for a ride-hailing app in his or her spare time and may also choose to go from being a full-time to part-time employee in order to spend more time as a driver. In
summary, the ability to uti-lize people’s property and time at a finer granularity enables a more efficient aggregated use of resources within the economy, but the improved efficiency will be derived from both topping off existing excess capacity and re-allocating overall capacity.
Since both supply and demand are made available on a case-by-case basis and conse-quently are restricted in both time and space, it is important that the supply is large and varied enough to match the demand at any point in time. This is what Gansky (2010) describes as the need for immediacy and it is met by what Botsman and Rogers (2011) refer to as critical mass. Historically, sharing of excess capacity was restricted to existing social networks and local communities, which in turn would limit what could be reliably accessed through
At the heart of the sharing economy
lies the ability to match supply and
demand of excess capcity between
strangers.
sharing and how well demand was matched by supply. At the heart of the sharing economy lies the ability to match supply and demand of excess capacity between strangers. This is made possible by large digital networks — global in scale and potential (Gansky, 2010) or popu-lation-scale (Benkler, 2004 ). The size and geographical reach of networks today, as well as the speed of commu-nication, is in fact unprecedented. Digital connectivity does not only improve the efficiency of the market by increasing the size of the network; it also enables sharing of goods and services that would not have been able to gain critical mass in a smaller community with slower communication.
As the network grows and sharing occurs between strangers, the incentives to participate may also shift. In a local community, social capital may suffice to borrow a lawnmower, but on a larger scale other types of incentives
may become important. For example, either social values related to community-building or monetary gains (or a mix of both) are likely to play an important role in securing the supply of excess capacity to share. Along this vein, Sundararajan (2016) describes the sharing economy as “crowd-based capitalism”.
Digital networks may make it possible to match supply and demand between strangers, but it will also require a sufficient level of trust to realize stranger sharing on a larger scale. This is the third and final common de-nominator from Table 3.1.
While connectivity is abundant in digital networks, trust is limited. In response to this, many sharing economy service providers offer some form of trust infrastructure (Mazzella et al., 2016) aimed at aggregating and quantifying reviews from past transactions. In doing so, private trust is externalized and turned into a public resource for the crowd. Gansky (2010) argues that excess capacity is made detectable through digital networks, and reputations and trust are also becoming quantifiable and detectable in a way that is at least partly independent of existing social ties.
Furthermore, it is important to note that trust goes beyond ratings. Trust in strangers is connected to the trust people place in the trust infrastructure itself. This depends both on the quality of reviews and the remaining setup of the sharing activity. For instance, in the case of a ride-hailing service it helps if the potential rider knows that beyond the rating of the driver the app also tracks the entire journey and handles the payment.
In summary, three common denominators — excess capacity in goods and/or time, large digital networks and trust between strangers — are consistent across several types of definitions of the sharing economy, notably also those that differentiate between for-profit and non-profit motivations.
An operational
definition of
sharing economy
services
I
n general, sharing economy services can be said to reduce transaction costs, ease market frictions and redistribute risk to supplying and demanding peers by facilitating transactions that either make use of underutilized capacity, or that would not otherwise have existed. Against this back-drop, we now move to find an operational definition of sharing economy services and sharing economy service providers. To do this, we have made the following three assumptions about how the conceptual definition is translated into operational descriptions of sharing economy services.DEFINITION 1:
A sharing economy service (SES) is a platform that facilitates agreements between identifiable suppliers of marketable services and identifiable customers demanding said services. The transaction may not in-volve any transfer of ownership and is conducted on a case-by-case basis, where neither party is bound to engage in future transactions. The SES activity must lower the costs of transactions beyond merely pro-viding advertisement. The sharing economy platform
is distinct from the supplier and does not refine or significantly transform the supplier’s inputs to the supplied service. Further, the suppliers must at least partly make use of excess capacity for the production inputs that combine to produce the final good or service listed.
A sharing economy service provider (SESP) is an organization that primarily provides sharing economy services.
DEFINITION 2:
The sharing economy is constituted by all the exchanges made through SESs. First, excess capacity is utilized as a decentralized
supply of goods and/or services that are supplied on a case-by-case basis.
Second, large digital networks are mobilized by the use of ad hoc peer-to-peer matchmaking that may or may not be catalyzed by microcapitalism, i.e. micro-transactions related to each exchange.
Third, trust is at least partly ensured through the matchmaking process and to varying degrees evident from the existence and use of the sharing economy service in question.
Putting these three business model compo-nents together results in the triangular sample
space depicted in Figure 3.1. By this definition, a sharing economy service provider falls within this sample space, but two providers may differ considerably from each other — for instance, by having strong or no monetary incentives for engaging in exchanges. While this type of defini-tion is admittedly wide in range, it also mirrors a significant variation in existing self-identified sharing economy services that makes the field complicated to demarcate (Schor, 2014).
This allows us to make the following formal definitions:
MICROTRANSACTIONS
Transactions associated with sharing economy exchanges are individual and may or may not be monetary.
AD HOC MATCHMAKING
Supply and demand is matched on-demand and ad hoc between peers.
DECENTRALIZED SUPPLY
Supply is decentralized to peers that contribute their excess capacity (goods/services) on a case-by-case basis.
Measuring the
Sharing Economy
T
he goal of the Timbro Sharing Economy Index is to measure the amount of activity in the sharing economy globally. In order to use all data collected to estimate the relative size of the sharing economy, we employ a composite indicator that uses both an Internet traffic indicator and scraped data about the number of active suppliers on a service. We normalize both indicators using z-scores and use the mean between the two normalized indicators.The data collection process for service data consists of three phases. First, we compile a comprehensive, raw list of potential services that might reasonably qualify as sharing economy services. Second, we use the criteria listed above in the definition to categorize the list of potential services into sharing economy services and non-sharing economy services. Finally, we continuously maintain an up-to-date list of sharing economy resources and handle the addition, removal and re-classification of services.
T
here are a number of lists that have aggregated collaborative consump-tion services, and thus include sharing economy services as the concept collaborative consumptions is a superset of the sharing economy (Botsman and Rogers 2011) – but they vary in quality and scope. Some rely on self-reporting and do not provide fact-checking or internal policing of what to exclude. For example, the aggregator Mesh lists almost 5,000 services, many of which, such as local housing or workers’ cooperatives, clearly fall outside our defi-nition. Further, many listings on Mesh had dead links. Other lists, such as Collaborative Consumption and The People Who Share have had teams of social and computer scientists actively checking and maintaining the sites.While the latter lists are more selective, they focus mostly on services within English-speaking countries and Europe and are thus not comprehensive enough to serve as a foundation for a global index. We look to regional and national lists in order to create a more comprehensive list of
potential goods and services. Because we seek to measure activity globally in order to understand the effect of diverse regula-tory and economic environments on the development of sharing economy services, we ensure that our methods of aggregating and categorizing services maintain a repre-sentative sample of worldwide services. In order to compensate for any potential biases toward Western countries in other lists, we have chosen to aggregate a full list of poten-tial services.
Using a computer at the University of Pennsylvania campus and a “neutral browser”2 we ran search queries for services
on the Google search engine. In order to find local service directories, we searched in the local language of the country using the following method. Since translating the term “sharing economy” directly into dif-ferent languages may result in the loss of the “collaborative consumption” concept, we used the title of the corresponding Wikipedia article in each language in our search. We also added the word “directory” to the search in each corresponding
Identifying the
Sharing Economy
International lists of collaborative consumption services: → collaborativeconsumption.com
→ thepeoplewhoshare.com → sharing-economy-startups.silk.co → shareannuaire.com
These services have international listings, but each of these examples has a strong anglophone or francophone bias.
language in order to focus on aggregate lists. For languages used in more than one country (e.g. English), we added the country name in the search to further specify the region (e.g. “Sharing
economy directory Australia” for Australia, or “Consumo colaborativo directorio Chile” for Chile). We used both the US Google server and the country-specific Google server (e.g. “google.de” for Germany) for each country in order to collect as robust a sample as possible.
In order to maintain relevance, only the first ten results from each search were used. A website was used only if it listed sharing economy companies with usable links to each listing’s main web page. Each directory was cataloged with the following information: Country of Search, Directory Name, URL, Estimated Number of Listings, and the Search Terms used in the Google search.
The majority of the work of classifying the 4,651 SES candidates was done by a team recruited through a sharing economy service called Upwork.3
Each worker was interviewed, trained via video chats and then tested to verify that they understood the classification criteria. The classification work was organized in such a way so that each service was classified independently by at least two classifiers. The classifiers also indicated their certainty for each classification they made. The less certain classifications, or conflicting ones, were classified by more than two classifiers. We then used the majority classification to indicate whether a service was a sharing economy service.
A purpose-built web tool was implemented to conduct the classification. This tool was optimized in order to elim-inate as early as possible any services hat were not sharing
economy services. The web tool also structured the clas-sification problem in order to ensure a uniform process in which no aspect was omitted. Our operationalized definition allowed the team of classifiers to follow the same procedure to determine whether a company is a sharing economy service, and if not, to indicate what factor they believed excludes it from this category.
The following questions were used in order to
determine whether a service meets the criteria
of a sharing economy service.
4 Here, we are trying to distinguish between online marketplaces that transfer goods between demanders and suppliers and sharing economy services that provide the platform for suppliers to offer
services or rentals. We focus on the primary goal of the platform. Some platforms primarily provide rentals with a second option to buy goods. We would classify these platforms as not transferring ownership.
TSEI
Classification Tool
01
05 06
07 08
Is the service still
active/in business?
Does the platform
facilitate the deal? In
other words, does the
platform make it easier
and safer to make a
deal? Or, in yet other
words, does it lower
transaction costs?
Are contracts on a
case-by-case basis? Do the
demander and supplier
make a deal on a
transaction-by-transaction level without
a long-term contract?
Does the platform
produce none of the
output?
Does the supplier have
an excess of inputs?
02
Is the service a platform,
distinct from both the
demander and the
supplier?
03 04
Is there not a transfer
of ownership? If the
platform offers a service
and also transfers the
ownership of goods, is
the primary goal of the
platform to facilitate
exchange of services?
4Are marketable goods
supplied?
The classification tool ensures that the sharing economy service, supplying peer, and demanding peer are all distinct entities. Because the sharing economy service is not allowed to produce the good or contribute major input. It merely provides a platform. The supplying peer provides the inputs or factor of production, which include either labor, capital, property or a combination thereof. The output of the supplying peer is the provision of a service such as transportation or accommodations.
What distinguishes sharing economy services from more
traditional economic goods
and services is the type of inputs, rather than the final good provided. Based only on the demanded good, a traditional
taxi service looks very similar to a ride-sharing service. We must categorize according to inputs in order to draw a clear boundary between SESs and non-SESs.
We need to ensure that the sharing economy service lowers transaction costs and that a sup-plying peer is not contractually bound beyond the transaction to either the sharing economy service or the demanding peer. Labor contracts are only allowed to be binding for individual transactions. As a result, the supplying peer can enter and exit the market freely, and the sup-plier has excess capacity of inputs, including labor, capital, property or a combination thereof. Here, the inputs used to produce and supply a particular good are distinct from the final good supplied. In the case of ride-sharing, a demander will consume transportation; however, the
driver supplies labor and the short-term use of their car.
It is important to note that we categorize services as SES or non-SES according to the use of inputs, rather than the final good supplied. The SES definition requires that the service make use of idle capacity. This is a standard char-acteristic of the sharing economy. In classifying services it however gets more complicated. What may initially have started out as a service that
only utilize idle capacity, may turn into a mixed service where suppliers start investing in capital with the sole purpose to capitalize on it via the service. The latter is clearly not part of the shar-ing economy accordshar-ing to our definition. We have however chosen to include services as long as their activity is primarily directed towards making use of idle capacity.
The list of criteria for categorization allows us to distinguish clearly and methodically between services. We recognize, however, that categorization is an iterative process. Clear definitions and criteria dictate how services should be categorized, but a process of recourse is necessary as well.
Based only on the perceived
demanded good, a traditional taxi
service looks very similar to a
ride-sharing service.
B
efore starting to collect data on all the identified services, we con-ducted a pre-study that examined a subset of the services in detail. For this we purpose-built so-called “scrapers” for each of the considered services to automatically browse and download content from the services’ public websites.The data collected is used to approx-imate the number of active suppliers. Typically this is done by accessing all list-ings and counting the number of suppliers on a given service’s website who have active listings during a certain window of time.5
The only data relevant for the construction
of the Timbro Sharing Economy Index are the coordinates of each listing and a unique supplier identity. In order to make a count per country we created a new data set where we determined to which country each of the 3 million coordinates of the suppliers be-longs using the GADM Database, version 2.8, of Global Administrative Areas. This data set allowed us to conclude that the number of active suppliers on each service varies by many orders of magnitude.
Given the large number of services classified as sharing economy services, it was infeasible to scrape each and every one. This led us to look for another measure to use
Collecting Data on the
Sharing Economy
in concert with scraped data. The measure chosen was Internet traffic to the websites. This allows us to get data for all services and for 213 countries, but it results in an underestimate of the size of typical app-first services. Unfortunately this will affect the rankings, as countries with large active ride-sharing services might not get accu-rate representation. Given that we do not have a reason to believe that the app-first services have a biased distribu-tion across countries, we consider the errors less problem-atic for our correlations.
In order to compile the index ranking for the TSEI, we take World Bank Indicator data on populations per country and compute a measure of per capita traffic to any sharing economy service during the average month. We then make a composite index by normalizing
each of the metrics6 and then combining the mean
of the two indicators7. This method makes the index
more robust by lowering the impact of measurement error in either of the two data sources.
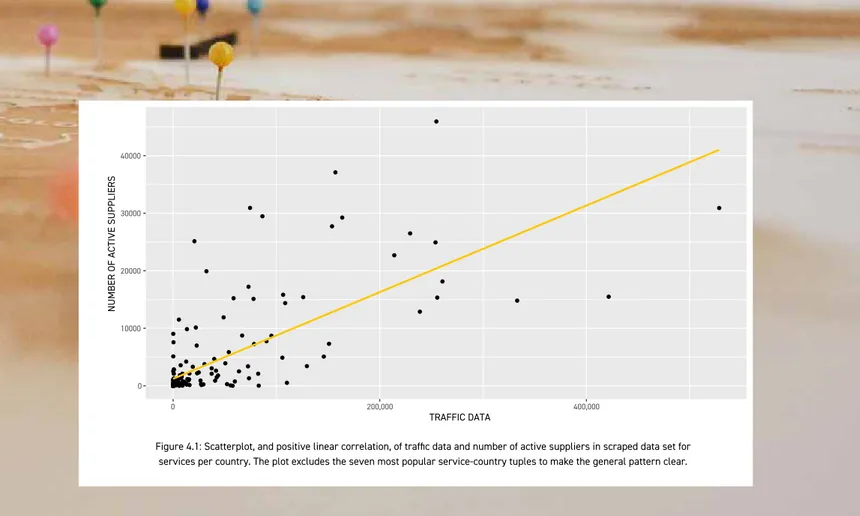
It should be noted that our data do not allow us to separate intensive from extensive margins of usage. In other words, a given level of usage depends on how many people use sharing economy services, as well as on the intensity of usage. 0 10000 20000 30000 40000 0 200,000 400,000 TRAFFIC DATA
NUMBER OF ACTIVE SUPPLIERS
6 Using z-scores, i.e. the number of standard deviations from the mean.
7 The same methodology as is employed by Transparency International’s Corruption Perception Index.
Figure 4.1: Scatterplot, and positive linear correlation, of traffic data and number of active suppliers in scraped data set for services per country. The plot excludes the seven most popular service-country tuples to make the general pattern clear.
The Sharing Economy
and Free Markets
W
hat is the relationship between free markets and the sharing econo-my? What types of policies should be implemented to create conditions for a thriving sharing economy? Questions like these can be analyzed by making use of the concept of economic freedom, which can most simply be understood as the degree to which an economy is a market economy. As explained by Berggren(2003), in a country with high levels of economic freedom, it is possible to enter into voluntary contracts within the framework of a stable and predictable rule of law that upholds contracts and protects private property, with a limited degree of interventionism in the form of government ownership, regulations and taxes.
Each dimension in the Economic Freedom Index consists of sever-al components that are weighed together and assigned a score be-tween 0 and 10. The aggregated economic freedom is the average of the score in the five dimensions (equally weighted). The five dimen-sions are:
• Size of Government: Expenditures, Taxes, and Enterprise,
• Legal structure and security of property rights,
• Access to sound money,
• Freedom to trade internationally, and
• Regulation of credit, labour, and business.
T
he degree of economic freedom in a country is often measured using the Economic Freedom Index released yearly by the Fraser Institute on freetheworld.com. The index consists of five dimensions that each measure a particular as-pect of economic freedom, and it has frequentlybeen used to quantify institutions and policies in a way that is comparable both over time and between countries (see Hall and Lawson (2014) for a survey). For example, the survey by Doucouliagos and Ulubasoglu (2006) shows that the Economic Freedom Index has repeatedly been found to be highly correlated with growth.
For all dimensions, a higher number means more economic freedom. The first dimension will henceforth be called limited government and the fifth will be called regulatory freedom. The Economic Freedom of the World (EFW) index was first published in 1996 (Gwartney et al., 1996). At the time of writing, the most recent data are from 2014.
Before examining the data, it is worth discuss-ing what kind of relationships we should expect to find. Because economic freedom is beneficial for growth and prosperity, it is reasonable to expect that countries with high levels of eco-nomic freedom will have better information and communication infrastructure simply be-cause they are better able to afford it. A positive correlation between sharing economy usage and
economic freedom is thus to be expected. It is less obvious, however, whether such a correlation will hold when controlling for GDP per capita. If two countries are equally rich, will the coun-try with more economic freedom have a bigger sharing economy? Answering this question is important because there are competing views on the nature of the sharing economy. If the sharing economy is primarily a way to avoid taxation and regulation, sharing economy usage should cor-relate negatively with economic freedom (when controlling for other significant variables). On the other hand, if the sharing economy is basically a new and innovative way of doing business, it should correlate positively with economic freedom (after controlling for GDP per capita).
Table 5.2: TSEI, country-level regressions
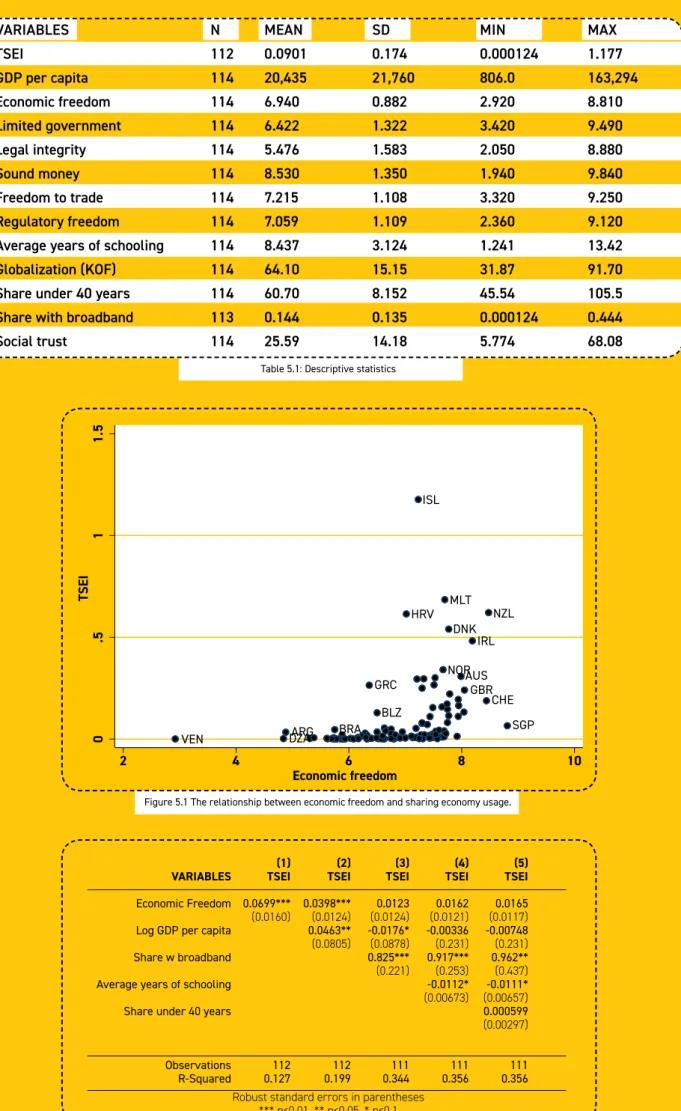
VARIABLES N MEAN SD MIN MAX
TSEI 112 0.0901 0.174 0.000124 1.177 GDP per capita 114 20,435 21,760 806.0 163,294 Economic freedom 114 6.940 0.882 2.920 8.810 Limited government 114 6.422 1.322 3.420 9.490 Legal integrity 114 5.476 1.583 2.050 8.880 Sound money 114 8.530 1.350 1.940 9.840 Freedom to trade 114 7.215 1.108 3.320 9.250 Regulatory freedom 114 7.059 1.109 2.360 9.120
Average years of schooling 114 8.437 3.124 1.241 13.42
Globalization (KOF) 114 64.10 15.15 31.87 91.70
Share under 40 years 114 60.70 8.152 45.54 105.5
Share with broadband 113 0.144 0.135 0.000124 0.444
Social trust 114 25.59 14.18 5.774 68.08
VARIABLES
Economic Freedom Log GDP per capita Share w broadband Average years of schooling Share under 40 years
Observations R-Squared (1) TSEI 0.0699*** (0.0160) 112 0.127 (2) TSEI 0.0398*** (0.0124) 0.0463** (0.0805) 112 0.199 (3) TSEI 0.0123 (0.0124) -0.0176* (0.0878) 0.825*** (0.221) 111 0.344 (4) TSEI 0.0162 (0.0121) -0.00336 (0.231) 0.917*** (0.253) -0.0112* (0.00673) 111 0.356 Robust standard errors in parentheses
*** p<0.01, ** p<0.05, * p<0.1 (5) TSEI 0.0165 (0.0117) -0.00748 (0.231) 0.962** (0.437) -0.0111* (0.00657) 0.000599 (0.00297) 111 0.356
Table 5.1: Descriptive statistics
0 .5 1 1. 5 TSEI 2 4 6 8 10 Economic freedom ISL MLT HRV NZL DNK IRL NORAUS SGP CHE GBR GRC BLZ BRA ARG DZA VEN
Little is known about country-level factors that facilitate sharing economy usage. In a previous unpublished study, Bergh and Funcke (2016) ana-lyze the size of two home-sharing services (Flipkey and Airbnb) in cities around the world and show that the most important determinant of what they call sharing economy penetration is infra- structure for information and communication technology (ICT), measured by the percentage of people with access to high-speed Internet accord-ing to the World Bank.
One might expect education, country-level openness and a relatively young population to be positively associated with sharing economy usage. Therefore, we also control for average years of schooling in the population, globalization as measured by the KOF index and the share of the population below 40 years of age. Descriptive statistics for all variables are shown in Table 5.
Plotting sharing economy usage against aggregate economic freedom (Figure 5.1) illus-trates clearly that sharing economy usage is higher in economically free countries, but suggests that other factors matter as well. In the large group of countries with a level of economic freedom between 7 and 8, there is substantial variation in sharing economy usage.
A standard OLS regression of sharing econ-omy usage on the aggregate economic freedom index confirms the positive association (Table 5.2, column 1). Countries with one standard de-viation higher economic freedom
have on average 0.38 standard devia-tion higher sharing economy usage. Slightly less than half of this associ-ation is explained by countries with more economic freedom having higher GDP per capita (column 2).
Interestingly, the effect of higher GDP per capita is driven entirely by the population share with access to high-speed Internet (column 3), and once broadband access is controlled for, per capita GDP is negatively related to TSEI, suggesting that sharing economy services are used
less in richer countries when other factors remain constant. A plausible interpretation of this result is that sharing economy services provide low-cost alternatives to similar products provided by reg-ular firms. Education and demography do not seem to matter much.
Table 5.3 shows the pairwise correlations between sharing economy and each type of economic freedom. While usage is higher in coun-tries with bigger government, all remaining types of economic freedom are positively associated with sharing economy usage.
As shown in Table 5.4, regulatory freedom matters even when other variables are controlled for. In other words, the evidence clearly suggests that the sharing economy is not primarily a way to avoid taxation and regulation, but rather some-thing that benefits from high levels of regulatory freedom.
Note also that the coefficient for legal integrity is positive and weakly significant, suggesting a positive association between the sharing economy and rule of law.
Limited government -0.30
Legal integrity
0.54
Sound money
0.22
Freedom to trade
0.35
Regulatory freedom
0.35
Table 5.3: Correlations (unconditional) between TSEI and five types of economic freedom.
VARIABLES
Log GDP per capita Broadband use per capita Average years of schooling Share under 40 years Limited government Legal integrity Sound money Freedom to trade Regulations Observations R-Squared (1) TSEI -0.00504 (0.0247) 1.007** (0.457) -0.0106 (0.00714) 0.000400 (0.00299) 0.00370 (0.0100) 111 0.352 (2) TSEI -0.0130 (0.0261) 0.796* (0.407) -0.00960 (0.00638) 0.000640 (0.00308) 0.0251* (0.0151) 111 0.369 (3) TSEI -0.00398 (0.0239) 0.996** (0.445) -0.00955 (0.00607) 0.000231 (0.00283) -0.00783 (0.0143) 111 0.354 (4) TSEI -0.00829 (0.0236) 0.972** (0.439) -0.0106 (0.00641) 0.000739 (0.00283) 0.0113 (0.0114) 111 0.355 Robust standard errors in parentheses
*** p<0.01, ** p<0.05, * p<0.1
Table 5.4: Explaining sharing economy usage using five types of economic and control variables.
(5) TSEI -0.00517 (0.0250) 0.920** (0.421) -0.0118* (0.00674) 0.000382 (0.00301) 0.0218** (0.00986) 111 0.365
The Sharing Economy
and Trust
Trust is important for sharing economy services. The necessary trust relationship
is between peers, and between peer and platform. To what degree each type of
trust is important will vary with the service. The former, that is trust between
peers, is similar to the well-studied concept of social trust.
S
ocial trust is the individual belief that most people can be trusted, and it is typically measured by asking people in sur-veys to what extent they agree with the proposition that “most people can be trusted.” The trust ques-tion has been posed in surveys such as the World Values Survey and the European Values Study from the early 1980s, and a large body of research has confirmed the importance of social trust.Average country-level trust can, for example, explain economic growth (Algan and Cahuc, 2010), macroeconomic stability (Sangnier, 2013) and welfare state size (Bergh and Bjørnskov, 2011; Bjørnskov and Svendsen, 2013).
The sharing economy is typically assumed to be closely related to trust. As noted by Arrow (1972), every economic transaction contains an element of trust. As discussed by Bergh and Funcke (2016), many services facilitated by sharing economy service providers could have taken place without the aid of the plat-form, provided that social trust would have been sufficiently high. The consequence is that the market potential for SESs should be bigger where trust is lower, when con-trolling for other relevant factors. Using data gathered from Airbnb and Flipkey (using search queries in the capital city of each country), Bergh and Funcke show that offers per capita on these home-sharing services are indeed negatively related to social trust, once Internet speed is controlled for.
As shown in Table 6.1, the results in Bergh and Funcke (2016) are largely confirmed when using TSEI to quantify the sharing economy. The bivariate correlation between social trust and TSEI is positive and significant (column 1), but this correlation appears only because high-trust countries tend to have a higher share with broadband. Once broadband share is controlled
for, social trust becomes insignificant (column 3). Adding controls for demographic structure and education changes very little (column 4). Our finding that social trust is unrelated to the use of sharing economy services does not sup-port the popular notion that the sharing economy depends on high levels of social trust outside the platform. An alternative hypothesis is that a major contribution of companies in the sharing econo-my is that they have found ways to facilitate trust- intensive transactions also where social trust is low. A plausible explanation for the loss of signif- icance is an alternative hypothesis suggested by Bergh and Funcke (2016): the relative value of reputation and ranking systems, and a third party providing rules and contracts, is higher in countries where most people are reluctant
to trust anonymous strangers. In the words of Botsman and Rogers (2011), the rise of sharing economy services means that we have “returned to a time when if you do something wrong or embarrassing, the whole community will know.” A possible consequence worth further examination is that the sharing economy may have a positive effect on social trust. When people are more likely to care about their reputation, they are less likely to behave oppor-tunistically.
VARIABLES
Social Trust Log GDP per capita Share w broadband Average years of schooling Share under 40 years
Observations R-Squared (1) TSEI 0.00436** (0.00134) 112 0.128 (2) TSEI 0.00294** (0.00120) 0.0484*** (0.0102) 112 0.219 (3) TSEI 0.000747 (0.00104) -0.0149 (0.0111) 0.809*** (0.205) 111 0.344 (4) TSEI 0.000435 (0.00103) -0.00617 (0.0250) 0.950** (0.438) -0.00926 (0.00640) 0.000450 (0.00302) 111 0.352 Robust standard errors in parentheses
*** p<0.01, ** p<0.05, * p<0.1
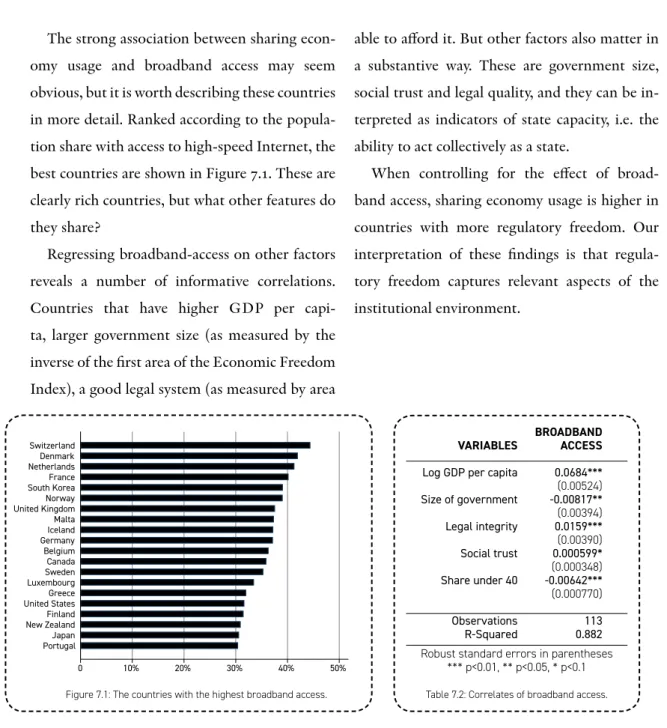
T
he determinants of the size of the sharing economy are contested. Does a regulatory burden typically get in the way? Alternatively, is the sharing economy a way of evading formal business regulations? Do we need trust to share our capital with others? Alternatively, is it a lack of trust that sharingeconomy platforms overcome? The quantitative analysis in chapter 5 and 6 provides clear indications of country-level fac-tors that correlate with the size of the
sharing economy.
Before policy con-clusions are drawn, it must be verified that regulatory freedom
matters also when trust and other vari-ables are controlled for (and vice versa). Ultimately, it will be a task for future re-search to verify the robustness of the asso-ciations we have demonstrated. As shown in Table 7.1, regulatory freedom and the
share of the population with broadband are significantly related to the sharing economy index even when controlling for social trust, schooling, demography and the often used KOF index of globalization (suggesting that regulatory freedom matters also when controlling for how involved a country is in
the global economy). Among the factors examined, the most important one seems highly intuitive: the sharing economy is bigger in countries where more people have access to high-speed Internet. The association is strong: one standard devi-ation higher access to broadband cor-responds to an in-crease in TSEI of 0.74 standard de-viation. For regulatory freedom, the effect is relatively small: one standard deviation increase in regulatory freedom corresponds to a 0.16 standard deviation increase in the sharing economy index.
Making the Sharing
Economy Thrive?
CHAPTER 7
VARIABLES
Regulatory freedom Log GDP per capita Broadband use per capita Social trust Average year of schooling
Share under 40 Globalization Index Observations R-Squared TSEI 0.0244** (0.0119) 0.0100 (0.0256) 0.948* (0.492) 6.20e-05 (0.00100) -0.0116 (0.00670) -0.000325 (0.00247) -0.00184 (0.00343) 111 0.39 Robust standard errors in parentheses
*** p<0.01, ** p<0.05, * p<0.1
Table 7.1: Testing the robustness of regulatory freedom in explaining the sharing economy index.