experimental investigation of the relation
between learning
and separability in spatial representations
HS-IDA-MD-01-004
Louise Eriksson
experimental investigation of the relation
between learning
and separability in spatial representations
Louise Eriksson
Submitted by Louise Eriksson to the University of Skovde as a dissertation towards the degree of M.Sc. by examination and dissertation in the Department of Computer Science, September 2001.
I certify that all material in this dissertation which is not my own work has been identified and that no material is included for which a degree has already been conferred upon me.
Abstract
One way of modeling human knowledge is by using multidimensional spaces, in which an object is represented as a point in the space, and the distances among the points reflect the similarities among the represented objects. The distances are measured with some metric, commonly some instance of the Minkowski metric.The instances differ with the magnitude of the so-called r-parameter. The instances most commonly mentioned in the literature are the ones where r equals 1, 2 and infinity. Cognitive scientists have found out that different metrics are suited to describe different dimensional combinations. From these findings an important distinction between integral and separable dimensions has been stated (Garner, 1974). Separable dimensions, e.g. size and form, are best described by the city-block metric, where r equals 1, and integral dimensions, such as the color dimensions, are best described by the Euclidean metric, where r equals 2. Developmental psychologists have formulated a hypothesis saying that small children perceive many dimensional combinations as integral whereas adults perceive the same combinations as separable. Thus, there seems to be a shift towards increasing separability with age or maturity.Earlier experiments show the same phenomenon in adult short-term learning with novel stimuli. In these experiments, the stimuli were first perceived as rather integral and were then turning more separable, indicated by the Minkowski-r. This indicates a shift towards increasing separability with familiarity or skill.This dissertation aims at investigating the generality of this phenomenon. Five similarity-rating experiments are conducted, for which the best fitting metric for the first half of the session is compared to the last half of the session. If the Minkowski-r is lower for the last half compared to the first half, it is considered to indicate increasing separability.The conclusion is that the phenomenon of increasing separability during short-term learning cannot be found in these experiments, at least not given the operational definition of increasing separability as a function of a decreasing Minkowski-r. An alternative definition of increasing separability is suggested, where an r-value ‘retreating’ 2.0 indicates increasing separability, i.e. when the r-value of the best fitting metric for the last half of a similarity-rating session is further away from 2.0 compared to the first half of the session.
Contents
Abstract ...i
Contents ...ii
1. Introduction ... 1
1.1 Aims and objectives of this dissertation... 2
1.2 Dissertation outline ... 3
2. Background... 4
2.1 Representations in general... 4
2.1.1 Intrinsic and extrinsic representations ... 4
2.2 Cognitive representations ... 5
2.3 Conceptual spaces ... 6
2.3.1 Similarity as a function of distance ... 8
2.3.2 The Minkowski metric... 9
2.3.3 Identifying the underlying dimensions using MDS ...11
2.3.4 Symbolism and associationism ...12
2.3.4.1 Symbolic representation...12
2.3.4.2 Subconceptual/associationist representation ...13
2.3.5 Integral and separable dimensions ...15
2.3.6 The continuum of integrality...16
2.3.7 Non-metrical operational tests for separable dimensions...17
2.3.7.1 Shortcomings with the non-metrical operational tests...19
2.4 Developmental psychology ...20
2.4.1 The developmental hypothesis...20
2.4.2 Two competing theories of developmental differences in object perception ...22
2.4.3 Proof against the developmental shift from integral to separable perception ...23
2.4.4 Other factors influencing separability ...24
3. Problem statement... 26
4. Method ... 30
4.1 Dunn’s method...30
4.1.1 Correspondence...31
4.1.3 Intradimensional subtractivity...33
4.1.4 Linearity...33
4.1.5 Determining the spatial metric ...33
4.2 Methodology adopted...34
4.3 General description for experiments 1 – 4 ...36
4.3.1 Procedure ...36
4.3.2 Stimuli ...36
4.3.3 Subjects...37
4.4 Experiment 1 – Saturation and brightness...37
4.4.1 Subjects...37
4.4.2 Stimuli ...37
4.4.3 Results and analysis...38
4.5 Experiment 2 – Hue and saturation...40
4.5.1 Subjects...40
4.5.2 Stimuli ...40
4.5.3 Results and analysis...40
4.6 Experiment 3 – Hue and brightness ...42
4.6.1 Subjects...42
4.6.2 Stimuli ...42
4.6.3 Results and analysis...42
4.7 Experiment 4 – Hue, saturation and brightness ...44
4.7.1 Subjects...44
4.7.2 Stimuli ...44
4.7.3 Results and analysis...44
4.8 Experiment 5 – Sounds...46
4.8.1 Subjects...46
4.8.2 Stimuli ...46
4.8.3 Procedure ...47
4.8.4 Results and analysis...47
5. Conclusions and general discussion... 51
5.1 Conclusions...51
5.2 General discussion ...51
1. Introduction
The two major goals of cognitive science are to explain cognitive abilities through theories and to construct artifacts like robots and programs that can accomplish cognitive tasks (Gärdenfors, 2000). A problem for both these goals is how the representations used by the cognitive system shall be modeled.
Knowledge of how humans integrate information when judging similarities is important for two reasons. Firstly, it is important from a theoretical perspective for basic research within cognitive science regarding spatial representations and concept acquisition. Secondly, it is important from a pragmatic perspective within AI when it comes to, e.g., tuning machine learning algorithms.
Multidimensional spaces are one way of modeling cognitive representation (Palmer, 1978). So-called quality dimensions build up such a space, where e.g. size, hue and pitch can be possible dimensions. Objects are represented as points in the space on locations corresponding to the values the objects have on the dimensions of question. The distances among the points represent the similarity among the represented objects. The question is what metric to use when calculating the distances. Some instance of the generalized Minkowski metric is commonly used for this purpose. The generalized Minkowski metric is shown in Equation 1, where d(a,b) is the distance between object a and b, a is the position of object a on the ith axis and m is thei
number of constituting dimensions. The instances differ with the magnitude or the r-parameter. There are three extremes, with r-values equal to 1, 2 and infinity, which are called city-block, Euclidean and dominance metrics respectively. Given two points in a two-dimensional space, the distance between these points is the sum of the differences on both dimensions for the city-block metric, the hypotenuse for the Euclidean metric and the greatest unidimensional difference for the dominance metric.
r r i m i i b a b a d / 1 1 | | ) , ( − =
∑
= ; r>=1 Equation 1Cognitive psychologists have found out that different instances of the Minkowski metric are better for different dimensional combinations. Garner (1974) says that
dimensional combinations best described by the Euclidean metric, e.g. saturation and brightness, are integral, and dimensional combinations best described by the city-block metric, e.g. size and form, are separable.
Besides this metrical definition of separability, other operational tests have been used to test dimensional combinations for separability, e.g. the restricted classification and the redundancy task (Maddox, 1983).
The distinction between integrality and separability has been applied within the field of developmental psychology as well. Researchers in the field have found evidence that the separability is not determined by the inherent properties of the dimensions only, but that developmental level, indicated by age, also determines how multidimensional stimuli are perceived (see e.g. Shepp and Swartz, 1976; Smith and Kemler,1977; Kemler, 1982). A developmental hypothesis has been formulated, that states that many dimensional combinations perceived as integral by young children are perceived as separable by adults (see e.g. Smith, 1980; Kemler, 1978).
If separability increases with a child’s increasing maturity and skill, there is reason to believe that the essence of the developmental hypothesis holds for an adult when he or she is getting more familiar with a novel multidimensional structure. Experiments from Johannesson (2001) show such a phenomenon of increasing separability during a short-term learning situation, reflected by a decreasing Minkowski-r, for subjects confronted with four-dimensional visual stimuli differing on both integral and separable dimensions. The question is how general this phenomenon is, if it can be applied to other modalities, number of dimensions and dimensional combinations.
1.1 Aims and objectives of this dissertation
The aim of this dissertation is to investigate the generality of the phenomenon that perceived similarity goes towards increasing separability as a function of familiarity. Opposed to the developmental hypothesis, the varying subject factor in this case is not age, but degree of familiarity, and thus skill, with a particular stimulus structure. Adults are tested in an unfamiliar situation with stimuli novel to them. The
increasing familiarity with the stimulus structure, and more specifically, to see whether the r-value for the best describing Minkowski metric is decreasing.
The following objectives will fulfill the overall aim of the dissertation:
• To do a literature survey within the fields of cognitive psychology, regarding spatial representations and similarities, and developmental psychology, regarding work related to the developmental hypothesis.
• To carry out experiments with metric fitting of dissimilarity ratings.
• To analyze the results to see if they are in line with the phenomenon of increasing separability with familiarity.
1.2 Dissertation outline
In chapter 2, a background survey will be given. It will include an overview of representations in general, and spatial representations in particular, and a description of the developmental hypothesis. In chapter 3, the statement of the problem is given. In chapter 4, the method used, and the achievements and results of the experiments are described. Chapter 5 includes the conclusion of the dissertation and a general discussion.
2. Background
2.1 Representations in general
Before turning to the sub-domain of spatial representations, the general notion of representations has to be defined. Palmer (1978) gives a comprehensive description of the concept of representation. A representation is, in short, something that stands for something else, that is, some sort of model for the thing it represents.
Palmer defines five aspects that together constitute a representation, or rather a representational system. These are: the represented world, the representing world, the aspects in the represented world that will be modeled, the aspects of the representing world that will do the modeling and, finally, the correspondences between the two worlds.
A representation contains information about the world it represents. At least some of the relations holding for pairs of objects in the represented world have to be structurally preserved in relations for the corresponding pairs of representing objects in the representing world. The representing world can be used instead of the represented world for some purposes.
2.1.1 Intrinsic and extrinsic representations
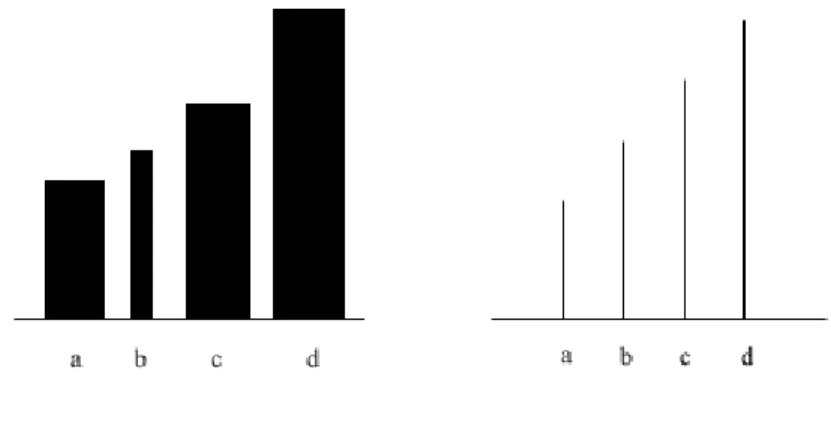
A representation is intrinsic when it has a built-in structure (Palmer, 1978). That is, when a representing relation has the same inherent constraints as its represented relation. That is the case, for example, when vertical lines represent the relation taller
than, where a line, representing one object, is longer than another line means that the
Figure 1. Examples of representation. To the left is the represented world, and to the right is a representing world of it.
This representation preserves the asymmetry and transitivity constraints that exist in the represented world for the relation of being taller than. On the opposite, a representation that has representing relations with an arbitrary inherent structure, but its represented relations do not, is called extrinsic (Palmer, 1978). This kind of representation must be accompanied by a rule that specifies how the relations should be interpreted (Gärdenfors, 2000). A good example of intrinsic representations is multidimensional spaces (Palmer 1978). A lot of structure is built into such a space because of the representation of objects as points in the space, and the relation of similarity represented by distances between points. Multidimensional spaces are further described in section 2.2.
2.2 Cognitive representations
The general notion of representations can be applied to the problem of modeling cognitive representations. The question is how cognitive models relate to mental representations and its referent, the real world1. Palmer (1978) relates the concepts in the following way. The mental world is a representation of the real world. A mental model is in turn a representation of the mental world. A cognitive theory should be a proper description of the mental world and the mental model.
1
Some common cognitive representations are templates, features and structural descriptions, and one instance of feature representations is multidimensional spaces (Palmer, 1978).
A multidimensional space is a common form of feature representation (Palmer, 1978). It is a metaphor where mental objects are modeled as points in a metric space of n dimensions. Some relations among the represented objects are preserved by spatial relationships between the corresponding points in the space. The similarities between the objects in the represented world are reflected by distance relationships between the corresponding points in the space (Palmer, 1978).
The representation in a multidimensional space can be used to classify objects. For an
n-dimensional space, n feature tests are applied to the input object. Each test has m
possible outcomes. The result specifies the coordinates of that point’s location in the space. The point is then compared to other points representing objects in the space. There are two classification methods: the point and the region method. In the point method, all represented objects are represented as individual points in the space. The new input is compared to the category points according to some distance metric (see below), and is classified as a member of the closest category. In the other method, the objects are represented as regions. The new object is classified as a member of the category within whose region its coordinate falls.
2.3 Conceptual spaces
Gärdenfors (2000) gives a comprehensive description of what he calls conceptual spaces, which is similar to the multidimensional spaces described above. The difference is that he uses it as a framework for representing information on the conceptual level. The main focus is to represent concepts and also properties, which are special cases of concepts.
In order to describe conceptual spaces, a definition of the word concept is valuable. It is hard to define, but one attempt can be found in Barsalou (1992). He says that a
activities: categorization and conceptualization. A definition related to categorization is that a concept is information that allows one to discriminate members of a category from non-members. For fuzzy categories prototypes can represent the category. In that case an object is a member of a category if it is sufficiently similar to its prototype.
Conceptualization is how one conceives of a category on a specific occasion, and it differs from occasion to occasion. Conceptualization does not provide any rules for categorization, because it is used for other goals, such as comprehension, prediction and action. On a particular occasion only a small subset of the total knowledge of a category is included in the conceptualization.
Barsalou also states that some theorists use concept and category interchangeably. Two traditional usages of category are that a category is all physical examples of a concept or all examples represented in the memory.
Back to Gärdenfors’ description of conceptual spaces. A conceptual space is a geometrical structure based on quality dimensions. So called quality dimensions build up the domains needed for representing concepts. A dimension in a conceptual space represents some quality of an object. It is because of these dimensions that one can tell if objects are similar or different. Some examples of dimensions are hue, size and pitch. Stimuli can be ordered along the dimensions. Ordering of a set of objects along the size dimension would, for example, yield a range from small to large.
Dimensions perceived by the sensory organs are the ones of interest here, but there are other non-sensory dimensions as well (Gärdenfors, 2000).
There is a distinction for uses of quality dimensions between phenomenal, or psychological, and scientific, or physical, interpretations of dimensions. The scientific interpretation treats the dimensions according to physical measurements. In the phenomenal interpretation, the dimensions are instead described according to the cognitive perceptions of them. These two interpretations do not always coincide. One example is height, which in the phenomenal interpretation often is overestimated compared to horizontal dimensions.
The phenomenal interpretation is used when one is trying to explain cognitive processes. Such spaces shall describe the phenomenal measures. In the constructing view, scientifically modeled dimensions are used.
As mentioned above, it is the dimensions that build up the domains needed in the space for representing concepts. In order to define the concept of domain, Gärdenfors introduces the distinction between integral and separable dimensions. A set of dimensions is integral if an object cannot be assigned a value of one dimension without being assigned a value one the others as well. The triple hue, saturation and brightness and the pair pitch and loudness are examples of integral dimensions. Dimensions that are not integral are called separable, such as size and brightness. (The description of integral and separable dimensions given by Gärdenfors shall not be mixed up with the one given later in this dissertation in section 2.3.5.) The definition of a domain can now be defined as a set of integral dimensions that are separable from all other dimensions.
A conceptual space is a collection of one or more domains. Properties correspond to regions of one domain of a space, e.g. red and tall, whereas concepts correspond to regions of several domains, e.g. ball and dog.
Not only concepts, but also individual objects can be modeled in a conceptual space as special cases of concepts. If a concept is a region of a conceptual space, the objects belonging to that concept are represented as points in that region. A point can in turn be seen as a vector of coordinates, with one coordinate for every underlying dimension.
The focus of this dissertation, regarding conceptual spaces, is points and distances among points, which relates to the similarity among the objects represented by the points, and it is the phenomenal interpretation of dimensions that is of interest.
2.3.1 Similarity as a function of distance
One important assumption about conceptual spaces is that the similarity of two objects can be specified from the distance between the two points representing these
by rating techniques are related to distance linearly, opposed to confusability, which is related to distance in a curvilinear way. Melara suggests that distance in a multidimensional space is some linear function of judged similarity, as shown in Equation 2, where d is the distance in the space between stimulus i and j,ij D is theirij
intradimensional difference measured by a direct similarity rating, a is the intercept and b is an additive constant.
ij
ij a bD
d = + Equation 2
2.3.2 The Minkowski metric
In order to calculate the similarity between objects, the distance between the representing points in the metric space has to be calculated. A space is called a metric space if it has a distance function. Two well-known distance functions are the Euclidean and the city-block, which both are specialized cases of the general Minkowski metric (see Equation 1) (Gärdenfors, 2000).
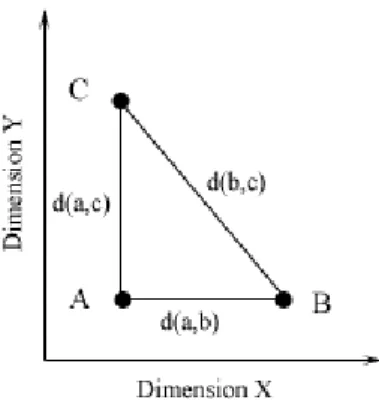
Figure 2. Distances in a two-dimensional space.
If you measure the distance between B and C, in Figure 2, with the Euclidean metric, the Phythagorean relation defines the distance, as shown in Equation 3 (Garner, 1974).
(
2 2)
1/2 ) , ( ) , ( ) , (b c d a b d a c d = + Equation 3If a point c is the center of a Euclidean space, all points on distance d from c lie on a circle around it with the radius d. In a Euclidean space the distances among points does not change under any rotation of the axes, because the orientation of the axes
does not matter (Gärdenfors, 2000). If you instead use the city-block metric for estimating the distance between B and C, in Figure 2, it is the absolute distance from B to C, i.e. the sum of the distances along each dimension separately, shown in Equation 4 (Garner, 1974). ) , ( ) , ( ) , (b c d a b d a c d = + Equation 4
In a city-block space, where a point c is the center, all points on distance d from c lie on a diamond shape around it. This means that a city-block space is not invariant under rotations of the axes, and the space is dependent of the direction of the axes (Gärdenfors, 2000).
A third special case of the generalized Minkowski metric is the dominance metric, where r=∞. In this case, the distance between two objects is determined solely by the dimension with the largest difference (Garner, 1974).
There are several possible distance measures, and for such a measure to be valid some conditions have to be satisfied. Gärdenfors (2000) claims that there are three axioms that have to be satisfied for a valid distance function.
The first one is the minimality axiom. It states that the distance between any two points a and b in the space is equal or greater than 0, and that if the distance is 0, then the two points are the same. Said in a different way, the distance between two points is at least as great as the distance from either of the points to itself (Equation 5).
d(a,b)>=d(a,a) Equation 5
The second axiom is called the symmetry axiom. This axiom states that the distance between the points a and b equals the distance between b and a, for any two points in the space (Equation 6).
d(a,b)=d(b,a) Equation 6
The last axiom is the triangle inequality. For any three points a, b and c, the distance from a to c always equals, or is smaller than, the sum of the distance from a to b and from b to c (Equation 7).
2.3.3 Identifying the underlying dimensions using MDS
When scientists use a conceptual space to construct or explain some cognitive phenomenon they choose the dimensions that build up the space. When the conceptual space instead is a phenomenal one, it is not immediately obvious what dimensions that build up the space. In this case the dimensions have to be inferred from the behavior of the subject. One well-known method for identifying the underlying dimensions of a phenomenal conceptual space is multidimensional scaling, MDS (Gärdenfors, 2000).
The data that is submitted into an MDS algorithm are dissimilarity judgments from direct dissimilarity scaling tests (see e.g. Kruskal and Wish, 1978). The stimuli used in the scaling process are typically composed out of two dimensions with several values on each, and all stimuli that can be generated from any combination of these dimensional values are included. The subject is presented with all pair-wise combinations of the stimuli in the set, and is asked to rate the dissimilarity of each pair on a scale from typically 1 to 10.
The investigator tries to choose the optimal number of dimensions for the space to be constructed and also the optimal metric to be used for defining the distances in the space. The most common metrics are the Euclidean and the city-block metrics (see above). Every stimulus in the set is initially represented as a point in the space with a random location. The algorithm systematically adjusts the locations of the points to fit the similarity ratings as good as possible. The misfit between the similarity ratings and the spatial representation of it is measured by a stress function. The algorithm stops when there is no change in the stress value.
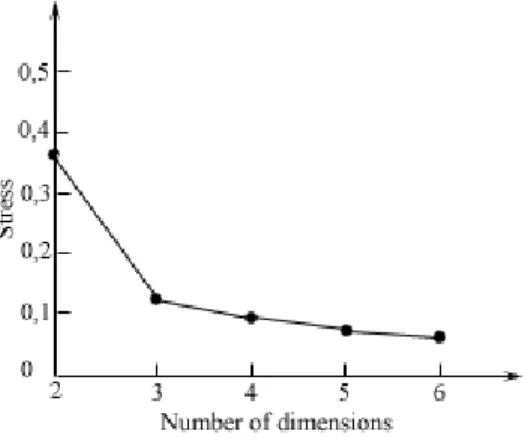
A difficult thing in this procedure is to find the best n-value of the space, that is how many dimensions should build up the psychological interpretation of the space. Higher values of n fit the data better than low values. Sometimes there is a strong assumption about how many dimensions should be used. If that is not the case, one looks at the stress value obtained from a small number n of dimensions and then compares it to the stress value obtained from n+1 dimensions. If the result of n dimensions is not significantly lower than the result from n+1, then n is considered to
be the best number of dimensions. This can also be expressed such that the number of dimensions at the “elbow” is the right one (Johannesson, 1996). This is illustrated in Figure 3, where the elbow is found for three dimensions.
Figure 3. Changes in stress with dimensionality.
After the number of dimensions has been found, the dimensions will be given a psychological interpretation. The investigator often has an idea about what quality dimensions are relevant for the subject’s similarity judgments. One way of verifying the idea is by using “property fitting vectors” (Gärdenfors, 2000).
2.3.4 Symbolism and associationism
In cognitive science there are two dominating approaches for how the representation used by the cognitive system shall be modeled. These are, according to Gärdenfors (2000) symbolism and associationism.
2.3.4.1 Symbolic representation
In the symbolic approach, representation and processing of information are based on manipulations of symbols according to explicit rules. Information processing involves computation of logical consequences. First order logic has been the dominating inferential system for this (Gärdenfors, 2000).
The mind is seen as a computing device. It generates symbolic sentences from the input from the sensory channels, and it performs logical operations on the sentences. The resulting sentences are transformed into output in form of verbal or non-verbal behavior. Symbol manipulation has no contact with the external world once it has got
the input in symbolic form. Symbolic representation is completely extrinsic (Palmer, 1978).
One major problem with the symbolic representation is the frame problem. The problem concerns how to specify what changes and what stays constant in a domain when an action is performed in that domain, and to specify what changes are relevant and what are irrelevant. Propositional representation is not a good way of representing causal connections and dynamic interaction. It often results in an explosion of logical inferences needed. The reason is mainly that there is no natural way of specifying and separating different domains of information.
Another, related, problem is the symbol grounding problem, based on Searle’s (1980) “chinese room argument”. The question is how one can get any semantics into a symbolic system, when the manipulations are purely based on the syntactic form of the symbols (Harnad, 1990). The question is also how the basic predicates are established in the first place.
2.3.4.2 Subconceptual/associationist representation
Representation according to associationism is in form of associations among elements. Connectionism is a special kind of associationism, where the associations are modeled in artificial neural networks, ANNs. In connectionism, in contrast to the symbolic approach, cognition is not symbol manipulations, but a dynamic pattern of activity in a network with node layers and weighted connections among them. There is no central executive in such a network. Each node receives activity from, and transmits activity to, other nodes according to some function. The weights of the connections between nodes are changed gradually according to some learning rule as the network receives new input. There is no explicit memory or representation in the nodes, but earlier input is indirectly represented in the weight changes it has caused (Gärdenfors, 2000).
The representation in a network can be seen as a high dimensional space of activities in the nodes and connections, called the state space approach, but it is not possible to give any interpretations to these dimensions, in contrast to the dimensions of a conceptual space (Gärdenfors, 2000). The state space of an ANN can be used for
comparing similarities between different states, but this is done according to externally defined measures and is not explicitly represented unlike the similarity measures used in a conceptual space (Gärdenfors, 2000).
One advantage of connectionist models is that they are less sensitive to noise than symbolic models. Another is that they involve learning, which can explain how new properties can be discovered. A problem is that a network needs a large training set to learn. It is also hard to interpret what the network represents, even though it classifies correctly. There is also a drawback in that a network is domain specific and cannot generalize to other domains than that one used for training.
Gärdenfors (2000) means however that none of these two dominating approaches can give aspects of cognitive phenomenon such as concept acquisition a satisfactory treatment. This phenomenon involves similarity, which is hard to model in these two approaches. Gärdenfors (2000) outlines a theory of conceptual spaces (see above) as a framework for representing information on the conceptual level. In such a representation, similarity can be modeled in a natural way. He calls it conceptual representation. He claims that this is not a competing approach to symbolism and connectionism, but sees these three approaches as different levels of cognitive representation, where the levels are in terms of representational granularity. He thinks that conceptual representation can solve many of the representational problems in connectionism and symbolism. This level is independent of the symbolic level. Qualities of objects can be represented without presuming an internal language of symbols.
Gärdenfors claims that conceptual representation solves the symbol-grounding problem, at least regarding perceptual domains. The representation of perceptual domains is constrained by what is happening in the external world. Concept formation and learning can be modeled, something that cannot be done in symbolic representation. Relations in conceptual spaces between properties are intrinsically represented. For example in the domain of colors, you see from the geometrical structure that orange is closer to yellow than to blue. On the symbolic level this has to be extrinsically represented.
Similarity judgments are central for a lot of cognitive processes. Similarities must be extrinsically represented as rules or axioms on the symbolic level. In connectionism, similarities are not computed. ANNs do not involve matching to stored representations. On the other hand networks depend on similarities. In general, similar inputs give similar outputs, but that is not because similarities among the input are computed. Rather there is an overlap in the input representations for similar inputs, and this gives similar activation flows in the network. The inner product of states in the network can be computed and used externally in order to measure the similarities among the states. The inner product depends on the values of the weights, and since these are changed during learning the inner product will change as well. A network therefore can be said to represent similarity intrinsically.
In conceptual spaces the information represented must be sorted into domains. This is relevant because completely modality free concepts are rare. Domain specificity is supported in neither symbolism nor connectionism.
According to Gärdenfors (2000), all the three levels of representation mentioned are integrated in the same system of a biological cognitive system. In artificial systems, though, they are often implemented in different modules.
2.3.5 Integral and separable dimensions
The use of different metrics has played an important role within the field of cognitive psychology. When it comes to measuring similarities among multidimensional stimuli represented in a space, different metrics have been considered. The issue has been how perceived similarity of two stimuli differing on one dimension relates to the perceived similarity of stimuli differing on each of the two dimensions separately. If we know the distances d(a,b) and d(a,c) in the psychological space, what is the distance d(c,b)? To estimate the C-B distance, we could either use the Euclidean or the city-block metric (see above). The first scientific research on this topic was to find out which one of these two metrics best described the psychological process of perceiving similarities (Garner, 1974). Eventually it was clear that there was not any single metric that could describe all stimuli in the best way. The question instead turned into finding out what metric best describes different pairs of dimensional combinations. According to Garner (1974), Attneave (1950) found out that stimuli
with the dimensional combination of size and brightness and size and form were better described by the city-block metric than by the Euclidean metric. Garner (1974) continues to describe the work of Torgerson (1958) where the Euclidean metric was found to best describe stimuli with the varying dimensions brightness and saturation. Torgerson’s suggestion was that dimensional combinations that are “obvious and compelling” are best described by the city-block metric and other combinations are better described by the Euclidean metric. Shepard (1964) found the city-block metric to be better when describing circle stimuli varying in size and orientation of a radius (Garner 1974).
Garner (1974) states that all these experimental results show that there is something different about the dimensions themselves. Some combinations of dimensions conform to a Euclidean metric and other dimensional combinations conform to a city-block metric. The difference between the combinations is said to be unitariness or compactness versus distinctiveness or analyzability.
Garner terms the property of dimensions to conform to the Euclidean metric integrality, and that to conform to the city-block metric separability. Throughout this report, Garner’s terminology will be used.
2.3.6 The continuum of integrality
Garner (1974) mentions the idea that the distinction between integral and separable dimensions is not clear-cut. Instead integrality might be a continuum. He did an experiment with a square with a dot inside. The position of the dot varied vertically and horizontally. These dimensions showed typical properties of integrality, such as redundancy gain and interference (see below), but the amount of interference was much less than for the saturation and brightness dimensions, which are termed truly integral dimensions. This might indicate that the combination of saturation and brightness are more integral than that for dot position. (Ge fler exempel på detta.)
Garner (1974) says: “It does not seem very reasonable that any experimental result should have an exponent less than 1 or greater than 2, and fortunately various experimental results have always comfortably fitted between these two exponents, so
Values of the r-parameter in the Minkowski metric (see Equation 2) less than 1 violate the triangle inequality, and it gives an invalid distance function (Maddox, 1983). It may though turn out that other r-values than the between 1 and 2 provide the best fit. Hyman et al. (1967) did experiments providing data showing that the color dimensions center around the Euclidean metric, but that individual subjects’ spatial models can be found anywhere on the range from dominance to city-block. He also suggests that the more two component dimensions interact, the more the spatial model will deviate from the city-block towards the dominance end of the Minkowski continuum. As the value of the Minkowski-r varies from infinity through 1, the amount of information that one makes use of from the two dimensions increases from a minimum based on only the largest differing dimension to a maximum based on the sum of the differences on both dimensions. Thus, a changing r-value reflects changing information integration.
2.3.7 Non-metrical operational tests for separable dimensions
The distinction between integral and separable dimensional combinations were first defined according to best fitting metrics (Garner, 1974), but other ways of assessing the extent to which a stimulus is processed by the values of its dimensions or if it is processed as a unitary whole have frequently been used. If the results of the tests indicate independent processing of the dimensions, then the dimensions are termed separable. If the results indicate processing as an unanalyzable whole, then the dimensions are termed integral (Maddox, 1992). In Maddox (1992), three commonly used operational tests of separability are described, that do not take any metric notions into consideration. The three are:
• The filtering task
• The redundancy task
• The restricted classification task
Both the filtering task and the redundancy task are speeded classification tasks, where reaction time is used for assessing the separability of dimensions.
In the filtering task, four stimuli composed of two dimensions, A and B, with two values each, 1 and 2, are used, which gives the stimuli set A1B1, A1B2, A2B1, A2B2. The dimensions can for example be shape and hue. In that case the values can be square and circle, and red and green. In the filtering condition, the subjects should categorize the stimuli according to the value on one dimension as quickly as possible, e.g. to say whether a stimulus is a square or a circle. The value of the irrelevant dimension varies. In the control condition, the value on the irrelevant dimension is the same for all stimuli, i.e. the stimuli used are either A1B1 and A2B1 or A1B2 and A2B2. If the reaction time is longer for the filtering condition, then the irrelevant dimension interferes with the processing of the relevant dimension, and the dimensions are termed integral. If the reaction time instead is equal for both conditions, the combination is termed separable.
In the redundancy task, the stimuli set and the control condition are the same as above. For the redundancy condition only two of the four stimuli are used, either A1B1 and A2B2, or A1B2 and A2B1. The dimensions are correlated in such a way that correct identification of the value of one dimension gives correct identification of the value of the other dimension. Such a correlation could be that a green stimulus always has the shape of a circle. If the reaction time is shorter for the redundancy condition, then a redundancy gain has emerged, and the dimensions are classified as integral. Otherwise they are classified as separable.
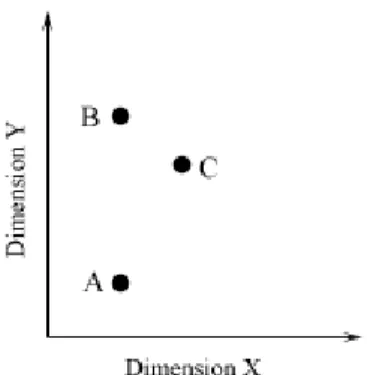
In the restricted classification task, also called the triad classification task (see e.g. Cook and Stephens 1995; Cook and Sprague 1995), three stimuli varying on two dimensions are used (Figure 4).
Figure 4. A typical stimuli configuration for the restricted classification task.
Two of the stimuli have an identical value on one dimension. The third one is very similar overall to one of the other stimuli, but does not have any values in common with either of the other two. The subject’s task is to say which two stimuli “go together” best. If the pair with one value in common are selected the most, then the dimensions are classified as separable. If the pair with close overall similarity is chosen the most, then the dimensions are judged to be integral.
A related task is the free classification task, where the subject is given a set of stimuli and told to divide them into as many classes as he or she likes, where each class can have any number of members (Garner, 1974). Common for both restricted and free classification is that classification of separable dimensions depends on the dimensional structure of the total set of stimuli. Such classification is used even if it requires that the similarity relations be ignored. For integral dimensions, the classification depends on similarities, and the classification is not sensitive to the dimensional structure (Garner, 1974).
2.3.7.1 Shortcomings with the non-metrical operational tests
One problem with the operational tests, which Maddox (1992) points out, is that it frequently happens that some test results indicate separable dimensions, while some other indicate integral dimensions, or the other way around. Maddox (1992) describes one example, where size and brightness had a redundancy gain in a redundancy task, but in a filtering task the same dimensions showed no interference. According to the first result, the dimensions should be classified as integral, but the other one indicates separable dimensions.
According to Cook and Stephens (1995), Aschkenasy and Odom (1982) have criticized the interpretation of BC groupings in triad classification tasks as indicating integral dimensions. All three stimuli differ on the Y dimension. The difference on that dimension between A and B is large. The difference on the X dimension is on the other hand small. It might be that this asymmetry affects the subjects’ choices. The salience for a dimension increases with the variability along that dimension. BC groupings might be a result of the subjects choosing the two stimuli most similar along the most varying dimension.
2.4 Developmental psychology
2.4.1 The developmental hypothesis
The concepts of integrality and separability have been applied within the field of developmental psychology as well. Researchers within the field have found that the dimensional combinations alone do not specify whether they are perceived to be integral or separable. Subject factors, such as age and maturity, also contribute to the perceived structure of a multidimensional stimulus. It has been observed that young children perceive as many dimensional combinations different from how adults do it.. The developmental psychologists have identified a trend and have formulated a hypothesis that holds that young children perceive as integral many dimensional combinations that are separable for adults (see e.g. Shepp and Swartz, 1976; Smith and Kemler,1977; Kemler, 1982). Smith and Kemler (1978) called this the
developmental hypothesis of increasing dimensional separability). According to
Chapman (1981), Shepp (1978) called this the separability hypothesis. Young children make judgments about, and sort, multidimensional stimulus objects based on overall similarity, whereas older children and adults make the same judgments based on dimensional identity.
There are a lot of empirical results in support of the hypothesis. According to Cook and Stephens (1995), the restricted classification task has often been used to prove the shift from integral to separable perception.
Smith and Kemler (1977) used the task in support of increasing stimuli separability with age. The majority of the youngest children, of age 5, classified stimuli differing in size and brightness in the same way as adults classify stimuli differing on integral dimensions. They maximize within-group similarity and minimize between-group similarity. Most of the older children, of age 11, classified the same stimuli the way that adults do it, based on the individual dimensions. Stimuli sharing a value on one dimension are grouped together, regardless of the value on the other dimension. The group of 8-year-olds mixed the two modes.
In a second task, Smith and Kemler (1977) wanted to find out whether the younger children would continue to produce classifications based on overall similarity if they were forced to be more reflective. The task was now a tetrad that should be sorted into two groups with two stimuli each. After doing that, the subject was asked to do it another way. If this could be done, the subject was asked which grouping was the best. The same tendency was found here; 5-year olds did the initial groupings based on similarity while the 11-year olds did it based on dimensional values. When asked for which of the grouping based on similarity or dimensional value was the best, the probability that dimension was chosen increased with age.
Shepp and Swartz (1976) did a speeded classification task with 6- and 9-year olds, which gave results consistent with the developmental hypothesis. The dimensional combinations tested were hue and brightness, a combination perceived as integral by adults, and color and size, which are perceived as separable by adults. For the stimuli with integral dimensions, no age related difference was found. Both groups showed no performance differences from that of adults. For the stimuli based on color and size, however, the younger children showed the typical properties of integral dimensions; facilitation in the correlated condition, and interference effects in the orthogonal condition, whereas the older children showed no difference between conditions, which is typical for separable dimensions.
There is not only two distinct ways of perceiving dimensional combinations. Kemler (1982) describes a continuum between the two extremes, from integral to separable, in three levels of perceptual organization of multidimensional stimuli. It is based on triad task results. At the first level, common for children of 3-4 years, groupings are done
based on integral relations. Overall similarity is the most salient perceptual structure. The separable dimensions are not easily or spontaneously accessed. At the next level, normal for 5- to 7-year-olds, overall similarity is still more salient than the separable dimensions, but they can be used if the child is asked to do the task in another way. At the third level, common for 10- to 11-year-olds, the individual dimensions are spontaneously accessed and preferred.
2.4.2 Two competing theories of developmental differences in object perception
The question is how this developmental difference in object perception can be explained. Ruskin and Kaye (1990) give two contrasting explanations, stressing either ability or preference. The two explanations are called the different-structure view and the similar-structure view.
The first view states that there is a developmental change in perceived stimulus structure. Younger children classify multidimensional objects after its similarity relations because an integral structure is the most elemental stimulus organization. Older children and adults do their classifications on a dimensional basis instead, because the separable stimulus structure is the most elemental. Through perceptual learning and development of abstract processes, another stimulus relation occurs, which results in perceptual differentiation of a multidimensional object into its constituent dimensions.
The second view states that children and adults perceive the structure of a stimulus similarly, but the processing strategy changes with age.
Ruskin and Kaye (1990) did two experiments with visual stimuli, one search task and one restricted classification task, to find out which of the two theories of the developmental shift is the most probable. The three groups in the experiments comprised subjects of the age 5-6, 7-8 and 11-12 years, respectively. Ruskin and Kaye found evidence against the view that young children should perceive objects according to some primitive holistic structure. Rather, less efficient visual processing may lead younger children to adopt a classification strategy that emphasizes similarity relations. The search task performance showed no differences between age groups,
classification task matched the developmental expectations. The separable stimuli where classified based on their individual dimensions and the integral stimuli where classified based on overall similarity. The intermediate stimuli where by all age groups most frequently classified by their individual dimensions, but the two youngest age groups more frequently classified by overall similarity than the older group. Ruskin and Kaye consider the results of these two experiments to show that the tendency of younger children using more similarity relations for the restricted classification is not because of any difference in perceived stimulus structure. Rather, there seems to be a difference in processing efficiency. Thus, the similar structure view seems to be the most probable.
The experiments of Smith and Kemler (1977) also indicate that even though younger children prefer a classification based on overall similarity it does not imply that they cannot access the underlying dimensions. In the tetrad task described above, the subjects were asked to justify their classifications. It was shown that there were minimal developmental differences between the age groups in the justification data. Even the youngest subjects used dimensional terms while explaining their classifications.
2.4.3 Proof against the developmental shift from integral to separable perception
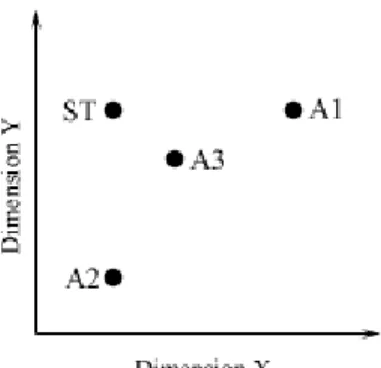
Cook is one researcher who has been involved in producing several papers that criticize the hypothesis that development goes from integral to separable perception. In his experiments he has extended the triad task with another stimuli in order to make it symmetric, as shown in Figure 5, such that subjects can group stimuli according to shared values on either dimension separately or according to overall similarity (see e.g. Cook and Sprague, 1995).
Figure 5. The tetrad structure.
Cook and Odom (1992) showed in a restricted classification task, using the tetrad structure, that there is no evidence in support of the developmental hypothesis. The younger children didn’t show any preference for overall similarity over the older children. None of the younger children used overall similarity to classify the stimuli, that is picking A3 in Figure 5 to go with ST.
Cook and Stephens (1995) support Garner’s distinction between integral and separable dimensions, but do not support the proposal that development involves a shift from integral to separable perception.
Cook and Sprague (1995) did a developmental study with 5- and 11-year-old children of separable dimensions varying on tactile dimensions. The experiment was a restricted classification task, and the dimensions were hardness, shape and texture. The result of the study did not support the hypothesis that there is a shift in development from integral to separable perception. Both age groups used separate dimensions to group the objects.
2.4.4 Other factors influencing separability
Not just subject factors, like age, and the specific dimensional combinations, but also task factors can influence in what way classifications are made. Even adults can be manipulated to do classifications based on overall similarity of stimuli with separable dimensions, instead of the normal classification based on the individual dimensions.
In six experiments, Smith and Kemler Nelson (1984) show how speed stress, presence of a concurrent task and instructions to use a first impression influence adult subjects to do classifications based on overall similarity. It is also shown that the use of similarity relations in classification of separable stimuli is not derived, but direct. Separable stimuli thus offer direct access to two kinds of stimuli relations. Since similarity relations are used under time and resource restrictions, it seems like those responses are more primary, and that they occur when a dimensional response is not possible or desired.
3. Problem statement
As mentioned above, there is a developmental hypothesis that states that young children perceive as integral many dimensional combinations that are separable for adults (se e.g. Smith and Kemler, 1978; Chapman, 1981). Small children perceive some dimensional combinations as integral, but with increasing maturity as a function of age the same dimensional combinations are perceived as separable. Smith (1980) says that how we perceive multidimensional stimuli is probably due to both the skill of the perceiver and the nature of the stimulus dimensions themselves. Ruskin and Kaye (1990) also talk about processing efficiency as an influential factor.
There is reason to believe that the same phenomenon appears when adults are confronted with multidimensional stimuli that are novel to them. If skill and processing efficiency were underlying factors for the perception of multidimensional stimuli, a short term learning situation, such as a similarity rating session, where subjects go from novelty to increasing familiarity, would yield the same pattern of increasing separability. First the dimensions are perceived as being rather integral, but then they are turning more separable as the subjects get more familiar with the stimuli.
Results from earlier experiments (Johannesson, 2001) show that there is a tendency of increasing separability when adults are confronted with unfamiliar stimuli in a short term learning situation. The test for separability used in those experiments was metric fitting of dissimilarity ratings. Johannesson performed the test for visual stimuli composed of four dimensions of both integral and separable dimensional combinations. The operational definition used in those experiments for increasing separability was a decreasing Minkowski r-value as a function of increasing familiarity with the stimuli. The best fitting Minkowski-r for the ratings of the first half of an experimental session were compared to the ratings of the last half of the session, and if the r-value was lower for the last half it indicated increased separability.
This project aims at exploring the generality of this phenomenon. In order to do this, a delimitation for the investigation has to be chosen. To find a proper delimitation,
issues such as choice of modalities, number of varying dimensions, and whether the dimensional combinations shall be integral or separable must be considered.
The structure of the stimuli presented to the subjects must first be perceived as not fully separable, because otherwise there is no possibility to find any increasing separability. Thus, the dimensional combinations that in the literature are described as typically integral would be of interest. As mentioned above, the color dimensions hue, saturation and brightness and the sound dimensions pitch and loudness are described as being prototypical examples of integral dimensions (see e.g. Kemler Nelson, 1993; Grau and Kemler Nelson, 1988). In Johannesson’s (2001) experiments, only visual stimuli were included. By looking at all the prototypical integral dimensions, both visual and auditory stimuli would be included, and this would extend the generality.
Johannesson’s experiment included stimuli varying in four dimensions. By using stimuli varying on these integral dimensions of color and sound only, the stimuli in this project would vary on two and three dimensions.
The scope for this project is thus going to be stimuli of the modalities of vision and audition, where the stimuli vary on two or three dimensions, and the dimensional combinations are integral.
It might sound odd to choose the typical integral dimensions. These dimensional combinations are the ones that are perceived as integral for both children and adults. We experience these dimensions in our entire life, but still they are perceived as being integral. Can such dimensions really turn more separable?
Integral perception does not however imply that it is impossible for the subject to access the underlying dimensions. Smith and Kemler (1977) state that separability and integrality describe the primary mode of perception, and that integral dimensions, e.g. saturation and brightness, can be integral and yet analyzable.
Even though we experience the color dimensions every day, we do not normally access the underlying dimensions separately because they are not primary to us and there is no need for us to do that in our everyday life. When you are forced to
concentrate on the same stimuli structure in a direct dissimilarity test, which can be seen as a short term learning situation, these dimensions will probably get more obvious to the subjects. If you find the phenomenon of increasing separability for these dimensions, then it is a strong indication of its general validity.
The test for increasing separability will be metric fitting of dissimilarity ratings, the same test that Johannesson (2001) used. The reason for using a metric test is that Garner (1974) first defined the distinction between integral and separable dimensions in terms of what metric they produced, and direct similarity scaling is the only one of the converging operations (Garner, 1974) that take metrics into consideration. The operational definition for increasing separability will be the one of a decreasing Minkowski-r in the present study as well. As mentioned above, developmental psychologists claim that young children perceive many dimensional combinations as integral, which by adults are perceived as separable (se e.g. Smith and Kemler, 1978; Chapman, 1981). Integral dimensions produce the Euclidean metric, with an r-value equal to 2, and separable dimensions produce the city-block metric, with an r-value equal to 1. Thus, the Minkowski-r decreases with increasing separability. This operational definition seems reasonable given these facts.
In the literature, the focus has been on the two or all three of the extreme cases of Minkowski metrics, mentioned above, with the r-values 1, 2 and infinity (e.g. Garner, 1974; Dunn, 1983; Grau and Kemler Nelson, 1988). In these experiments, the distances produced by the city-block metric and the Euclidean metric, and sometimes also the dominance metric, are compared to the ratings given by the subjects. The metric with the value closest to the given rating is regarded as the best fitting one.
In this project, the entire range of Minkowski metrics will be considered in small discrete steps (for each twentieth) from 1 to 50. In practice, an r-value of 50 corresponds to a maximum function of the Minkowski metric, i.e. r=∞.
The purpose of looking for the best fitting metric in this way is to see whether the separability increases, indicated by a decreasing Minkowski-r, and this can be the case if the metric is further away form the Euclidean metric when the subject is more
metric than to the Euclidean metric. Such changes will not be reflected if all r-value except 1 and 2 are excluded. The reason for including metrics with an r-value greater than 2 is that there might be the case that the best fitting metric does not equal an r-value of 2.0. Since you cannot know for sure how far beyond this r-value you can expect to find the best fitting metric, the whole range through the dominance metric is included.
The purpose of this project is not to test the developmental hypothesis, but to see, with inspiration from the developmental hypothesis, if stimuli structures that are perceived as integral to adults can be perceived as more separable if the familiarity, or skill, with these structures increases.
4. Method
In a similarity-rating task, such as direct similarity scaling, the subjects have to combine differences in several dimensions into one rating. This can be illustrated geometrically by calculating the distances among points. The aim of this dissertation is to find out how the subjects calculate this distance by finding the proper Minkowski-r value for each subject, which is the parameter that determines the form of the spatial metric.
The method used in this report for calculating the best fitting metric based on the subjects’ similarity ratings is based on the work of Dunn (1983).
4.1 Dunn’s method
Dunn (1983) outlines a method for determining how subjects combine differences on two dimensions. Dunn (1983) claims that there exists no single agreed upon method for determining the metric of a similarity space. One of the first attempts, according to Dunn, came from Attneave (1950).
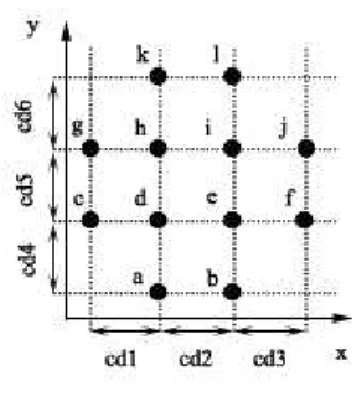
In short, the method for finding the best fitting metric for a set of similarity ratings can be described as follows. Two groups are formed out of the total set of similarity ratings, where the first one includes all unidimensional ratings for the stimuli pairs differing on one dimension, and the second one includes the bidimensional ratings for the stimuli pairs differing on two dimensions. If the spatial representation of the stimuli is a perfect metric space, and if the metric is known, the bidimensional similarities can be calculated from the unidimensional ones (Dunn, 1983).
Figure 6. 12 stimuli and their component distances (cd1-cd6). (Based on Figure 1 in Dunn, 1983).
By comparing the mean observed bidimensional dissimilarities with the mean predicted bidimensional dissimilarities for each subject, the spatial metric most appropriate for that subject can be determined.
Dunn (1983) claims that there are four requirements, or assumptions, that have to be met in order to reduce similarity ratings into distances among points in a dimensional space, and they are called correspondence, interdimensional additivity, intradimensional subtractivity and linearity.
4.1.1 Correspondence
The assumption for the correspondence requirement is that if stimuli are differing on two physical dimensions, they are also perceived by the subject as differing on two corresponding psychological dimensions. This assumption can be violated in two ways. The first violation can be detected by studying the component distances assigned by the subject to differences between stimuli on each dimension, (cd1-cd6 in Figure 6). The correspondence condition is met if the component distances are greater than zero and relatively equal for all dimensions. The second violation, which is harder to detect, is when the subject ignores the dimensional structure assumed by the experimenter, and instead chooses his or her own alternative structure. This violation mostly appears when there is an alternative physical structure available. One example is rectangles differing in height and width, which can alternatively be perceived as differing in area and shape.
The violation of the correspondence condition also commonly leads to a violation of the second condition, interdimensional additivity.
4.1.2 Interdimensional additivity
If the bidimensional differences are to be predicted from combinations of the unidimensional ones, the dimensions must meet at right angles. That is, the perceived differences along one dimension must be independent of the values of the other dimension. Dunn claims that integral dimensions have been shown to violate this requirement, since an augmentation effect appears for stimuli differing on such dimensions. This means that a constant difference along one dimension is perceived to be greater if the value on the other dimension is increased.
Interdimensional additivity can be tested for, for each subject, in so called equality tests, where the condition is met if two stimuli, differing on one dimension on a fixed amount, are assigned the same similarity rating regardless of the actual values on the dimensions. There is not always such a perfect match, and thus, what Dunn calls, plus- and minus differences are counted. In the case of unidimensional differences among stimuli, a plus difference appears when a certain distance between two stimuli on the relevant dimension is perceived to be greater if the value on the irrelevant dimension is increased. In Figure 6, this would be the case if for example a subject rate the object pair h and i to be more dissimilar than d and e. Correspondingly, a minus difference appears if an increasing value on the irrelevant dimension gives a decrease in perceived distance on the relevant dimension. In Figure 6, a subject rating the dissimilarity between d and e to be greater than between h and i would indicate this. For bidimensional differences, a plus difference is counted if the similarity ratings assigned to positively correlated differences are greater than the ones assigned to negatively correlated differences. This would be the case if a subject rated e.g. object d and i to be more dissimilar than h and e in Figure 6. Interdimensional additivity holds if the number of plus- and minus differences is the same within each set of equality tests.
4.1.3 Intradimensional subtractivity
The condition of intradimensional subtractivity suggests that any unidimensional distance can be decomposed into the sum of smaller distance components in line with Equation 8.
d(a,c)=d(a,b)+d(b,c) Equation 8
Each unidimensional difference can be expressed as the weighted sum of a set of component distances, shown in Equation 9, where d(a,b) is the distance between point
a and b, and wiab = 0 or 1.
i i iabc w b a d
∑
= = 6 1 ) , ( Equation 9 4.1.4 LinearityThe unidimensional dissimilarities, given by the subjects, have to be converted into distances in order to contrast different metrical predictions of the bidimensional dissimilarities. This is because the unidimensional distances are assumed to be mentally combined and converted to observed bidimensional dissimilarities. Thus, the function relating dissimilarities to distances has to be known. This function is assumed to be linear, both by Dunn and in the present report. In this case, Equation 10 gives the correlation.
A c w b a i i iab + =
∑
= 6 1 ) , ( δ Equation 10Equation 10 is a multiple regression equation, where (a,b) is the perceived
dissimilarity between object a and b, and A is the additive constant. The component distances form the regression coefficients.
4.1.5 Determining the spatial metric
In the equation for the Minkowski power function (Equation 1) the parameter r specifies the form of the combination rule or spatial metric. By comparing the mean observed bidimensional dissimilarity with the mean predicted bidimensional dissimilarity for each subject, the spatial metric most appropriate for each subject can be determined. An overestimation of the parameter r gives an underestimation of the predicted distance/dissimilarity, and an underestimation of r gives an overestimation
of the predicted distance/dissimilarity. Dunn (1983) uses the absolute deviation from the mean for finding the best fitting metric.
4.2 Methodology adopted
The methodology used in the present study is based on Dunn’s method, but some adjustments need to be done.
In Dunn’s (1983) paper, only stimuli differing on two dimensions were considered. In the current paper, the method has to be extended to also include three-dimensional stimuli. For the experiment with three varying dimensions in the present study, the total set of ratings from each subject has to be divided into three groups instead of two, were the extra one is for ratings between stimuli differing on three dimensions.
The four requirements that are described in Dunn’s paper are requirements that ideally should be met for a metric space. In reality, when it comes to describing a subject’s psychological conception, it is difficult to test if they are met or not. Dunn tests for interdimensional additivity by doing the sign test described above. The problem with that test is that the magnitude of the augmentation effect is irrelevant, a slight difference or a huge one both generate the same sign. Dunn also claims that integral dimensions have been shown to violate the requirement of interdimensional additivity, since an augmentation effect appears for stimuli differing on such dimensions. These augmentation effects have been found in non-metrical operational tests, such as speeded classification tasks, and the question is if the same effect appears in similarity rating task. As a matter of fact, if you had these augmentation effects in similarity ratings, a metric could never describe such a stimuli set. This is a somewhat peculiar reasoning, since Garner (1974) first defined integrality and separability according to the metric they produced.
In the present study, dimensional combinations that are well established in the literature as prototypically integral are used. The requirement that I will look at when analyzing the results of the experiment is the correspondence. This is because the correspondence requirement might be violated because of the dimensional values
chosen for the stimuli set. If the steps between the values along one dimension are perceived as very different from the ones along another dimension, the resulting ratings might be affected.
The assumption of linearity is assumed, but not tested for.
In Dunn (1983), the only predicted distances calculated were the ones for the city-block, the Euclidean and the dominance metric. The observed distances were compared to these values only. In the present study, the best fitting metric is searched for in small discrete steps in the range of metrics between 1 and 50.
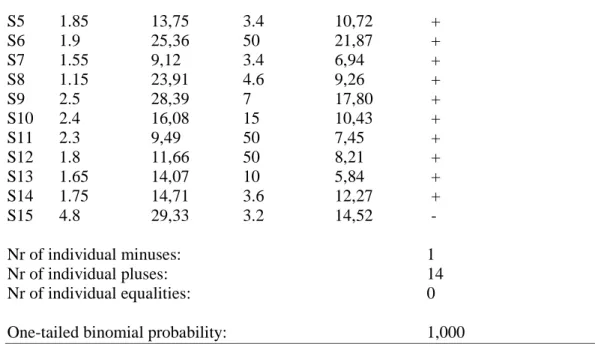
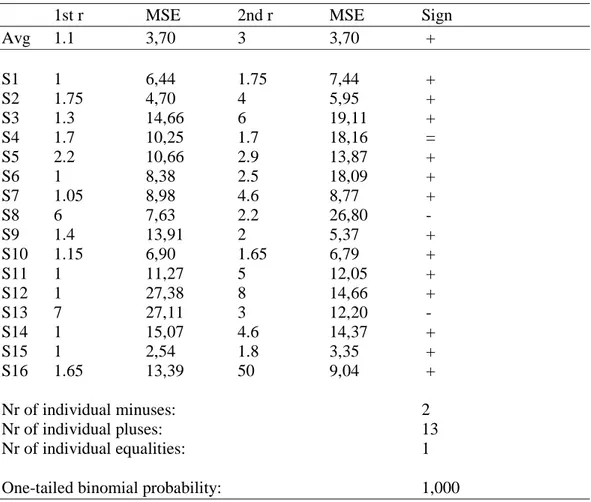
To determine the best fitting metric, Dunn (1983) uses a deviation error measure, where the best fitting r-value is the one that generates values with the lowest absolute deviation from the mean observed dissimilarities. In this report, the mean square error, MSE, is used instead (Equation 12), since it gives a more reliable measure. MSE gives bigger differences more weight than smaller differences.
N b a b a MSE b a b a / ) , ( ) , ( , 2 ~ − =
∑
≠ δ δ Equation 11The subjects will judge the similarity of all pair wise combinations of sets of stimuli. In order to see if the separability increases with familiarity, the ratings of a subject session will be divided into to halves, with the first 50 % of the appearing ratings in the first half and the rest in the second half. The best fitting metric of each half will be estimated, and the corresponding r-values will be compared. If the r-value of the second half is lower than the one for the first half, then it is in line with the hypothesis of this project.
In total, five different experiments will be conducted, one with auditory stimuli and four with visual stimuli. The stimuli used in the experiments are of two kinds, either 0.8 second sounds, varying in pitch or loudness, or pictures in shape of a circle, varying on different combinations of the three dimensions hue, saturation and brightness. All stimuli are pair wise presented by a computer program.