Den ökande globaliseringen och tillgången till internationella marknader innebär stora exportmöjligheter som kan generera tillväxt, jobb och välstånd, framförallt för länder med små inhemska marknader som Sverige. Export är det vanligaste sättet för mindre företag att komma ut på internationella marknader samtidigt som internationalisering är en komplex process och mindre företag ofta behöver stöd för att lyckas.
I rapporten International Market Exit and Re-entry: An empirical study of export pat-terns of Swedish SMEs kartläggs svenska små och medelstora företags internationali-seringsmönster. Specifikt tittar författarna på om, hur och varför företag gör exit från internationella marknader och huruvida de återvänder eller söker sig till nya markna-der. Dessutom presenterar författarna ett antal rekommendationer för hur svenska små och medelstora företag kan stödjas i sina internationaliseringssatsningar. Rapporten är författad av Lucia Naldi, professor och Andrea Kuiken, doktorand, båda Jönköping International Business School.
OB ALISERIN GSF OR UM RAPPOR T # 9
INTERNATIONAL
MARKET EXIT AND
RE-ENTRY
AN EMPIRICAL STUDY OF EXPORT
INTERNATIONAL MARKET EXIT
AND RE-ENTRY:
AN EMPIRICAL STUDY OF EXPORT PATTERNS
OF SWEDISH SME
SLucia Naldi Andrea Kuiken
© Entreprenörskapsforum, 2016 ISBN: 978-91-89301-81-8
Författare: Lucia Naldi och Andrea Kuiken
Grafisk produktion: Klas Håkansson, Entreprenörskapsforum Omslagsfoto: IStockphoto
Tryck: Örebro universitet
Entreprenörskapsforum är en oberoende stiftelse och den ledande nätverksor-ganisationen för att initiera och kommunicera policyrelevant forskning om entre-prenörskap, innovationer och småföretag. Stiftelsens verksamhet finansieras med såväl offentliga medel som av privata forskningsstiftelser, näringslivs- och andra intresseorganisationer, företag och enskilda filantroper. Författarna svarar själva för problemformulering, val av analysmodell och slutsatser i rapporten.
För mer information se www.entreprenorskapsforum.se
GLOBALISERINGSFORUMS ST YRGRUPP Karin Apelman – Exportkreditnämnden Anna Belfrage – Körsbärsträdgården Ulf Berg – Speed Identity AB Anna Hallberg – Almi
Christian Ketels – Harvard Business School Annika Lundius – styrelseproffs
Göran Marklund – Vinnova
Sara Melén – Handelshögskolan i Stockholm Jan-Eric Sundgren – Volvo
Ivo Zander – Uppsala universitet
Carl B Hamilton – Särskild rådgivare till EU-kommisionen
TIDIGARE UTGIVNA RAPPORTER FRÅN GLOBALISERINGSFORUM
#8 Level Up – Internationaliseringsfrämjande av företag med hög tillväxtpotential – Maria Adenfelt och Kristin Burrescia
#7 Utlandsfödda och företagens internationalisering – Andreas Hatzigeorgiou och Magnus Lodefalk #6 The emergence of China and India as new power houses – Cristina Chaminade, Davide Castellani and Monica Plechero
#5 Offentliga insatser för exportfinansiering – Ari Kokko
#4 Sverige som kunskapsnation – Martin Andersson, Sten Dieden & Olof Ejermo #3 Born Globals – Torbjörn Halldin
#2 Sweden’s position in the global economy – Christian Ketels #1 Internationalization competence of SMEs – Leona Achtenhagen
FÖRORD
Globaliseringsforum är Entreprenörskapsforums arena med fokus på globaliseringens effekter på entreprenörskap, mindre företag och innovationer. Syftet är att föra fram policyrelevant forskning till beslutsfattare inom såväl politiken som privat och offentlig sektor. De rapporter som presenteras och de policyrekommendationer som förs fram ska vara väl förankrade i vetenskaplig forskning.
Globaliseringsforums nionde rapport utforskar internationaliseringsmönster hos svenska små och medelstora företag (SMF) inom tillverknings- och detaljhandelssekto-rerna. Särskilt fokus läggs på internationellt marknadsutträde (exit) och återinträde. I studien undersöks även de faktorer som driver export.
Författarna finner att exportbeteendet bland svenska SMFs varierar, att såväl tillfälliga och permanenta utträden från exportmarknaderna är vanliga och att det inte är omöjligt att återinträda på den internationella marknaden vid ett senare skede. En politik för att stärka de mindre företagens internationalisering bör därför inte inriktas på att enbart stödja inträde på utländska marknader. Den bör även kanaliseras mot de SMFs som redan visat förmåga att våga sig utanför de nationella gränserna men som inte kunnat exportera på kontinuerlig basis.
Exportfrågorna lyfts även ur ett ägarperspektiv, familjeföretag framhävs t ex ha ett mer stabilt exportbeteende. Det faktum att så varierande faktorer har inverkan på exportmönstret kräver, enligt författarna, en exportpolitik som är tillräckligt flexibel. Bl a bör hänsyn tas till regionala skillnader, Jönköpings län skiljer t ex ut sig som regionen med den högsta andelen företag med ett kontinuerligt exportmönster.
Rapporten är författad av Lucia Naldi, professor och Andrea Kuiken, doktorand, båda Jönköping International Business School. Författarna svarar för de slutsatser, policyre-kommendationer och den analys som presenteras.
Stockholm i mars 2016 Johan Eklund
Vd Entreprenörskapsforum och professor Jönköping International Business School
FÖRORD 3
1. INTRODUCTION 7
1.1 Internationalization of SMEs 7 1.2 Purpose and focus of the study 9 1.3 Research methodology 9 1.4 Organization of the report 9
2. LITERATURE REVIEW 11
2.1 Internationalization patterns 11 2.2 International market exit and re-entry 12 2.3 Determinants of export patterns 14
2.3.1 Firm size 14 2.3.2 Organizational slack 15 2.3.3 Firm age 16 2.3.4 Export strategy 16 2.3.5 Family ownership 17 3. METHOD 19
3.1 Sample and data 19
3.2 Variables 19
3.3 Sample characteristics 21
3.4 Export pattern: continued exporting, exits, and re-entry 26
3.5 Firm size 29
3.6 Organizational slack 31
3.7 Firm Age 32
3.8 Export strategy 33
3.9 Family ownership 36
4. CONCLUSIONS AND RECOMMENDATIONS 37
REFERENCES 41
Chapter 1
INTRODUCTION
1.1 Internationalization of SMEs
Markets, industries and firms have become increasingly international since the middle of the twentieth century (Olejnik & Swoboda, 2012). Globalization, i e, the increa-sing integration of national and regional economies, has made internationalization an important growth strategy for small and large firms (Lamb & Liesch, 2002; Lu & Beamish, 2001). Small and medium-sized companies (SMEs) play an important role in the European economy, and the growth of SMEs is crucial for the future prosperity of European countries (”Opportunities for the internationalization of European SMEs,” 2011). Due to increasing globalization and the opportunities that this creates, SMEs have become more active players in the international market (Ruzzier, Hisrich, & Antoncic, 2006). Given the large contribution that SMEs make to the overall economy and the influence of globalization on SMEs, it is not surprising that an increasing amount of attention has been paid to the international growth of these firms (Lafuente, Stoian, Rialp, & Matlay, 2015).
Access to international markets offers several business opportunities, such as new niche markets, economies of scope and technological advantages (OECD, 2000). This is especially important for small market countries like Sweden that compete against large economies such as the United States (Julien & Ramangalahy, 2003). Exports are the main entry mode used by SMEs to internationalize, as they require relatively few resources and limited international experience is needed before entry (George, 2005). Further, exporting is important for job-creation and growth. As recently stated by the Swedish Government “For a small, export-dependent country such as Sweden, this [globalization] creates major opportunities. Exports are a linchpin of our economy; they create growth, employment and greater prosperity” (The Government of Sweden, 2015). At the same time, internationalization is seen as a complex process because it involves a wide variety of considerations and decisions (Fernández & Nieto, 2005; Welch & Paavilainen-Mäntymäki, 2014). In addition, economic globalization not only offers opportunities for international growth, it also implies increased competition and
shorter product life cycles; thus, it is more difficult for firms to succeed in international markets (Engel, Procher & Schmidt, 2013). SMEs are believed to be less equipped and capable than larger firms to address the challenges that arise from increasing globali-zation. Compared to multinational enterprises, SMEs tend to have limited resources, and they can be spread so thinly in international firms that problems with international coordination can occur (Benito & Welch, 1997; Knight & Liesch, 2002; Manolova, Brush, Edelman, & Greene, 2002). These challenges are also experienced by Swedish SMEs. In a recent press release, the Swedish government “worries that Swedish exports are losing market share” and focuses on the challenges faced by Swedish SMEs in regard to exporting (Kärrman, 2015).
Although it is clear that SMEs face a large number of challenges before and after entering a foreign market, the main focus of the research on international business— led by the Uppsala School—has been on the linear process of internationalization, whereby firms gradually increase their geographic scope and investments in foreign markets (Johanson & Vahlne, 1977). This view is also supported by studies on export development (Cavusgil, 1984a; Reid, 1981), which portray the development of exports as a processes following a sequence of stages, which range from no export or sporadic exports to regular and extensive exports (Leonidou & Katsikeas, 1996). More recently, studies have addressed the internationalization of born-global firms, i e, firms that start exporting to multiple countries almost from inception (Cavusgil & Knight, 2015; Knight & Cavusgil, 2004), thus leapfrogging the initial phase of market development in the home country (McDougall, Covin, Robinson, & Herron, 1994; McDougall & Oviatt, 1996). In addition to born globals, Bell et al (2003) suggest another internationaliza-tion pattern, the born-again globals. These are companies that have for many years focused on the home market, and when well-established in the home-market, they suddenly internationalize relatively fast.
Hence, over time, different patterns of internationalization have been suggested in the research on international business. Interestingly, none of these patterns expli-citly consider the possibility that firms can also reduce their commitment to foreign markets or exit entirely from a foreign market or that they can enter markets that are new to them or that they had previously withdrawn from (Benito, 2005; Welch & Paavilainen-Mäntymäki, 2014). This lack of focus on the different internationalization patterns that SMEs might undertake is surprising; it is unrealistic to expect firms to internationalize indefinitely (Aguilera, Filatotchev, Gospel, & Jackson, 2008). However, not only in the internationalization literature is the main focus on growth. Over the last decades, the number of export development programs that support SMEs has been increasing (Freixanet, 2012). The majority of these programs focus on encouraging international market entry (Wright, Westhead, & Ucbasaran, 2007). However, firms might also exit from foreign markets or follow a non-linear pattern of international exit and re-entry (Turcan, 2003; Vissak, 2010), which is something that export deve-lopment programs pay little attention to.
1.2 Purpose and focus of the study
The purpose of this study is twofold. First, it aims at exploring different export pat-terns of Swedish SMEs in the manufacturing and retail sectors, with a specific focus on patterns of international market exit and re-entry. Second, it aims at investigating the factors that might drive the export patterns of SMEs. We focus on export activities because most international expansion efforts by SMEs are likely to take the form of exports (Almodóvar & Rugman, 2014; OECD, 2000). The choice of the manufacturing and retail sectors is motivated by the relevance of exports in these sectors and to broadly control for any effects of industry.
Obtaining more insight into the different export patterns of SMEs, including how often firms exit from foreign markets and whether and how often they re-enter, can help policy-makers to devise policies to better support export activities by SMEs. As mentioned previously, this is a very important issue in Sweden and a top priority for the Swedish Government. For managers, such information will show that patterns of exit and re-entry might be frequent and that some flexibility in international planning might be required (Vissak & Masso, 2014).
1.3 Research methodology
In addition to a literature review, the report will present the results of a study on a ran-dom sample of 2670 Swedish SMEs. The sample was drawn from Business Retriever—a database with longitudinal data on all firms in Sweden. Financial data and information on management and board composition was obtained from Business Retriever and AMADEUS (a database of financial information for public and private companies across Europe) for the period 2005-2013. Export data is obtained from Statistics Sweden for the period 2004-2013. Descriptive statistics will be carried out.
1.4 Organization of the report
The report will be structured as follows. First, it provides a review of the literature on international patterns as well as studies on international exit and re-entry. Second, the report will empirically identify the patterns of export development of SMEs—which includes international exit and re-entry—in a sample of Swedish SMEs. Third, the report will empirically examine how the relationship between firm size, organizational slack, firm age, export strategy and family ownership influences the different export patterns, including exit and re-entry.
Chapter 2
LITERATURE REVIEW
2.1 Internationalization patterns
The main model used to explain internationalization patterns is the Uppsala model. The Uppsala model, as introduced by Johanson and Vahlne (1977), assumes that the main barrier to internationalization is the lack of knowledge about international markets. Because of this lack of knowledge, internationalization is perceived as a risky strategy, and therefore, firms will start internationalization through an entry mode that mini-mizes the risk. Once firms are international, they learn more about the foreign market and internationalization, and therefore, the perceived risk decreases; in turn, they will increase their commitment to internationalization.
Incremental models are also used to describe export development. As summarized by Leonidou and Katsikeas (1996)—despite differences in the models used to des-cribe the stages of export development—at a minimum, they each present the export processes as divided into three broad phases: pre-engagement, initial and advanced. While during the pre-engagement phase, firms typically sell goods in the home market, during the initial phase, firms engage in sporadic export activities, and in the advanced phase, they become highly committed to exporting.
Although export development is described as a linear and incremental proces-ses, some scholars have started to consider departing from this pattern. Welch and Luostarinen (1988), for example, note that firms cannot assume that international growth will be indefinite, and they should therefore be prepared to exit from markets, a phenomenon that they refer to as de-internationalization. Although there are seve-ral reasons for exiting certain markets, a permanent withdrawal from certain markets might not always be the best option (Javalgi, Deligonul, Dixit, & Cavusgil, 2011). Over time, the situation in the market is likely to change as well as the situation within the company, which can result in a decision to re-enter or re-internationalize. Re-entry is the process of re-engaging in international operations after a partial or com-plete withdrawal from foreign markets (Welch & Welch, 2009, p 568). Vissak (2010)
suggested that firms can go through several periods of increasing and decreasing internationalization, referring to this as serial non-linear internationalization.
Below, we provide an overview of the fragmented literature on international exit and re-entry, with a specific focus on the exporting activities of SMEs. Thereafter, we review the possible determinants of export patterns by SMEs, including patterns of international exit and re-entry.
2.2 International market exit and re-entry
The literature on exit from international markets is scattered, and a variety of terms are used to refer to a similar phenomenon. Boddewyn (1979) introduced the concept of foreign divestment as the opposite process of foreign direct investment and with this concept refers to the closing down of foreign operations. He argues that the foreign divestment decision is sometimes a necessity and sometimes an intended stra-tegy, driven by forces such as poor financial performance, worsening environment, organizational changes, national differences and external pressures. Later, Welch and Luostarinen (1988) introduced the concept of de-internationalization. They state that de-internationalization is the exit from foreign markets, which includes foreign divestment but also exit from exports. Welch and Luostarinen (1988) argue that de-internationalization particularly occurs in the early stages of de-internationalization when the firm is mainly involved in exports. Later, Benito and Welch (1997) argue that de-internationalization is a broader concept that not only includes exit but also a reduced engagement in or exposure to international activities. Vissak (2010) adds to this by clarifying that de-internationalization can be a change in foreign market entry mode to one that requires less commitment or a withdrawal from the foreign market. This suggests that within de-internationalization there are also different paths that can be taken. In this report, the focus is on complete withdrawal from all export activities, and partial withdrawal or a change in operation mode are not considered.
Past research has focused on differences between exporting and non-exporting firms (Wagner, 2008) and on the reasons that firms de-internationalize (Benito & Welch, 1997; Turcan, 2003). Firms that are larger, younger, more productive and capital-intensive are more likely to enter foreign markets but are also less likely to exit from export markets (Ilmakunnas & Nurmi, 2010). Moreover, many firms that start exporting fail in the first year, but those that survive the first few years of international activity tend to be more successful (Impullitti, Irarrazabal, & Opromolla, 2013; Wagner, 2008). The reasons found for why firms exit from foreign markets are various. Fletcher (2001) argues that foreign market exit is mainly a reactive approach, a response to external forces, whereas internationalization is a proactive approach whereby mana-gement plays an important role in initiating the strategy. However, Cairns, Marie Doherty, Alexander, and Quinn (2008) found in a case study that internal forces, such as a strong inward looking culture, a declining home market, persevering with a failing international strategy, and a change in management, are the main causes of exit. Later findings by Cairns, Quinn, Alexander, and Doherty (2010, p 36) show that exit from
foreign markets does not always have to be reactive, but that exit can be a result of dif-ficulties in the domestic market and inability of the leadership team to provide stability and strategic focus to maintain the current international operations as well as an effort by the leadership team to continuously renew and refocus their strategy. Turner (2011, p 199) argues that exit is mainly the result of a firm’s inability to gain legitimacy in the foreign market. It is also suggested that firms do not always exit immediately when performance is below expectations but that persistence depends on the different entry modes that are used (Benito, 2005; Benito & Welch, 1997; Impullitti et al, 2013). Most of this research has focused on the exit of large firms from international markets. Although several scholars in the area of SME internationalization have recog-nized the possibility of foreign market exit (Crick & Jones, 2000, p 67; Spence & Crick, 2006, p 534; Sui & Baum, 2014; Westhead, Wright, & Ucbasaran, 2001), relatively little research empirically addresses this issue for the case of SMEs. Crick (2004, p 577) found that the decision of a small firm to exit from export markets can be the result of a critical incident as well as the result of a variety of internal factors. In addition, he concludes that firms use the knowledge gained from past international experience and exit to identify and exploit new market opportunities. Agndal and Chetty (2007, p 1463) found that out of 57 changes in mode strategy, seven could be identified as exit from foreign markets. These changes in internationalization strategy seem to be strongly influenced by the relationships of the firm; important reasons for exit inclu-ded bankruptcy of the partner and poor performance of the partner. In line with this finding, Lafuente, Stoian, Rialp, and Matlay (2015) argue that resources, in particular in the form of social and human capital, are important for the initiation and continuation of exports, which may require network partners.
In the born-global literature, exit is addressed by observing the survival of these firms. Sapienza, Autio, George, and Zahra (2006) build on the argument that there is no simple linear relationship between firm growth and firm survival. They propose that internationalization decreases the probability of firm survival while at the same time generating opportunities that increase the probability of growth after market entry (pp 919-920). These scholars argue that internationalization decreases the chances of firm survival overall because firms have to adjust to international markets. In this case, born globals have an advantage over established firms because they do not need to unlearn old habits and routines to adjust to the international market. However, because they are new to the market and lack a reputation, born globals also have a higher failure rate than firms that internationalize more gradually or focus on the home region (Sleuwaegen & Onkelinx, 2014). In addition to knowledge resources and the ability to adjust, organizational slack is argued to play a role in the exit from foreign operations. Sui and Baum (2014) find that organizational slack resources and innova-tion resources are important for the survival of born globals in export markets but that they are less important for SMEs that internationalized gradually.
According to Welch and Welch (2009) international market exit is followed by a period in which the firm does not take actions to increase international activity. After this time-out period, the firm can re-enter the same and new foreign markets with
successfully renewed international operations. The limited research on re-internatio-nalization suggests that the re-entry into foreign markets is shaped by experiential knowledge built up over time, international networks, managerial skills and attitudes to internationalization (Welch & Welch, 2009). Hence, it can be concluded that a variety of resources are accumulated during the firm’s presence in foreign markets, which can stimulate re-entry in a later stage. Focusing more specifically on knowledge, Javalgi et al (2011) find that, when a firm exits from foreign markets, it retains a cer-tain stock of knowledge, which facilitates re-entry into the foreign market later on. In addition to knowledge, Freeman, Deligonul, and Cavusgil (2013) argue that networks are important for re-entry. Even if firms exit from foreign markets, they can maintain relationships in these markets, which can make future re-entry easier.
2.3 Determinants of export patterns
Despite differences among the various models in firm internationalization and export development—such as the number, nature and content of the stages—one sum-mary conclusion that can be drawn from the literature is that there are a number of organizational factors that can be expected to impact the export patterns of SMEs, including international market exit and re-entry (Leonidou & Katsikeas, 1996). Below, we provide a review of these factors.
2.3.1 Firm size
Firm size—as a proxy for organizational resources—is a key determinant in explaining why and how firms internationalize. According to the resource-based view, resources include all assets, capabilities, organizational processes, firm attributes, knowledge, etc that are controlled by the firm to implement strategy (Barney, 1991). The traditio-nal Uppsala model (Johanson & Vahlne, 1977) and the export development literature (Cavusgil, 1980) argue that firms need to have a certain critical mass of resources before they can internationalize, and over time, knowledge resources are obtained that stimulate growth. Generally, larger firm size is associated with the availability of production as well as financial and managerial resources, which are necessary for the internationalization of the firm (Calof, 1994; Cavusgil, 1984b). Because SMEs are more limited in their financial and managerial resources, it is less likely that these firms internationalize through foreign direct investment; instead, they use exports as the main mode of internationalization (Buckley, 1989). Several scholars have found sup-port for the idea that larger firms have a higher degree of internationalization because they have access to resources that are necessary for internationalization (Andersson, Gabrielsson, & Wictor, 2004; Bobillo, Rodríguez-Sanz, & Tejerina-Gaite, 2013; Dhanaraj & Beamish, 2003). In addition, Turcan (2003); (2011), in a conceptual framework for the foreign market exit of small firms, suggests that resources are important deter-minants in that the commitment of the entrepreneur, changes in the network of the entrepreneur and current and past experiences of the entrepreneur influence exit from foreign markets.
However, findings by Bonaccorsi (1992) and Calof (1994) suggest that size is not eve-rything and that having the right resources and managerial attitude is more important. Later works suggest that not only are resources important for internationalization but also a change in available resources can change the internationalization strategy (Calof & Beamish, 1995). A larger firm has more resources available and is therefore better able to invest in new markets and sustain these new operations. However, when the firm grows too fast, resources risk being spread to thinly across foreign markets, and firms might be unable to integrate the necessary resources and knowledge into their operations at the same pace (Manolova et al, 2002; Vermeulen & Barkema, 2002). Based on the above discussion, it can be concluded that firm size influences the inter-nationalization pattern of the firm because it gives an indication of the resources that are available for internationalization. However, when firms grow rapidly, size can also be a driver of exit because they might not be able to integrate the new resources into their operations quickly enough.
2.3.2 Organizational slack
Organizational slack is the resources that are available to the firm in excess of what is required to maintain the firm (Cyert & March, 1963). Bourgeois (1981) identified four primary functions of organizational slack: a resource to connect new actors to the organization, a resource to resolve conflict, a buffer for variance and discontinuities in the environmental demand, and a facilitator for strategic behavior. Organizational slack as a facilitator for strategic behavior can provide insight into the internationa-lization of the firm in that firms with lower levels of organizational slack are likely to be more cautious in pursuing an internationalization strategy if they do so at all (Lin, Cheng, & Liu, 2009). Moreover, organizational slack makes it possible to invest in the capabilities and competences that are necessary in a competitive environment, thus increasing the chances of survival in an international market (George, 2005). Hence, the presence of organizational slack can increase export activity and allows the firm to build capabilities and competences to maintain their presence in the foreign market. When performance in export markets is below expectations, the buffer function of organizational slack becomes important. In this situation, firms are expected to invest more to maintain their business (Kahneman & Tversky, 1979). Organizational slack can be used to enhance performance in export markets. However, when firms lack the necessary organizational slack to sustain operations in export markets, exit is more likely (Bourgeois, 1981). In this case, one would expect firms not to re-enter as long as they lack the organizational slack to pursue an international strategy again.
Although organizational slack increases the chances of survival, it can also be argued that it can result in irresponsible behavior (Levinthal & March, 1981). Thus, because firms have organizational slack, they relax their organizational controls, and strategies are undertaken that cannot be justified in terms of the expected return. Instead, specific individuals in the company or parts of the company benefit, and these types of investments are tolerated. In line with this argument, Lin (2014) found that if performance is relatively low but there is a great deal of organizational slack, firms
internationalize at a more rapid pace, but the pace of internationalization is also more irregular. If this is the case, it is more difficult for the firm to develop and adapt its strategy to the foreign market as well as acquire knowledge about the foreign market; therefore, this type of internationalization is more risky (Vermeulen & Barkema, 2002). As a result of this riskier behavior as well as poorer controls and the rapid pace of internationalization, the probability of exit from foreign markets increases.
2.3.3 Firm age
As mentioned previously, traditionally, it has been argued that firms need to build a critical mass of resources and knowledge before they internationalize (Johanson & Vahlne, 1977), meaning that firms internationalize at a later stage of development. However, in the past few decades, a distinction has been made between firms that grow gradually over time, born-again globals and born globals (Bell, McNaughton, & Young, 2001; Leonidou & Samiee, 2012; Olejnik & Swoboda, 2012; Oviatt & McDougall, 1994). Autio, Sapienza, and Almeida (2000) argue that firms that internationalize at an earlier stage of development have a learning advantage of newness compared to firms that internationalize later. Meaning that younger firms are not bound by frames of reference, past knowledge and experience or habits as older firms are. As a result, younger firms are more flexible and do not need to unlearn old habits, and therefore, they are able to internationalize more rapidly than older firms.
Sapienza et al (2006) note that growth and survival are two different outcomes; survival does not guarantee growth and not all international growth is by definition profitable. Sleuwaegen and Onkelinx (2014) found in a sample of Belgian firms that not only do born globals have a higher speed of internationalization than SMEs following the traditional approach, they also show a higher rate of failure. The main reason for this higher failure rate is the liability of newness that these young firms face in the home and foreign market. Moreover, younger firms do not have a reputation or his-tory of excellence to rely on when a strategic error is made; thus, the likelihood of exit from export markets increases (Sapienza et al, 2006). Because small, young firms often have relatively fewer resources than established firms, they also have less resources to rely upon for their survival in the export market, and hence, exit from export markets is more likely in the case of young firms than established firms (Sui & Baum, 2014). Based on the above discussion, it can be concluded that older firms are less likely to exit from foreign markets than younger firms. However, due to the flexibility of younger firms, if they survive exit from the export market, they might be able to grow in the home market and over time build resources and use their past experience for a more successful re-entry into the export market.
2.3.4 Export strategy
Ghemawat (2003) argues that the world is currently characterized by semi-globalization, which has implications for the strategic decisions of firms. If countries were entirely separated from each other by national boundaries, firms could consider their strate-gic decisions on a country-by-country basis. If markets were completely integrated,
multiple countries at once could be considered. Rugman and Verbeke (2004) suggest that because of semi-globalization, one can observe regionalization. That is, firms have a stronger international presence in their home region than in other regions. To successfully internationalize and expand the reach of the firm to different regions, it remains important to learn about the markets and make decisions on which coun-try to enter based on similarities in cultures (Barkema & Drogendijk, 2007). Arregle, Miller, Hitt, and Beamish (2013) suggest that in this process, firms compare not only cultural differences among regions but also the countries within one region; based on this information, they decide which country to enter. Once the firm has entered one country in a region and learned about doing business there, entry into other countries in the region is easier if the firm has built up region-based advantages. However, this is only possible if firms are able to build specific regional advantages.
In line with this idea, Oh and Contractor (2012, 2014) suggest that home region-specific advantages that are built up over time might not apply in a new region, and therefore expansion in the home region increases firm performance, whereas expansion into countries within a new region decreases the performance of the firm. Moreover, when firms operate across a variety of regions, the complexity and diversity of operations can become too large to manage properly, and exit becomes more likely (Qian, Li, & Rugman, 2013). Subsequently, based on past experience, it is likely that, if these firms re-enter, they will first choose countries in the home region instead of those in more distant regions.
2.3.5 Family ownership
Several scholars have suggested in the last years that ownership can influence the internationalization of firms (Gallo & Sveen, 1991; George, Wiklund, & Zahra, 2005; Gomez-Mejia, Makri, & Kintana, 2010; Sanchez-Bueno & Usero, 2014). Generally, a distinction is made between the Anglo-Saxon and the Continental European corpo-rate governance model. The Anglo-Saxon model is characterized by short-term equity finance, dispersed ownership and strong shareholder rights, whereas the Continental European model is characterized by long-term debt financing, concentrated owner-ship and weak shareholder rights (Aguilera & Jackson, 2010). Based on this, compared to, for example, the United States, Sweden has a relatively high concentration of ownership, and owners face fewer formal rules and regulations that constrain their behavior (Lubatkin, Lane, Collin, & Very, 2005).
In particular, family ownership versus non-family ownership has received a signifi-cant amount of attention, not in the least because family firms can be found among the most long-lived and successful firms in the world (Miller & Le Breton-Miller, 2003). In Sweden, approximately 75 percent of all the firms are family owned, and these firms count for approximately 20 percent of GDP (”Blod och affärer - om familjeföretagens lysande framtid,” 2014). Although family firms are not by definition the same as SMEs, in the Swedish context, many family firms can be found in the SME category (Brunk & Wahman, 2008). Family firms are organizations in which ownership is concentrated in the hands of one or a few families and the overlap between the family and work
environment results in a strong family influence on the key decisions and strategy of the firm (Sharma, Melin, & Nordqvist, 2014). Research has suggested that this overlap between ownership and control can influence the internationalization of family firms in different ways.
Gallo and Sveen (1991) suggested a number of factors that can stimulate and restrain the internationalization of family firms. On the one hand, due to the closed ownership structure, there is limited access to the resources and knowledge that are necessary to internationalize. Moreover, different goals within the family and possible fears of losing control over the business can restrain the firm in the internationali-zation process. On the other hand, many family firms have a long-term focus and a willingness to keep the business in the family, which is necessary to make internatio-nalization successful (Gallo & Sveen, 1991; Litz, 1995). Gallo and Pont (1996) observed that international family firms initiated internationalization later than their non-family counterparts and show a lower level of international commitment. They find that these observations are in the first place influenced by the owner’s long term com-mitment, the interest of family members in pursuing an internationalization strategy and the speed of decision making and concentration of power by an individual. Zahra (2003) found, for a sample of U.S. manufacturing firms, that family ownership and involvement had a positive effect on the internationalization of firms. They argue that this positive relationship results from the owner’s long-term focus and concern with the family’s wealth and future involvement in the business. Gomez-Mejia, Makri, and Kintana (2010) find that family firms diversify less, and if they do diversify, they prefer to do so on a national rather than international basis. Generally, it has been found that family firms internationalize later than non-family firms but that they tend to follow a gradual path to internationalization due to risk aversion, limited resources and the lack of a commitment to an international strategy (Claver, Rienda, & Quer, 2007; Graves & Thomas, 2008; Kontinen & Ojala, 2012; Pukall & Calabrò, 2014). For reasons that are similar to why family firms show a different pattern of internationalization, it is also argued that patterns of exit from operations are different for family firms (Feldman, Amit, & Villalonga, 2013; Sharma & Manikutty, 2005). Hence, one would expect that family ownership not only results in a more gradual internationalization pattern but also that exit is less likely to occur.
Chapter 3
METHOD
3.1 Sample and data
Statistics provided by the European Commission show that 99.9 percent of all Swedish firms can be categorized as SMEs. These SMEs account for 65.8 percent of total Swedish employment and 59 percent of the value added (”SBA Factsheet Sweden,” 2014). Of these SMEs, 5.2 percent have between 10-250 employees, and these account for 39.1 percent of total employment, and 37.2 percent of the value added is generated by these firms. Hence, this relatively small group of firms makes a relatively large contribution to the Swedish economy, and therefore, a better understanding of their international growth can help policy makers to target this group better.
For the selection of the sample in this study, we adhered to the following selec-tion criteria: 1) less than 250 employees; 2) active in manufacturing (NACE 10-33) or retail (NACE 45-47) industry; 3) independent. Based on these criteria, we drew a random sample of 2670 Swedish SMEs from Business Retriever—a database with longitudinal data on all firms in Sweden, including information on their management and board composition. For each firm, we complemented the information obtained from Business Retriever with data drawn from AMADEUS (a database containing the financial information of public and private companies across Europe). The financial data and information on failure—or a change in status—is obtained from Business Retriever for the period 2005-2013. Export data is obtained from Statistics Sweden for the period 2004-2013.
3.2 Variables
To identify the different export patterns of SMEs and to test what organizational fac-tors might determine them, we use the following variables.
To capture the export patterns of SMEs during the years under study, we created a time-varying categorical variable comprising four categories: 1) not international, 2) international, 3) exit, 4) re-entry. In year t, the firms are either in category 1 (not
international) or in category 2 (international). One possible pattern is that they remain in these categories for the entire period of observation. In year t+1, those firms that were international in year t but not in year t+1 are categorized as exit (category 3). In year t+2, the firms that were in category 3 in year t+1 and did not export in t+2 remain in category 3, but if these firms have exports in year t+2, they are categorized as re-entry (category 4) and remain in that category from that point onwards. This approach is applied to all the firms, for all the years. In line with previous research (Andersson et al, 2004; Ilmakunnas & Nurmi, 2010; Sui & Baum, 2014), firm size is measured by the number of employees and sales turnover. We also created two dummy variables, one for small firms—at least 10 employees—and one for medium-sized firms—40-249 employees.
Three types of organizational slack measures will be included. Absorbed slack is mea-sured as the ratio of selling and general and administrative expenses to sales (Iyer & Miller, 2008; Singh, 1986). Unabsorbed slack is measured as the ratio of current assets to current liabilities (Iyer & Miller, 2008; Singh, 1986). To measure firm age, we used the number of years since registration as well as three dummy variables capturing the firm’s developmental stage: young firms—between 0 and 10 years of age—adolescent firms—between 11 and 30 years of age—and mature firms—older than 30 years of age.
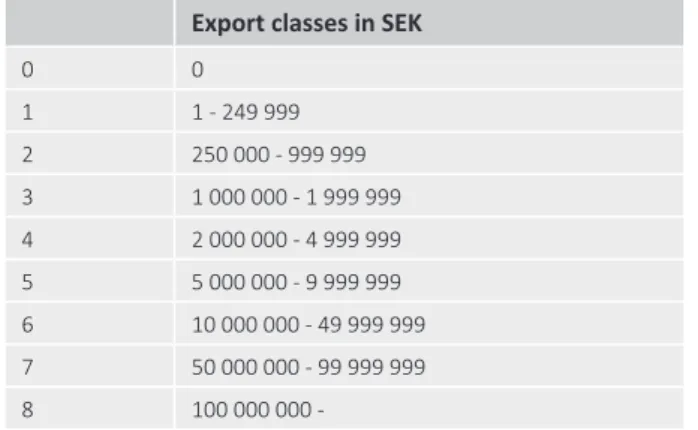
The export strategy is determined by the region that the firm is exporting to. Eight regions are included in our data: 1) Scandinavia, 2) EU countries (excluding the Nordic countries), 3) Remaining European countries, 4) Asia, 5) the Middle East, 6) North and Central America, 7) South America, and 8) Africa. To measure the home vs global orientation of a firm’s export strategy, we also created a dummy variable capturing whether the firm exported only to countries in Scandinavia or also to countries in other regions in the world. We also measured export scale—that is, how much a firm exports—and export scope—that is, how many regions the firm exports to. Export scale was measured by an ordinal variable comprising the eight classes reported in Table 3.1
TABLE 3.1 Export classes
Export classes in SEK
0 0 1 1 - 249 999 2 250 000 - 999 999 3 1 000 000 - 1 999 999 4 2 000 000 - 4 999 999 5 5 000 000 - 9 999 999 6 10 000 000 - 49 999 999 7 50 000 000 - 99 999 999 8 100 000 000
-Export scope was measured by the number of different regions to which the firm exported.
Family Ownership is captured by a dummy variable, where 0 is non-family owner-ship and 1 is family ownerowner-ship. Following the prior research, a firm is categorized as a family-owned firm if two or more managers and directors have the same last name (Arosa, Iturralde, & Maseda, 2010; Gomez-Mejia, Makri, & Larraza-Kintana, 2010).
3.3 Sample characteristics
Approximately half of the companies in our sample can be characterized as being international at the end of our observation period. As illustrated in table 3.2, this is a slight increase in international activity compared to the 2004 figures.
TABLE 3.2 Percentage of firms that are exporting
The emphasis here is on exporting, but many of these firms are also importing. There is a positive correlation of 0.47 between the size of exports and the size of imports.
FIGURE 3.1: Division of exporting firms by industry
Freq Percent
Not exporti ng 2004 1,408 52.73%
Not exporti ng 2013 1,343 50.30%
Exporti ng 2004 1,262 47.27%
Exporti ng 2013 1,327 49.70%
1: Manufacturing of consumer goods 2: Manufacturing of industrial goods 3: Manufacturing of transport equipment, furniture and others
4: Wholesale and retailing
Percentage of exporting firms in each industry - 2013 1. 2. 3. 4. 42,3%. 34,6%. 6,402%. 16,69%
One of the selection criteria was classification within the retail or manufacturing indu-stry as determined by the 2-digit NACE code. In figure 3.1, we visualize the division of the exporting companies over the different industries for the year 2013. This reveals that a large share of the exporting firms are in the wholesale and retail industry, followed by the manufacturing of industrial goods. The manufacturing of industrial goods includes, among others, manufacturing of metal products, articles of concrete, cement and plaster and manufacturing of plastic products (http://ec.europa.eu/com-petition/mergers/cases/index/nace_all.html).
In figure 3.2, the distribution between small and medium-sized companies for the different years is visualized. On average, approximately 80 percent of the firms can be categorized as small firms and 20 percent as medium-size firms.
FIGURE 3.2: Size of exporting companies
The average age of the companies in our sample was 26.5 years in 2013. Overall, 26 percent of the firms can be labeled young firms, i e, younger than 10 years. 29 percent of the firms are identified as adolescent, i e, between 10 and 30 years old, and finally, 26 percent of the firms are mature firms, i e, older than 30 years. Figure 3.3 shows the percentage of non-exporting firms by age group in 2013, while figure 3.4 shows the percentage of exporting firms by age group in 2013. More than half of the exporting firms can be identified as adolescents, and the share of mature companies among the exporting firms is larger than among the firms that are not exporting. The fact that exporting increases with firm age emerges also when the percentages of exporting
80 60 40 20 0 Per cen t 2005 2006 2007 2008 2009 2010 2011 2012 2013 Sum of small Sum of medium
firms per age group in 2013 (these data are not shown in a table) are considered. While only 27 percent of young firms export, exporting is common among mature firms—almost 64 percent of the firms that are older than 30 years export.
FIGURE 3.3: Age group of non-exporting firms
FIGURE 3.4: Age class of exporting firms
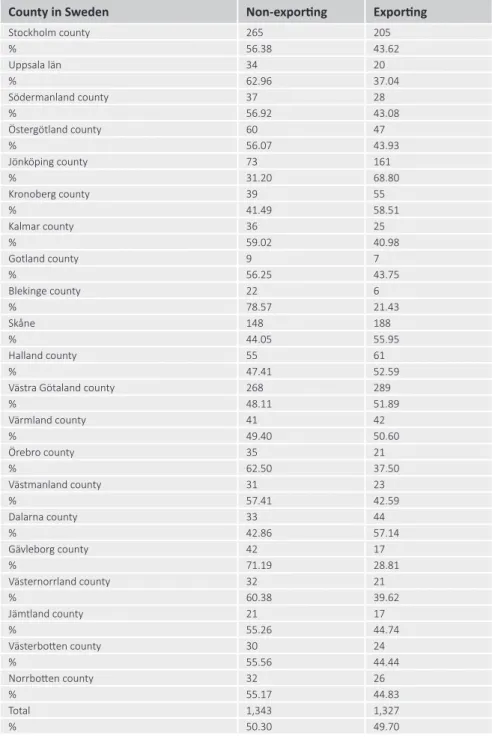
In terms of location, exporting firms are scattered throughout Sweden (see Table 3.3). Interestingly, the regions with the higher proportion of exporting firms are Jönköping county (68.8) followed by Dalarnas county (57.1). These figures are interesting, as one would have expected the regions with the highest proportion of exporting firms to include, for example, Skåne, whose main city Malmö neighbors Copenhagen.
Young 26% Mature 21% Adolescent 53% Young 10% Adolescent 52% Mature 38%
TABLE 3.3: Exporting and non-exporting companies by Swedish county in 2013
County in Sweden Non-exporti ng Exporti ng
Stockholm county 265 205 % 56.38 43.62 Uppsala län 34 20 % 62.96 37.04 Södermanland county 37 28 % 56.92 43.08 Östergötland county 60 47 % 56.07 43.93 Jönköping county 73 161 % 31.20 68.80 Kronoberg county 39 55 % 41.49 58.51 Kalmar county 36 25 % 59.02 40.98 Gotland county 9 7 % 56.25 43.75 Blekinge county 22 6 % 78.57 21.43 Skåne 148 188 % 44.05 55.95 Halland county 55 61 % 47.41 52.59 Västra Götaland county 268 289 % 48.11 51.89 Värmland county 41 42 % 49.40 50.60 Örebro county 35 21 % 62.50 37.50 Västmanland county 31 23 % 57.41 42.59 Dalarna county 33 44 % 42.86 57.14 Gävleborg county 42 17 % 71.19 28.81 Västernorrland county 32 21 % 60.38 39.62 Jämtland county 21 17 % 55.26 44.74 Västerbott en county 30 24 % 55.56 44.44 Norrbott en county 32 26 % 55.17 44.83 Total 1,343 1,327 % 50.30 49.70
The scale and scope of exports are displayed in Figure 3.5 and Figure 3.6, respectively. The majority of firms in our sample export up to 5 000 000 SEK yearly and serve an average of 2.8 regions in the world.
FIGURE 3.5: Export scale in terms of export classes
FIGURE 3.6: Export scope in terms of number of regions in the world 4% 4% 18% 10% 15% 9% 16% 24% 1 - 249 999 250 000 - 999 999 1 000 000 - 1 999 999 2 000 000 - 4 999 999 5 000 000 - 9 999 999 10 000 000 - 49 999 999 50 000 000 - 99 999 999 100 000 000 -2004 2005 2006 2007 2008 2009 2010 2011 2012 2013 Number of regions (mean) 2,73 2,75 2,71 2,75 2,74 2,75 2,86 2,88 2,89 2,92
Scope of exports: Number of regions
2,95 2,9 2,85 2,8 2,75 2,7 2,65 2,6
The average number of regions increases very slowly in the last years, with the largest increase between 2009 and 2010 (Figure 3.6). While this increase is not impressive, the shifts between the number of export regions shows that there are more changes than Figure 3.6 might suggest. These changes are illustrated in table 3.4.
TABLE 3.4: Changes in export scope over the 10-year period
Table 3.4 shows that overall, 23.3 percent of the time the firms in our sample had a scope of one region, and 31.1 percent of the time firms focused on two foreign regions. Moreover, this table shows the shift between the focus on different regions. Of the firms that focused on a single region, 70.9 percent of the firms did not change this focus, whereas, for example, 24 percent of these firms increased their scope to two regions. However, we observe not only an increase in scope but also a decline. For example, of the firms that were present in three regions, 28.6 percent reduced their presence to two regions at some point in the ten-year period.
3.4 Export pattern: continued exporting, exits, and re-entry
Now, we examine export patterns in more detail. To this end, we divided into three groups the firms that at some point during the ten years under study had exported: 1) continuously exporting firms—comprising export firms that had never left the export market, 2) permanent exit—comprising those firms that had exited the export market and never re-entered during the period under study, and 3) exit and re-entry—com-prising firms that exited and re-entered. Hereafter, we will label these three groups as ‘continuously exporting’, ‘exit’ and ‘re-entry’.
As shown in Table 3.5, while 60 percent of the firms have had a steady pre-sence in the export market, the remaining 40 percent have shown more sporadic export behavior. Of the firms that stopped exporting entirely, 34 percent were unregistered shortly thereafter; in other words, they either failed or were bought by another company. Of the firms characterized by sporadic export behavior, half
Export scope 1 2 3 4 5 6 7 8 Total 1 70,9 24,0 4,2 0,6 0,3 0,1 0 0 100 2 17,7 62,9 15,8 3,1 0,5 0,03 0,03 0 100 3 5,4 28,6 44,1 17,1 3,9 0,9 0,1 0 100 4 1,6 8,7 26,8 39,1 17,7 5,1 0,8 0,4 100 5 0,1 2,4 7,3 24,5 43,4 17,5 4,2 0,6 100 6 0,2 0,2 1,5 8,2 24,3 39,1 22,8 3,7 100 7 0 0,5 0,5 2,4 6,0 25,2 46,7 18,8 100 8 0 0,2 0 0,7 0 2,9 15,5 80,8 100 Total 23,3 31,1 16,3 9,8 6,9 4,7 3,8 4,1 100
exited permanently (at least during the time under study) from the export market, while the other half re-entered at some point. Based on this, one can conclude that the firms in our sample do not follow the linear pattern that many export development models predict.
TABLE 3.5: Export pattern in 2013
Table 3.6 reports the export pattern in 2013 by Swedish Region. Closer observation of where the firms are established shows that Jönköpings coutny is the region with the highest proportion of firms that exhibit a continuous exporting pattern (78.45 percent). One explanation could be the entrepreneurial spirit of the firms in this region (Johansson & Rylander, 2012), which is an important driver of SME internationalization (Acedo & Jones, 2007). The region with the highest percentage of exporting firms with permanent exit is Blekinge, where 50 percent of the firms stopped exporting entirely. Re-entry was most common in Örebro county.
In terms of industries, Figure 3.7 shows that continuous exporting is more common among manufacturing firms. Further, compared to retail firms, there are fewer manufac-turing firms that exit and re-enter the export market. Nonetheless, the different export patterns are displayed by firms across both industries; even among manufacturing firms there are firms that exit permanently or exit and then re-enter foreign markets.
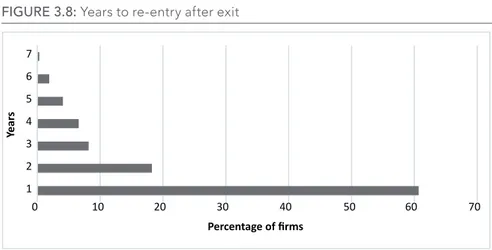
The majority of firms that re-enter the export market after exit re-entered either after one year (60.70 percent) or after two years (18.24 percent). Only 8.1 percent of the firms re-enter after three 3 years, and 6.6% of firms re-enter after 4 years. These figures, which are plotted in Figure 3.8, suggest an intermittent pattern of exit and re-entry.
In the next sections, we discuss in more detail a variety of determinants of export behavior.
Number Percentage Total
Conti nuous exporti ng 1105 60,55 60,55
Exit 371 20,33 80,88
TABLE 3.6: Export patterns by Swedish county in 2013
County Conti nuous exporti ng Exit Re-entry
Stockholm county 165 61 67 % 56.31 20.82 22.87 Uppsala county 17 6 9 % 53.13 18.75 28.13 Södermanland county 26 11 7 % 59.09 25.00 15.91 Östergötland county 35 11 15 % 57.38 18.03 24.59 Jönköping county 142 20 19 % 78.45 11.05 10.50 Kronoberg county 47 11 14 % 65.28 15.28 19.44 Kalmar county 21 12 8 % 51.22 29.27 19.51 Gotland county 6 3 1 % 60.00 30.00 10.00 Blekinge county 5 9 4 % 27.78 50.00 22.22 Skåne county 163 42 35 % 67.92 17.50 14.58 Halland county 52 18 8 % 66.67 23.08 10.26 Västra Götaland county 231 72 84 % 59.69 18.60 21.71 Värmland county 33 18 9 % 55.00 30.00 15.00 Örebro county 18 8 12 % 47.37 21.05 31.58 Västmanland county 16 7 6 % 55.17 24.14 20.69 Dalarna county 34 14 10 % 58.62 24.14 17.24 Gävleborg county 15 18 6 % 38.46 46.15 15.38 Västernorrland county 15 8 7 % 50.00 26.67 23.33 Jämtland county 14 2 6 % 63.64 9.09 27.27 Västerbott en county 20 11 5 % 55.56 30.59 13.89 Norrbott en county 21 7 8 % 58.33 19.44 22.22 Total 1096 369 340 % 60.72 20.44 18.84
FIGURE 3.7: Export pattern by industry group in 2013 (cell percentages)
FIGURE 3.8: Years to re-entry after exit
3.5 Firm size
The literature has argued that firm size—as a proxy of organizational resources—is an important determinant of internationalization. Figure 3.9 shows that a relatively larger share of medium-sized firms (50-250 employees) than small firms (10-50 employees) are exporting in 2013. In addition, the share of medium-sized firms that exits either permanently or temporarily is lower than the share of small firms that exhibit the same export behavior. These numbers suggest that on average, medium-size firms are more likely to export and less likely to exit and re-enter than small firms.
40 35 30 25 20 15 10 5 0 Pe rce nt ag e of firms Continuos exporting 35,62 24,93 Manufacturing Retail Exit 10,52 9,81 Re-entry 8,82 10,3 7 6 5 4 3 2 1 0 10 20 30 40 50 60 70 Year s Percentage of firms
FIGURE 3.9: Export pattern by firm size in 2013
TABLE 3.7: Firm size (number of employees) by export pattern
TABLE 3.8: Firm size (sales turnover) by export pattern
Note: * in thousands of SEK.
Continuos exporting Exit Re-entry Medium-sized firms Medium-sized firms 81,6 6,9 11,5 20,2 13,9 65,9 0% 65,9 13,9 20,2 81,6 6,9 11,5 20% 40% 60% 80% 100% Small firms Continuos exporting Exit Re-entry Small firms
Number of employees (average) Exporti ng 33.92
Exit 23.81
Re-entry 26.48
Total 31.93
Sales turnover* (average) Exporti ng 91244.5
Exit 60042.6
Re-entry 78003.2
A similar conclusion can also be drawn from Table 3.7, which shows the average size—in terms of number of employees—of the firms in each export pattern group. Firms that exhibit a steady export pattern are larger than firms that exit from export markets. In addition, firms that re-enter are on average larger than firms that exit and do not re-enter. Unsurprisingly, the same trend emerges when consi-dering sales turnover (Table 3.8). In sum, these finding confirm the prior research that larger firms have more resources and are therefore in a better position to invest in export markets and to sustain these operations. For the same reasons, the firms that re-enter foreign markets after exiting are larger than those that exit permanently.
3.6 Organizational slack
Slack resources are seen as “the pool of resources in an organization that is in excess of the minimum necessary to produce a given level of organizational output” (Nohria & Gulati, 1996: 1246) As such, they are important stimuli for firms pursuing foreign markets and can influence the extent to which such firms commit themselves to exporting (Reid, 1983). The prior research has shown that different forms of slack resources have different effects on firms (Lin, Liu, & Cheng, 2011). Accordingly, in the analysis, we consider two forms of slack resources: unabsorbed slack (the excess, uncommitted liquid resources) and absorbed slack (resources that are embedded in the firm as excess costs and that are difficult to be redeployed). As shown in Figure 3.10 and Figure 3.11, our study shows that unabsorbed slack is higher among firms that exit permanently from export markets, whereas absorbed slack is higher among firms that export on a continuous basis. This finding is in line with the prior research. Unobserved slack is more likely to be used to help the firm experiment with new strategies, such as entering export markets (Huang & Chen, 2010). However, these experiments might not turn into export activities to which the firm can commit in the long term. As prior studies have shown, with a high level of unobserved slack, firms tend to engage in investments that lack focus (Tan & Peng, 2003), which might prove to be divestments.
Instead, absorbed slack is higher among firms with a steady presence in the export market. This finding is also in line with the prior research. Absorbed slack is seen as acting as an internal shock absorber, providing the necessary resources to make new activities progress over time (Huang & Chen, 2010), such as continuous exporting.
FIGURE 3.10: Unabsorbed slack resources by export pattern
FIGURE 3.11: Absorbed slack resources by export pattern
3.7
Firm age
According to the literature older firms have obtained more experience and knowledge and therefore are more likely to internationalize. Table 4.9 shows that almost 70% of mature firms—which are older than 30 years of age—have displayed a steady presence in the export market during the period under study. Young firms, instead, are almost equally distributed among those that displayed a steady export presence, and those that exited either permanently or temporarily. Hence, it seems like the more mature the firm is the more stable their exports are.
However, when considering the average age of the firms in each export pattern group (Table 4.10), there is almost no difference in the average age (approx. 25 years) of the firms that export on a continuous basis and the firms that display a more spo-radic export behavior—exiting and re-entering from export market. Instead, firms that belong to the group that have permanently exited the export market seem to be somewhat younger—of 21.5 years on average. One explanation could be that many firms in our sample are adolescent firms—that it is, firms between 10 and 30 years old. These firms display an intermitted export behavior.
Export pattern
Continued exporting Exit Re-entry 30 20 10 0 Unab sorbed slack Export pattern
Continued exporting Exit Re-entry 0,15 0,10 0,05 0,00 Ab sorbed slack
TABLE 3.9: Export, exit and re-entry by firm-age class in 2013
Note: Row percentages
TABLE 3.10: Firm age by export pattern
3.8 Export strategy
In this section, we look at the export strategy. An important differentiation is made in the internationalization literature between exporting to countries in a firm’s home region versus exporting to countries outside its home region. Indeed, it is argued that firms, especially if small and medium-sized, operate regionally, not globally (Almodóvar & Rugman, 2014). Thus, we first distinguished between firms in our sample that export only to their home region (Scandinavia) and those that also exported to countries in other regions in the world.
Table 3.11 shows that the vast majority of the firms that exhibit a steady presence in the export market are also active outside Scandinavia. This is also true for firms that exhibit more sporadic export behavior. Over two-thirds of these firms export outside
Conti nuous
Exporti ng Exit Re-entry Total
Young 108 79 38 225 % 48.00 35.11 16.89 100.00 Adolescent 563 206 203 972 % 57.92 21.19 20.88 100.00 Mature 434 86 108 628 % 69.11 13.69 17.20 100.00 Total 1,105 371 349 1,825 % 60.55 20.33 19.12 100.00 Age (mean) Exporti ng 25.73 Exit 21.47 Rentry 25.69 Total 25.15
the home region. These figures are interesting as they run counter to the prevailing view that small and medium-sized companies are very much regionally bound.
This conclusion is only partly supported by Figure 3.12, which reports the regions in the world that are served by both the firms that in 2013 had displayed continuous exporting and the firms that had re-entered export markets after exiting. While some of the firms in the latter group—firms that re-entered after exiting—also entered more distant markets, their main focus was Scandinavia and the European Union.
TABLE 3.11: Export strategy (Scandinavia vs other regions) by export pattern in 2013
FIGURE 3.12: Regions of export by export pattern in 2013
We looked more closely at the firms that re-entered. Because it is argued that medium-sized firms have more resources at their disposal for internationalization, it is possible that these firms re-enter in a larger variety of countries. Table 3.12 shows the presence
Export strategy Also other regions Only Scandinavia
Conti niuous exporti ng 1,003 102 1,105
% 90.77 9.23 100.00 Re-entry 117 53 170 % 68.82 31.18 100.00 Total 1,12 155 1,275 87.84 12.16 100.00 Africa South America North-Center America Far East Asia Rest of Europe EU Scandinavia 0 0,1 0,2 0,3 0,4 0,5 0,6 0,7 0,8 0,9 1 Re-entry Continued Exporting
CHAPTER 3 METHOD
in different regions in the world for small and medium-sized firms after re-entry. In total, 227 small firms and 29 medium-sized firms re-entered exports after exit. The data is from 2013.
TABLE 3.12: Regions of export and size-class of firms that re-entered after exit (2013)
Note: Row percentages.
Table 3.12 does not show much difference between the small-and medium-sized firms in terms of their export strategy when they re-enter. For example, of the small firms that re-entered, 35.2% were active in Scandinavia. Only a slightly higher per-centage of the medium-sized firms that re-entered were active in Scandinavia. The share of firms that did enter South America, Asia and Africa is only slightly higher for the medium-sized companies.
Also, firm age can influence the export strategy after re-entry. Table 3.13, which reports the presence in different regions in the world of young, adolescent and mature firms after re-entry, illustrates that adolescent and mature firms in par-ticular have entered a larger number of regions, whereas the young firms mainly focus on Scandinavia and the European Union. Perhaps young firms have less experience and fewer networks to build upon to re-enter foreign markets after having stopped exporting.
TABLE 3.13: Regions of export and age-class of firms that re-entered (2013)
Note: Row percentages.
To conclude, this section shows that firms that continued to export until 2013 have a greater geographical diversification in their export strategy. Although firm size did not seem to make a difference with respect to the export strategy when re-entering, a difference can be observed when the age of the firms is considered; perhaps older
Scandi-navia European Union Rest of Europe Asia Far East
North & Central America South America Africa Small mean 0,352 0,339 0,044 0,018 0,031 0,044 0,013 0,018 Medium-sized mean 0,379 0,379 0,069 0,034 0,034 0 0,034 0,034 Total mean 0,355 0,344 0,047 0,02 0,031 0,039 0,016 0,02
Scandi-navia European Union Rest of Europe Asia Far East
North & Central America South America Africa Young fi rms mean 0.211 0.184 0 0 0 0 0.026 0 Adolescent fi rms mean 0.320 0.305 0.056 0.031 0.041 0.061 0.010 0.020 Mature fi rms mean 0.324 0.286 0.038 0.010 0.029 0.010 0.010 0.010 Total mean 0.309 0.285 0.044 0.021 0.032 0.038 0.012 0.015
firms have built up a larger network and more experience over the years, which makes it more likely that these firms enter into a larger variety of foreign markets (Cavusgil, 1980).
3.9 Family ownership
Family ownership can influence strategic decisions, including internationalization. Table 3.14 shows the percentage of family and non-family-owned firms that had continued exporting, exited permanently and exit and re-entered in 2013. The data show that almost 70 percent of the firms that continued to export over time are family owned. Instead, among the firms that exited permanently, the majority (57.14 percent) are not family owned. Further, relatively more family-firms re-entered exports than non-family-owned firms.
TABLE 3:14: Export pattern for family vs non-family-owned firms
The first observation that relatively more family-owned firms continue to export can be attributed to patient capital and long-term orientation, which characterize family firms. In addition, the fact that family-owned firms are re-entering into exports relatively more than non-family-owned firms is interesting. A possible explanation might be found in the networks and networking of family-owned firms. When firms internationalize, they are likely to build up new relationships in foreign markets, e g, with customers and business partners (Schweizer, Vahlne, & Johanson, 2010). Family firms are found to have relatively fewer but stronger relationships (Berrone, Cruz, & Gomez-Mejia, 2012; Kontinen & Ojala, 2011). These relationships might last even after the firm has stopped exporting to the market, making it easier for family-owned firms to re-enter compared to non-family-owned firms.
Family ownership
Non-family fi rms Family fi rm Total
Conti nuous Exporti ng 339 766 1,105
30.68 69.32 100.00 Exit 212 159 371 57.14 42.86 100.00 Re-entry 118 231 349 33.81 66.19 100.00 Total 669 1,156 1,825 36.66 63.34 100.00
Chapter 4
CONCLUSIONS AND
RECOMMENDATIONS
As important generators of jobs, innovation, and economic growth, SMEs are a vital part of our economy. The macro trends toward market globalization have created specific opportunities and threats to the international development of these firms. On the one hand, internationalization through exports is regarded as an essential prere-quisite for growth. Swedish exports are one of the focus areas of policy makers and an important element in creating jobs and safeguarding Swedish welfare. For example, a new export strategy—focusing on job growth and attributing an important role to the exports of SMEs—was presented by the Swedish Government at the end of September 2015; the policy allocated 795 million SEK to stimulate Sweden’s presence in global markets over the next five years.
On the other hand, SMEs are believed to be less equipped than larger firms to com-pete and develop in international markets. The combination of opportunities and chal-lenges that SMEs face in international markets might be mirrored by the export pattern these firms exhibit. Specifically, SMEs not only enter into export markets and continue to grow overseas; over time, exporting SMEs can also reduce their commitment to foreign markets or exit entirely from a foreign market. Further, after exiting, SMEs can re-enter export markets, either entering into markets that are new to them or those they had previously withdrawn from (Benito, 2005; Welch & Paavilainen-Mäntymäki, 2014). However, prior studies have overlooked the different export patterns that SMEs might undertake, and little is known about the factors underlying such patterns.
Our report has addressed this gap by exploring the different export patterns of Swedish SMEs in manufacturing and retail sectors. Further, we have investigated the factors that might drive the different export patterns of SMEs.
Starting with the export patterns, our study shows that as many as 40 percent of the exporting firms in our sample did not show steady export behavior during the