Institutionen för Kultur, energi och miljö
Avdelningen för biologi
Högskolan på Gotland, SE-‐621 67 Visby
P
LANT
-P
OLLINATOR
N
ETWORKS IN
T
HREE
H
ABITATS ON A
B
ALTIC
I
SLAND
Bild om så önskas
Jakob Wallin
Examensarbete i biologi 30 högskolepoäng, 2011
Handledare: Jette Knudsen
Bilden på framsidan föreställer de tre habitaten, äng, skog och dyn som undersöktes för
interaktioner i studien. Fördelning av arter och länkar mellan arter symboliseras av rosa punkter och sträck.
Fotografi och design: Jakob Wallin
Denna uppsats är författarens egendom och får inte användas för publicering utan författarens eller dennes rättsinnehavares tillstånd. Jakob Wallin
CONTENTS
ABSTRACT...4
INTRODUCTION...5
Why networks and pollination is important...5
Network patterns and properties...5
Roles of species...5 Dynamics...6 Study system...6 Questions...6 METHOD...7 Study site...7 Sampling procedure...7 Analysis...7
Taxonomic groups of pollinators...9
RESULTS...9
Network structure...9
Modules, roles and habitats...10
Habitat generalisation...11 DISCUSSION...12 ACKNOWLEDGEMENTS...14 REFERENCES...14 SAMMANFATTNING...17
ABSTRACT
Plant-pollinator networks have shown to be highly dynamic systems as species and interactions change in time and space. Few studies have incorporated several habitats in their network. In this work I investigate interacting plant and pollinator communities of three adjacent habitats at Gotska Sandön, an island in the Baltic Sea. The networks varied in size between the habitats, and the larger networks of the dune and meadow displayed both nested and modular structure while the smaller forest network was more randomly organised. We found species present in more than one habitat that connected the networks by forming inter-habitat modules of tightly linked species. Species took on different topological roles in the networks depending on how many links they formed and where these attached. The habitat generalists were important to overall network structure as role correlated with habitat generalisation level.
INTRODUCTION
Why networks and pollination is important
The web of interactions between species in nature for long seemed as entangled as Darwin described it (Darwin). Recently however, biologists using a network analytical approach (Albert and Barabasi 2001) have discovered structural patterns of complex networks such as the World Wide Web and social networks emerging in ecological networks as well (Bascompte and Jordano 2007). Properties such as skewed degree-distributions, nestedness and modularity commonly applies to networks of species interactions and may play an important role in persistence and stability of biodiversity (Bascompte et al. 2006, Bastolla et al. 2009). Zoophilous plants and their pollinators create complex networks of mutualistic interactions. Still the mutualism of pollination goes far beyond the interacting plants and animals as it serves a critical function in terrestrial ecosystems from tropical rainforests to arctic tundra and in the production of economically important crops (Costanza et al. 1997, Klein et al. 2007). Unfortunately, current anthropogenic influence on environment is causing a global decline of pollination services (Nabhan and
Buchmann 1997, Kearns et al. 1998, Memmot et al. 2007). Network studies may contribute to the understanding of how environmental changes affect life supporting ecosystem services, such as pollination (Ings 2009 et al., Kaiser-Bunbury et al. 2010, Tylianakis et al. 2008) and how to best cope with these changes.
Network patterns and properties
In pollination networks plant species attract different number of animal visitors of which some may act as pollen vectors, similarly animal species utilise a varying number of plant species for food (Proctor et al. 1996). A community of plant and flower visiting animal species can be considered as nodes linked by interactions that may be described as a network (Bascompte et al. 2007). Certain common structural patterns of mutualistic networks, and indeed plant-pollinator networks, have been found persistently across ecosystems (Dupont et al. 2009a). The main characteristics of the links are that they are numerous but weak and asymmetric (Bascompte et al. 2007). The distribution of links between species is highly unequal and typically follow a truncated power law (Jordano et al. 2006), where most species are specialists forming only one or a few interactions, and a few species are generalists with links to many other species. Interactions and dependence are
asymmetric as specialist and generalists often interact in a nested fashion, specialists tend to interact with a subset of the interaction partners of more generalist species (Bascompte et al. 2003). Another aspect of the heterogeneous link distribution within ecological networks is that groups of strongly connected species may form weakly interlinked modules (Olesen et al. 2007). Modules may be caused by environmental heterogeneity, phylogenetic clustering and morphological/ behavioural convergence with respect to flower shape, scent and colour, the latter suggested to represent the long sought for coevolutionary units (Dupont and Olesen 2009, Olesen et al. 2007, 2010).
The repeated structural patterns found in species interaction networks across ecosystems suggest the presence of general mechanisms in the evolution and assembly of communities. These common non-random network patterns appear to be associated with robustness to perturbations. Asymmetry and skewed degree distributions are suggested to support biodiversity (Bascompte et al. 2006, Ashwort et al. 2004) and system robustness against random deletion of species (Memmott et al. 2004, Burgos et al. 2007). A modular structure could prevent the spread of perturbations through a network as disturbances may stay within a module, thus making the network less reactive to
changes (Melian and Bascompte 2002).
Roles of species
The relationships between species of pollination networks differ as do their contribution to function and robustness of the system. Linkage level, i.e. the standardized number of interactions per
species, provides a basic measure of the importance of a species. However, as many networks consist of modules, generalists species, i.e. species with high linkage level, may have most of their links within a single module or spread their links between modules. Thus, not only the number of interactions but also where these interactions attach among modules matters in determining the function of a species in the network. Olesen et al. (2007) assigned four different roles to species according to their function in modular networks: network hubs (highly connected within and among modules), module hubs (highly connected in a module), connectors (interconnecting modules) and peripherals (having few links within a module). Hub-species are indisputably important to overall structure by connecting many peripherals and modules but the function of connector-species remains somewhat uncertain. In an analysis of 51 pollination networks Olesen et al. (2007) found that only 15% of the species were hubs or connectors, thus being important to the network. Extinction of these few key species may fragment the network and cause cascading secondary extinctions of species (Montoya et al. 2006).
A few studies have investigated factors and species properties affecting the role of a species. Abundant species are generally found more likely than rare species to form many interactions and become a hub or connector (Ashworth et al. 2004, Dupont et al. 2009, Olesen et al. 2008). Montero (2005) explored linkage levels of pollinators in three adjacent habitats and found that interaction generalisation correlated positively with habitat generalisation, i.e., species present in more than one habitat interacted with more species than species present in only one habitat.
Dynamics
Plant-pollinator networks are highly dynamic systems as species and interactions vary in both time and space. Thus the topological aspect of a species as a measure of its relative importance to the system may be relevant only in a certain place at a certain time. A few studies that have investigated network dynamics indicate that the overall network parameters such as connectance, degree
distributions, nestedness and modularity remain more or less constant across sites and years while species and especially interactions change (Petanidou et al. 2008, Alacorn et al. 2008, Olesen et al. 2008, Ramos et al. 2009, Dupont et al. 2009). Further evidence of the dynamics of network
structures across sites comes from studies that investigated generalisation levels of plants and pollinators across sites and found it to be less a species property but more a local phenomena (Fox and Morrow 2006, Herrera 2005, Montero 2005).
Study system
Few studies have considered dynamics of pollination networks across habitat borders and properties of habitat generalists. The study system is the network of plants and pollinators in three
neighbouring habitats at Gotska Sandön, an island in the Baltic Sea. Gotska Sandön is limited by its isolation and hosts a relatively short number of species. A minimum of disturbance from human activities such as agriculture and forestry makes Sandön’s isolated system suitable as a starting point for further studies of network dynamics related to factors such as climate change. With this study I acknowledge questions of fundamental generalist/specialist ecology, spatial dynamics of plant-pollinator webs and discuss their potential implications.
Questions
Most network studies have focused on networks within single habitats. However, an isolated network enclosed by habitat boundaries will rarely exist, as some species may not perceive the border, i.e. the habitat generalists. Similarly as species are linked to each other by interactions, networks in bordering habitats may be linked by habitat generalists. The potential presence of habitat generalists in a network may affect spatial network dynamics. In this study I explore the general properties of networks of three adjacent habitats and the modules and species therein to discuss: What defines modules of a network encompassing more than one habitat? Which species
are habitat generalists and where do they attach in the network? Are the roles of species stable across habitats?
METHOD Study site
The study was carried out at the national park of Gotska Sandön (58° 23′ N, 19° 11′ E) 90 km east of Sweden. Gotska Sandön is the most isolated island in the Baltic Sea and consists of 37 km2 glacial sand deposits covered mainly by pine forest (Pinus sylvestris) with a heath understory mainly of species of Ericaceae.
The plots were located along a habitat gradient leading inland from the coast. The habitats displayed different microclimates. Sites furthest apart were separated by 850 m, which was estimated not to exceed foraging ranges of pollinators such as bees and hoverflies. Two 500 m2 plots were placed in each of the three habitats. The dune plots were located near the beach and characterized by high exposure to both sun and wind, and the main vegetation consisted of tall grasses. Forest plots were sheltered from sun and wind by the pine tree canopy and surrounding forest-covered dunes, and the understory vegetation was mainly composed of low shrubs of Ericaceae. The meadow plots were located furthest inland in an opening of the forest. The meadow at Gotska Sandön has a long continuity of haymaking tradition and holds a variety of herbs and grasses partly shaded by oak trees, Quercus robur.
Sampling procedure
The sites were visited during three ten-day periods from mid-june to mid-august for observations. All plots were examined for flowering plant species and abundance of flowers of each species was estimated.
In the field plants were identified to the level of species (Krok and Almquist 2007, Mossberg et al. 2003) and most flower visitors to morpho-species. Vouchers of all morpho-species were collected for further identification using Douwes et al. (1997), Bartsch (2009ab) and Chinery (1988), flies were verified by specialists (see acknowledgements). Representatives of each flower-visiting species were collected for pollen analysis, though not carried out in this study due to time limits. All flowering plants species were observed for flower visitors. I defined an interaction as an animal touching stigma or anthers in a flower. Thus, observations were not made in sufficient detail to reveal the level of mutualism of the interaction, i.e. how much animals were feeding or amount of pollen transported and its contribution to fertilization of the plant. Randomly selected individuals of each plant species was observed for 2 x 30 minutes at different days and at different times between 10 and 16 h of the day of each ten-day period, and a total of 96 observation hours were spent. The visitation frequency, i.e. the number of visits of each animal species to a plant species was recorded. Visitation frequency may be used as an adequate measure of interaction strength and as an estimate of animal species abundance (Vázquez et al. 2005). A limited number of interactions were recorded in High-Definition video for possibilities of future analysis of the details in each interaction.
Analysis
A matrix of the network of each plot and ten-day period was created. To get sufficient sample size for analysis, the plots of each habitat and all time slices were pooled to three networks, one for each habitat. The number of plant species P, animals A, interactions I, and connectance I / (P x A) was calculated for each habitat. Linkage levels of an animal species La and linkage level of a plant
species Lp were calculated as the number of interactions per species. To compare linkage levels of
plants and animals, linkage levels were standardized as relative linkage levels of an animal species la = La / P and relative linkage level of a plant species lp = Lp / A. Species with high linkage levels
are more generalized using a broader range of the interaction-resources-spectra than species with low linkage levels.A possible relation between interaction generalisation (linkage level) and abundance was tested statistically for species in each habitat by using the non-parametric Spearman’s correlation coefficient r. To examine the stability of linkage levels across habitats, linkage levels of species present in more than one habitat was compared using the Wilcoxon test for matched pairs. Another type of generalisation is the use of different habitats. For each species habitat generalisation level H was equal to the number of habitats where the species was present, ranging from 1 to 3. The potential connection between habitat generalisation and interaction generalisation was evaluated using non-parametric Spearman’s correlation coefficient rs.
I analysed presence-absence matrixes of the three networks using the nestedness analysis (Bascompte et al. 2003). I used the ANINHADO program (Guimarães and Guimarães 2006) to calculate the temperature T statistic. The program calculates the temperature T statistic, a measure of network disorder ranging from 0° for a perfectly nested network to 100° for a randomly organised
network. In a nested system interactions of specialist species are nested within the interactions of more generalized partners, and as a consequence species with only one interaction then interact only with the most generalized species. To assess the statistical significance of T, T is compared to the temperatures of 100 random networks of the same size as the actual network. In the randomization of the 100 networks I used the CE null model, which limits the probability of observing an
interaction as a function of the level of specialisation of the interacting species (Bascompte et al. 2003, Guimarães and Guimarães 2006). I also followed Bascompte et al. (2003) by converting T to the nestedness index N (N = (100 - T) / 100), which rather describes the level of nestedness than the degree of disorder. N ranges from 0 for a random network to 1 for a perfectly nested network. I used the method of functional cartography by simulated annealing (SA) to detect modules of tightly linked species in the networks (Guimerà and Amaral 2005a; Olesen et al. 2007). This method identifies modules by maximizing a measure of modularity M of the network:
where NM is number of modules, I is number of links in the network, Is is number of links between
species in module s and ks is the sum of the number of links of each species in module s. A high
value of M means that there are many links inside modules and few links between modules, when compared to randomly assembled networks. Significance of the modularity of the networks in this study was assessed by comparisons of M to M-values of 100 randomizations of the networks with the same size and degree distribution as the actual network, using an iteration factor of 0,9, cooling factor q = 0,999, and final temperature Tf = 0 (Guimerà et al. 2004).
Species in modular networks holds different topological roles, defined by the two parameters, z and c (Guimerà & Amaral 2005, Olesen et al. 2007). The within-module degree zi is the standardized
number of links of a species i to other species in the module:
where kis is number of links of species i to other species in the same module si, whileks and σks are
average and standard deviation of within-module links (k) for all species in si. Species are divided
in highly linked hubs (z > 2,5), and sparsely linked nonhubs (z < 2,5). The among-module connectivity ci is a measure of how connected species i is to all modules:
ki is number of links of species i. The role of a species is then assigned by plotting species
according to their c and z values in a zc-plot (fig. 2A in results). If all links of i are within its own module, c equals 0, while if links are distributed evenly among modules, c approaches 1. Non-hubs (z < 2,5) are divided into peripherals (ci < 0,62), which have all or most links inside their own
module; and connectors (ci > 0,62), which have more than 50% of their links to other modules.
The roles of species present in more than one habitat were compared between habitats and differences were tested using Wilcoxon test for matched pairs. Possible relations between role, abundance and habitat generalisation H was investigated using Spearman’s correlation coefficient r. Species role was coded as; 1 = peripheral, 2 = connector, 3 = module hub and 4 = network hub. The algorithm used for the analysis of nestedness and modularity did not incorporate the strength of the interactions. To control for possible effects of strength I did correlations of visitation
frequencies (measure of strength) and roles using Spearman correlations.
Taxonomic groups of pollinators
To be able to compare species composition of networks and modules, animal species were grouped according to higher taxonomic and pollination-functional groups (Proctor et al. 1996). The groups were; Apoidea, Syrphidae, non-syrphid Diptera and Coleoptera. Species not included in these groups were pooled as Others and consisted of either rare species or species assumed to be less important as pollinators.
RESULTS
Network structure
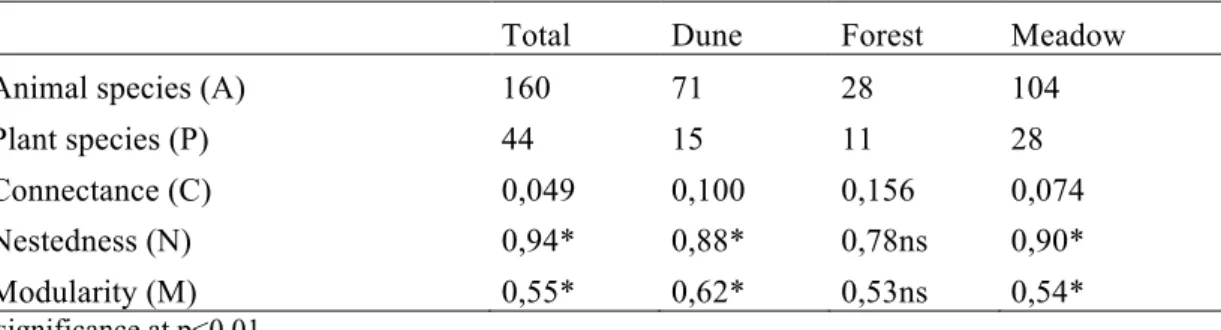
A total of 160 animal species and 44 plant species were engaged in the 348 observed interactions in the three habitats studied. The three networks differed in size and connectance. The Meadow hosted the highest number of species, 104 animal species and 28 plant species, while the forest had fewest species, 28 and 11 respectively. Network connectance increased with decreasing network size (Table 1). Two networks, the dune and the meadow, where both significantly nested and modular (Fig. 1), however the insignificant modularity in the forest may be due to the lack of power of algorithm at small network sizes. Anyway, the forest network was treated as one module in the analysis. Table 1 shows parameters of the networks in the three habitats and the total network where all observations were pooled into one network.
Table 1 Parameters of the plant-pollinator networks at Gotska Sandön.
Total Dune Forest Meadow
Animal species (A) 160 71 28 104
Plant species (P) 44 15 11 28
Connectance (C) 0,049 0,100 0,156 0,074
Nestedness (N) 0,94* 0,88* 0,78ns 0,90*
Modularity (M) 0,55* 0,62* 0,53ns 0,54*
Modules, roles and habitats
In the total network 8 modules were detected by the SA algorithm and module sizes varied from 11 to 47 species. When the networks of the habitats were analysed separately, 9 modules were found in the dune, 1 in the forest and 8 in the meadow (Fig. 1B). Size ranged from 39 species in the forest module to 2 species in the only isolated module, which was located in the meadow (Fig. 1A). Modules varied greatly in shape but consisted mainly of many peripheral animal species centred around one to a few plant species.
The analysis of the components of the modules in the total network (Fig. 2B) revealed taxonomic and functional clustering and modules delimited within habitats. Species of the Epilobium and Berberis/Sorbus module where confined within the dune, the Maianthemum module in the forest and Achillea and Anthriscus/Ranunculus in the meadow. Remaining modules encompassed species of several habitats. The Hieracium module consisted of three species of Hieracium from different habitats. The multi-habitat-hub Galium verum attracted a similar wide variety of visitors as
Pimpinella saxifraga in the meadow, which together composed a module. The Melampyrum module consisted of tube shaped flowers and the long-tounged Bombus terrestris (compared to other insects in the network).
Figure 1 A) Interaction-‐matrices of the habitats organised in a nested fashion, i.e. most generalised species are in top
left corners of matrices. Plants species are ordered in rows and animal species in columns, filled squares indicate interactions. B) Modular network patterns portrayed by graphs where species are symbolized by dots and interactions by lines. Gatherings of dots represent modules.
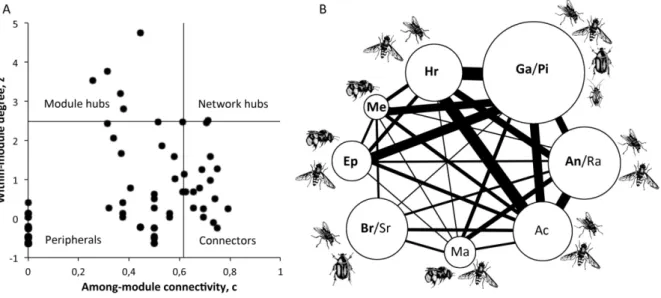
Figure 2 A) Zc-plot of species roles of the total network. Dots represent species, which are assigned roles according to in which of
the four quadrants they are located. B) Figure of modules of the total network where the number of species in the module is proportional to circle size and the thickness of lines joining modules is proportional to the number of interactions between modules. Important plant species signed inside the modules are abbreviated as follows; Ep = Epilobium angustifolium, Me = Melampyrum
pratense, Hr = Hieracium pilosella and H. vulgata, Ga = Galium verum, Pi = Pimpinella saxifraga, An = Anthriscus sylvestris, Ra = Ranunculus acris and R. bulbosa, Ac = Achillea millefolium, Ma = Maianthemum bifolium, Br = Berberis vulgaris and Sr = Sorbus aucuparia (bold letters denotes hubs). Taxonomic groups of pollinators of each module weighted by frequencies are represented by
symbols (legend in Fig. 3B).
of species calculated by the SA through z- and c-scores (see method) showed that species varied topologically. 87% of species were peripherals by scoring low for both c and z. Remaining species were either connectors with high c-score, hubs with high z-score and network hubs with both scores high which connected both highly in and outside their module (Fig. 2A).
The roles of species present in more than one habitat were compared between the habitats using the Wilcoxon test for matched pairs. No significant differences were found between the dune and the forest (t = 4, p > 0,05, n = 4), between the forest and the meadow (t = 4, p > 0,05, n = 7) or between the meadow and the dune (t = 8, p > 0,05, n = 7). However, species role was significantly positively correlated with species abundance for both plants and animals in all habitats, that is hubs and connectors generally were more abundant than peripherals. Spearman correlation coefficients for role vs. abundance in the habitats were as follows, in the dune (plants and animals respectively): rs=
0,69 p ≤ 0,02 and rs = 0,67 p ≤ 0,02, in the forest: rs = 0,725 p ≤ 0,05 and rs = 0,56 p ≤0,01, and in
the meadow: rs = 0,40 p ≤ 0,05 and rs = 0,70 p ≤ 0,02.
To control for the possible effects of strength to interaction structure species role and strength was correlated using spearman correlations. Overall significantly positive relations was found in all habitats (dune: rs = 0,67 p ≤ 0,01; forest: rs= 0,58 p ≤ 0,01; meadow rs = 0,70 p ≤ 0,01)
Habitat generalisation
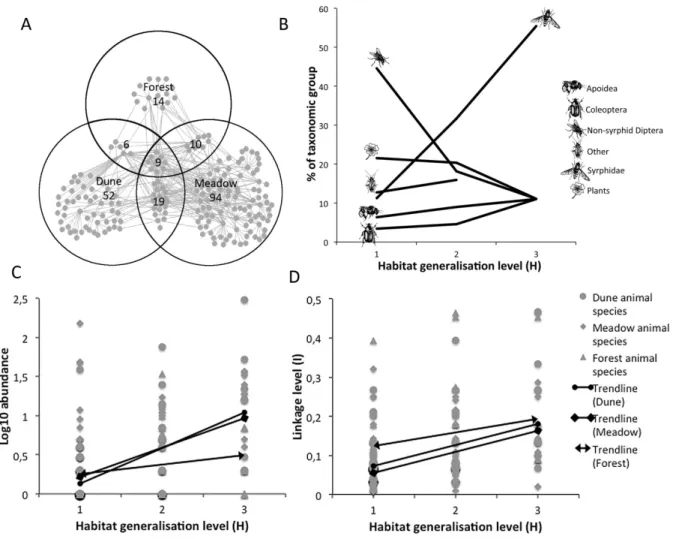
The analysis of species properties between the habitats was based on the 44 species present in more than one habitat. Of the 44 habitat generalists 35 of them used 2 habitats and 9 used 3 habitats. The dune and the meadow shared the highest number of species, 19, while the dune and forest shared least, 6 species (Fig. 3A).
Proportions of each taxonomic group were compared at each level of habitat generalisation level (H) (Fig. 3B). All major groups were present at each level of H except that there were no species in the mixed “Other” group present in all three habitats. Species composition differed between levels of H. Most groups remained between 5-20% at all levels but non-syrphid flies were high at H=1 while the Syrphidae portion increased with H to 55% at H=3.
Figure 3 Plots and figures on habitat generalisation levels (H) of species in the habitats; dune, forest and meadow. A) The total
network and its distribution of species between the habitats. Grey dots and lines symbolize species linked by interactions. Circles represent habitats and numbers represents species, overlapping circle areas and numbers within overlaps denotes species present in both habitats. B) Diagram of taxonomic groups of species and their distributions (in %) at different levels of H. C) Plot of log10
animal species abundance of the three habitats along the Y-axis correlated against H on the X-axis. D) Plot of linkage level (L), on Y-axis, correlated against H on X-axis.
Further investigation of H and its relation to other species properties was analysed using the non-parametric Spearman rank correlation. The habitat generalists were generally abundant and highly linked hub and connector species. Significantly positive correlations of H were found to abundance, linkage level and species role. H correlated positively with abundance of animals in the dune
(rs=0,64 p≤0,01) and meadow (rs=0,49 p≤0,01) but insignificantly for plants, in the forest no
significant correlations were found (Fig. 3C). H correlated significantly positively to linkage levels of species in the dune (rs=0,54 p≤0,01), the forest (rs=0,95 p≤0,01) and in the meadow (rs=0,52
p≤0,01) (Fig. 3D). The relationship between H and the role of species was also significant and positive in the dune (rs=0,58 p≤0,01), in the forest (rs=0,46 p≤0,02), and in the meadow (rs=0,56
p≤0,01).
DISCUSSION
The plant-pollinator networks of adjacent habitats in the study at Gotska Sandön showed variation in network size, connectance and species composition. The sheltered and sunny meadow held the largest number of species while the shaded system of the forest held the least. Connectance increased with decreasing network size, which is a common trend among pollination networks
(Olesen and Jordano 2002). However, the actual connectance of the networks is probably higher than the calculated, especially for the pooled network, as some of the potential interactions may be forbidden (Olesen et al. 2011). Unobserved links in a plant-pollinator network is either missing or forbidden because of linkage constraints, such as morphological mismatches and spatio-temporal uncoupling that make interactions impossible. Missing links can be observed by increasing sampling effort and by including data from pollen collected from the flower visitors. The addition of pollen data may bring significant changes to the network structure and increase connectance (Bosch et al. 2009).
I analysed the extent to which the interactions were organised in a nested fashion using the
ANINHADO program and temperature (T) measure. The larger networks of the dune and meadow were significantly nested while the interactions of the forest network was more randomly organised. Similar results were found in the modularity analysis by simulated annealing. The dune and the meadow consisted of modules of tightly linked species, while interactions were more evenly distributed in the forest where modularity was not significant. The apparent relation between network size, nestedness and modularity goes along with findings of previous studies, where about 50 species seems to be the threshold for both nestedness and modularity (Bascompte et al. 2003, Olesen et al. 2007). The strength of interactions was not included in the analysis of this study, because so far there is no algorithms that incorporates it. Potentially this can affect the network structure. However, I investigated the overall effect of interaction strength by correlation of visitation frequencies (measure of strength) and roles using Spearman correlations. The positive relations between role and strength suggests that observed overall network structures, such as modularity and nestedness, would be enhanced if strength was included in the analysis.
In the dune and meadow the SA algorithm detected modules of tightly linked species of plants and animals. Although they varied in size and shape, most modules consisted of many peripheral insects centred around one or two hub plant species which also linked to other modules. Most generalist insects spread their links between modules, thus acting as connectors. These patterns of module composition resemble findings of studies using the same algorithm (Dupont et al. 2009b). When the pooled network was analysed for modules the 18 modules of the single-habitat networks merged into eight larger modules. Five of these were clearly defined within the habitats, thus reflecting the environmental heterogeneity of habitat borders. The remaining three modules were held together by a few habitat generalists and had components of morphological and phylogenetical clustering. The Melampyrum module consisted of the bumblebee and typical bumblebee flowers with more or less funnel shaped flowers. Hieracium species from different habitats formed a module together with the, also open and yellow-flowered, Hypericum perforatum and fly species. A large module was formed around the habitat generalist Galium verum together with Pimpinella saxifraga, which both have small, nectar producing, open flowers, although with different colour, and hosted a taxonomic variety of flower visitors. This inter-habitat analysis of modules and their composition indicates the existence of apparent coevolutionary units that may link networks of bordering habitats. However, further investigation of the stability of this modular pattern and the ecological components of the interactions involved in shaping the modules is required for confident conclusions regarding coevolutionary units in the pollination system at Gotska Sandön.
Fortyfour species were found making interactions in more than one habitat, thus defined as habitat generalists. Some clear taxonomical differences emerged at the different levels of habitat
generalisation. Species present in only one habitat (H = 1) were mainly non-syrphid diptera and plants, while 5 of the 9 species that was present in all habitats (H = 3) was Syrphids. The Syrphidae and other habitat generalists in our study system were generally important species to overall
network structure, as habitat generalisation (H) correlated positively with role of species and linkage level. This corresponds with Montero’s (2005) findings of positive correlations between linkage levels and habitat generalisation. However, I did not find significant differences between roles or linkage levels between the habitats. The results imply that species present in more than one habitat generally were important to network structure in all habitats where they were present. Some
species did however differ in role and linkage level between the habitats such as Epilobium
angustifolium, which was the major hub in the dune but peripheral in the forest. The differences of roles between different species and between species that varied across sites could partly be
explained by abundance as role and abundance correlated positively at all sites. If a habitat is less suitable for a species it may then lower its abundance and also its linkage level. However, it is difficult to judge from this study whether abundance is a cause or effect of the role of a species. Along with findings of other studies we can conclude that linkage level, thus also species role, may be both a species property and a local phenomena (Montero 2005, Fox and Morrow 1981). Studies of pollination networks incorporating several habitats may give answer to questions of the ultimate determinants of species role.
Plant-pollinator webs has proven to be highly dynamic systems and susceptible to environmental change (Dupont et al. 2009, Tylianakis et al. 2008). Hubs and connectors have been suggested to be important in conservation of these systems (Olesen et al. 2007). However, as roles may change in a changing environment the static picture of hubs and connectors do not imply their importance to system resilience. It can be argued that habitat generalists may be more resistant to environmental changes as they obviously can tolerate environments of different habitats. In networks in a changing environment due to, e.g., climate change, habitat generalists may become important to the system. My findings of positive correlations between role and habitat generalisation may indicate an increase in the importance of these species and in the overall system robustness to change.
However, assumptions behind this hypothesis have to be tested. Can habitat generalisation be used as a measure of tolerance to environmental change? The relation of habitat generalists to system robustness then has to be tested. This could be done by model deletion of species in order of increasing level of H.
Properties of plant-pollinator networks encompassing several habitats have rarely been explored in earlier studies. In this work I have shown that networks of adjacent habitats may be connected by shared species, i.e. habitat generalists. The modules of the inter-habitat network that I analysed revealed that species may be phylogenetically and/or morphologically linked between sites. Thus, plant-pollinator interactions should not be seen as closed systems within habitats and habitat generalists play an important role in network dynamics.
ACKNOWLEDGEMENTS
This work was financially supported by Gotland University. I thank my supervisor Jette Knudsen and Jens M. Olesen for valuable advice and inspiration, the field assistance of Sixten Johansson and Gabriel Gustavsson, permission to collect insects by Länsstyrelsen på Gotland, the helpful staff at Gotska Sandön, Hans Bartsch and Sibylle Noack for help with identification of insects, Jesper Martinsson for technical advice on analysis and Karin Bengtsson for reviewing.
REFERENCES
Alarcón, R., Waser, N. M. and Ollerton, J. 2008. Year-to-year variation in the topology of a plant– pollinator interaction network. Oikos 117: 1796-1807.
Albert, R. and Barabasi, A. -L. 2001. Statistical mechanics of complex networks. Reviews of Modern Physics 74: 47-97.
Ashworth, L., Aguilar, R., Galetto, L. and Aizen, M. A. 2004. Why do pollination generalist and specialist plant species show similar reproductive susceptibility to habitat fragmentation? Journal of Ecology. 92: 717-19.
Bartsch, H. 2009a. Nationalnyckeln till Sveriges flora och fauna; Tvåvingar: Blomflugor. Diptera: Syrphidae: Syrphinae. ArtDatabanken SLU, Uppsala.
Bartsch, H. 2009b. Nationalnyckeln till Sveriges flora och fauna. Tvåvingar: Blomflugor. Diptera: Syphidae: Eristalinae & Microdontinae. ArtDatabanken SLU, Uppsala.
Bascompte, J. and Jordano, P. 2007. Plant–animal mutualistic networks: The architecture of biodiversity. Annual Reveiw of Ecology, Evolution and Systematics 37: 567-593.
Bascompte, J., Jordano, P., Melián, C. J. and Olesen, J. M. 2003. The nested assembly of plant-animal mutualistic networks. PNAS 100: 9383-9387.
Bascompte, J., Jordano, P. and Olesen, J. M. 2006. Asymmetric coevolutionary networks facilitate biodiversity maintenance. Science 312: 431-433.
Bastolla, U., Fortuna, M. A., Pascual-García, A., Ferrera, A., Luque, B. and Bascompte, J. 2009. The architecture of mutualistic networks minimizes competition and increases biodiversity. Nature 458: 1018-1020.
Bosch, J. González, A. M. M., Rodrigo, A. and Navarro, D. 2009. Plant-pollinator networks: adding the pollinators perspective. Ecology Letters 12: 409-419.
Buchmann, S. L. and Nabhan, G. P. 1996. The forgotten pollinators. Island Press, Washington DC. Burgos, E., Ceva, H., Perazzo, R. P. J., Devoto, M., Medan, D., Zimmermann, M. and Delbue, A.
M. 2007. Why nestedness in mutualistic networks? Journal of Theoretical Biology 249: 307-313. Chinery, M. 1988. Insekter i Europa, Bonnier, Stockholm.
Costanza, R., d’Arge, R., de Groot, R., Farber, S., Grasso, M., Hannon, B., Limburg, K., Naeem, S., O’Neill, R. V., Paruelo, J., Raskin, R. G., Sutton, P. and van den Belt, M. 1997. The value of the world’s ecosystem services and natural capital. Nature 387: 253-60.
Darwin, C. 1859. On the Origin of Species by Means of Natural Selection, John Murray, London. Douwes, P., Bellmann, H., Sandhall, Å. and Hansson, C. 1997. Insekter - En fälthandbok.
Stenströms Bokförlag, Stockholm.
Dupont, Y. L. and Olesen, J. M. 2009. Ecological modules and roles of species in heathland plant-insect flower visitor networks. Journal of Animal Ecology 78: 346-353.
Dupont, Y. L., Padrón, B., Olesen, J. M. and Petanidou, T. 2009. Spatio-temporal variation in the structure of pollination networks. Oikos 78: 346-353.
Fowler, J., Cohen, L. & Jarvis, P. 1998. Practical statistics for field biology. 2 ed. John Wiley & Sons Ltd, Chichester, UK.
Fox, L. R. and Morrow, P. A. 1981. Specialization: Species property or local phenomenon? Science 211: 887-893.
Guimerà, R. and Amaral, L. A. N. 2005a. Functional cartography of complex metabolic networks. Nature 433: 895-900.
Guimera, R. and Amaral, L. A. N. 2005b. Cartography of complex networks: modules and universal roles. Journal of Statistical Mechanics: Theory and Experiment art. no. P02001.
Guimarães, P. J. and Guimarães, P. 2006. Improving the analyses of nestedness for large sets of matrices. Environmental Modelling Software 21: 1512-1513.
Guimerà, R., Sales-Pardo, M. and Amaral, L. 2004. Modularity from fluctuations in random graphs and complex networks. Physics Review E 70: art. no. 025101.
Ings, T. C., Montoya, J. M. Bascompte, J., Blüthgen, N., Brown, L., Dormann, C. F., Edwards, F., Figueroa, D., Jacob, U., Jones, J. I., Lauridsen, R. B., Ledger, M. E., Lewis, H. M., Olesen, J. M., van Veen, F. J. F., Warren, P. H. and Woodward, G. 2009. Ecological networks - Food webs and beyond. Journal of Animal Ecology 78: 253-269.
Herrera, C. M. 2005. Plant generalization on pollinators: species property or local phenomenon? American Journal of Botany 92: 13-20.
Jordano, P., Bascompte, J. and Olesen, J. M. 2006. Invariant properties in coevolutionary networks of plant-animal interactions. Ecology Letters 6: 69-81.
Kaiser-Bunbury, C. N., Muff, S., Memmott, J., Müller, C. B. and Caflisch, A. 2010. The robustness of pollination networks to the loss of species and interactions: A quantitative approach
incorporating pollinator behaviour. Ecology Letters 13: 442-452.
Kearns, C. A., Inouye, D. W. and Waser, N. 1998. Endangered mutualisms: the conservation of plant–pollinator interactions. Annual Review of Ecology and Systematics 29: 83-112.
Klein, A.-M., Vaissière, B. E., Cane, J. H., Steffan-Dewenter, I., Cunningham, S. A. and Kremen, C. 2007. Importance of pollinators in changing landscapes for world crops. Proceedings of the Royal Society of London Series B 274: 303-313.
Krok, T. and Almquist, S. 2007. Svensk Flora. Liber, Stockholm.
Melián, C. J. and Bascompte, J. 2002. Complex networks, two ways to be robust? Ecology Letters 5: 705-708.
Memmott, J., Craze, P., Waser, N. and Price, M. 2007. Global warming and the disruption of plant– pollinator interactions. Ecology Letters 10: 710-717.
Memmott, J., Waser, N. M. and Price, M. V. 2004. Tolerance of pollination networks to species extinctions. Proceedings of the Royal Society of London Series B 271: 2605-2611.
Montero, A. 2005. The Ecology of Three Pollination Networks. MSc thesis, Aarhus University. Montoya, J. M., Pimm, S. L. and Solè, R. V. 2006. Ecological networks and their fragility. Nature
442: 259-264.
Mossberg, B., Stenberg, L. & Ericsson, S. 2003. Den nya nordiska floran. Upplaga 1. 928 sidor. Wahlström & Widstrand, Stockholm.
Olesen, J. M., Bascompte, J., Dupont, Y. L., Elberling, H., Rasmussen, C. and Jordano, P. 2011. Missing and forbidden links in mutualistic networks. Proceedings of the Royal Society of London Series B 278: 725-732.
Olesen, J. M., Bascompte, J., Elberling, H. and Jordano, P. 2008. Temporal dynamics of a pollination network. Ecology 89: 1573-1582.
Olesen, J. M., Bascompte, J., and Jordano, P. 2007. The modularity of pollination networks. PNAS, 104: 19891-19896.
Olesen, J. M, Dupont, Y. L, O’Gorman, E., Ings, T. C., Layer, K., Melián, C. J., Trojelsgaard, K., Pichler, D. E., Rasmussen, C. and Woodward, G. 2010. From Broadstone to Zackenberg. Advances in Ecological Research 42: 1-69.
Olesen, J. M. and Jordano, P. 2002. Geographic patterns in plant-pollinator mutualisitc networks. Ecology 83: 2416-2424.
Petanidou, T., Kallimanis, A. S., Tzanopoulos, J., Sgardelis, S. P. and Pantis, J. D. 2008. Long-term observation of a pollination network, fluctuation in species and interactions, relative invariance of network structure and implications for estimates of specialization. Ecology Letters 11: 564-575.
Proctor, M., Yeo, P. and Lack, A. 1996. The Natural History of Pollination. Harper Collins, London, UK.
Ramos-Jiliberto, R., Domínguez, D., Espinoza, C., López, G., Valdovinos, F. S., Bustamante, R. O. and Medel, R. 2009. Topological change of Andean plant-pollinator networks along an
altitudinal gradient. Ecological Complexity 1: 86-90.
Tylianakis, J. M., Didham, R. K., Bascompte, J. and Wardle, D. A. 2008. Global change and species interactions in terrestrial ecosystems. Ecology Letters 11: 1351-1363.
Vázquez, D. P., Morris, W. F. and Jordano, P. 2005. Interaction frequency as a surrogate for the total effect of animal mutualists on plants. Ecology Letters 8: 1088-1094.
SAMMANFATTNING
NÄTVERK MELLAN VÄXTER OCH POLLINATÖRER I TRE HABITAT PÅ GOTSKA SANDÖN.
Nätverksstudier där arter länkas av interaktioner är ett växande forskningsfält. Växter och blombesökande djur skapar genom pollinationsnätverk mutualistiska interaktioner. Värdet av pollination är stort eftersom det är en livsuppehållande ekosystemtjänst som samtidigt kan påverkas negativt av miljöförändringar. Återkommande mönster i organisationen av interaktionerna har hittats i pollinationsnätverk: i) de flesta arter har få länkar medan några få har många, ii)
interaktionerna är ofta nestade, vilket innebär att arter med färre interaktioner interagerar med ett urval av mer generaliserade arters partners och iii) nätverken består av moduler av tätt länkade arter. Dessa strukturer ger systemen ökad stabilitet mot förändringar och medverkar till att upprätthålla biologisk mångfald. Arterna tar, genom att ha ojämn länkfördelning, på sig olika topologiska roller i nätverken och har olika betydelse för varandra och strukturen som helhet. De perifera arterna har endast ett fåtal i länkar inom en modul, konnektorer har många länkar som är fördelade mellan olika moduler, modulhubbar länkar ihop många perifera arter till moduler medan nätverkshubbar länkar tätt både inom en modul och nätverket som helhet. Samtidigt som helhetsstrukturerna har visat sig stabila i många ekosystem och över tid så är nätverken samtidigt dynamiska system där arter och länkar förändras i tid och rum. De flesta studier har fokuserat på nätverk begränsade inom ett habitat. I det här arbetet undersöker vi pollinationsnätverk i tre angränsande habitat på Gotska Sandön och frågar speciellt: hur ser modulerna ut i ett nätverk som omfattar flera habitat? Vilka arter är habitatsgeneralister och hur länkar de i nätverket? Är arternas roller stabila mellan habitaten?
Vi besökte Sandön vid tre tillfällen om vardera tio dagar under juni, juli och augusti 2010. Två 500 m2 provrutor placerades i vardera av de tre habitaten, dynen, skogen och ängen. Habitaten var tydligt skilda i vegetation och mikroklimat. I rutorna studerades individer av samtliga blommande växter och deras blombesökare. Besökare bestämdes till art eller morfoart i fält och ett urval insamlades för senare bestämning/verifiering. För varje habitat gjordes interaktionsmatriser som analyserades för nestedness med programmet ANINHADO och modularitet med programmet SA (Simulated annealing).
I dynen observerades 15 växtarter som besöktes av 71 arter insekter, konnektansen var 10% vilket är ett mått på hur många av de möjliga länkarna som observerades. Ängen innehöll det största nätverket med 28 växter och 104 insekter med en konnektans på 7% medan skogen var minst med 11 växter och 28 insekter med 16% konnektans. Dynen och ängens nätverk var båda signifikant nestade och uppbyggda av moduler medan skogen var mer slumpmässigt organiserad. När de tre nätverken klumpades ihop och analyserades som ett totalt nätverk bestod det av 44 växtarter och 160 djurarter med 5% konnektans. Det totala nätverket var både signifikant nestat och modulärt. Åtta moduler upptäcktes i det totala nätverket, varav fem befann sig inom habitatens gränser och avspeglade därmed miljöns heterogenitet. De tre habitatsöverskridande modulerna hölls ihop av arter som fanns i flera habitat med morfologiska eller fylogenetiska gemensamma komponenter. Dessa moduler kan utgöra coevolutionära enheter som är mycket intressanta för fortsatta studier. 44 arter fanns i mer än ett av habitaten och benämndes som habitatsgeneralister. Nivån av
habitatsgeneralisering (H) motsvarade antalet habitat som en art utnyttjade. Taxonomiskt utgjordes habitatsgeneralisterna framförallt av blomflugor medan habitatsspecialisterna främst var icke-syrphid-diptera och växter. Signifikant positiva samband fanns, genom ickeparametriska Spearman korrelationer, mellan habitatsgeneralisering och länknivå (ett standardiserat mått på antalet
interaktionspartners för en art) i samtliga habitat. Utöver länknivå beräknades arters roll, 1 = perifer, 2 = konnektor, 3 = modulhub, 4 = nätverkshub, som ett mått på artens delaktighet och funktion i det
modulära nätverket. Korrelationen mellan roll och H visade också signifikant positiva samband. Abundans uppskattades för växtarter som blomantal och genom besöksfrekvenser för blombesökare och visade sig korrelera positivt med både länknivåer och arters roll. Habitatsgeneralisternas roller och länknivåer undersöktes också mellan habitaten med Wilcoxons test för matchade par men inga signifikanta skillnader hittades.
Resultaten från studien visar att pollinationsnätverk inte kan ses som isolerade enheter inom habitat eftersom habitatsgeneralister kan länka ihop nätverk över habitatsgränser. Habitatsgeneralisterna i vårt system var vanliga arter som var viktiga för nätverkets struktur och de utgjordes till stor del av blomflugor. Dessa samband kan öka systemens möjlighet att klara förändringar i miljön eftersom habitatsgeneralister klarar olika miljöer.
Examensarbeten i biologi vid Högskolan på Gotland
________________________________________________________________________________ 1. Enekvist, Elisabeth. 2003. Energy intake of Common Guillemot, Uria aalge, chicks at Stora Karlsö,
Sweden. Influence of changes in the Baltic Sea. (20p). Handledare: Kjell Larsson, Henrik Österblom.
2. Britse, Gunilla. 2003. Hävdens betydelse för kärlväxtfloran i gotländska skogsbetesmarker. (20p) Handledare: Karin Bengtsson.
3. Larsson, Martin. 2003. Vandringshinders påverkan på produktionen av havsöring, Salmo trutta. (20p) Handledare: Bertil Widbom.
4. Johansson, Daniel. 2003. Rekryteringsproblem för kustbestånd av gädda, Esox lucius L., på Gotland. (20p) Handledare: Bertil Widbom, Peter Landergren.
5. Andersson, Morgan. 2003. Predationseffekter av fisk i limniska system. Fiskens strukturerande roll i bottenfaunasamhället. (20p) Handledare: Bertil Widbom.
6. Jacobsson, Marie. 2003. Selectivity in gill net fishery for turbot, Psetta maxima L. Adaptation of mesh size to minimum landing size. (20p) Handledare: Bertil Widbom, Anders Nissling.
7. Svedberg, Amira. 2004. Hävdens inverkan på kärlväxternas fenologi i en gotländsk löväng. (10p) Handledare: Karin Bengtsson.
8. Tjernby, Per. 2004. Tryffel och evertebrater. Den lägre faunans betydelse för spridningen av tryffelsporer. (20p) Handledare: Bertil Widbom, Christina Wedén.
9. Nilsson, Micael. 2004. Födoval hos juvenil piggvar, Psetta maxima, och skrubbskädda, Pleuronectes
flesus, i grunda gotländska vikar. (20p) Handledare: Bertil Widbom, Anders Nissling.
10. Johansson, Ulrika. 2004. Reproduktionsframgång hos piggvar, Psetta maxima, i olika temperaturer och salthalter. (20p) Handledare: Bertil Widbom, Anders Nissling.
11. Ansén Nilsson, Marianne. 2004. Jämförande studie av anlagda och naturliga våtmarker på Gotland. Främst med avseende på kärlväxtfloran. (20p) Handledare: Karin Bengtsson.
12. Östbrant, Inga-Lena. 2004. Vegetation och fårbete på Stora Karlsö. (20p) Handledare: Karin Bengtsson. 13. Henningson, Eva. 2005. Predationens betydelse för habitatspecifik pigmentering hos
sötvattens-gråsuggan, Asellus aquaticus. (20p) Handledare: Bertil Widbom, Anders Hargeby.
14. Martinsson, Jesper. 2005. Skillnader i otolittillväxt och ålder vid metamorfos mellan olika populationer av skrubbskädda (Pleuronectes flesus). (20p) Handledare: Anders Nissling.
15. Dahlman, Gry. 2005. Äggproduktion i förhållande till fiskens storlek, ålder och kondition hos skrubbskädda (Pleuronectes flesus). (20p) Handledare: Anders Nissling.
16. Larsson, Kristin. 2005. Storlek och täthet hos årsyngel av havsöring (Salmo trutta) – en studie relaterad till omgivningsfaktorer i sex närliggande vattendrag på Gotland. (20p)
Handledare: Bertil Widbom, Lars Vallin.
17. Pennanen, Petri. 2005. Ägg- och larvkvalitet hos skrubbskädda, Pleronectes flesus, i relation till honans storlek, ålder och kondition. (20p) Handledare: Anders Nissling.
18. Hallberg, Nina. 2005. Födoval hos juvenil skrubbskädda (Pleuronectes flesus) och piggvar (Psetta
maxima) i relation till födoutbudet: Föreligger födokonkurrens? (20p).
Handledare: Bertil Widbom, Anders Nissling.
19. Larsson, Therese. 2006. Boplatsval, täthet och kläckningsframgång hos vadarfåglar på gotländska strandängar. (20p) Handledare: Kjell Larsson.
20. Björklund, Teresa. 2006. Etnobotanik och diversitet i köksträdgårdar på Kuba. (20p). Handledare: Bertil Ståhl.
21. Ridbäck, Ulrika. 2006. Botanical diversity in fragments of semidecidous forest in western Ecuador. (20p) Handledare: Bertil Ståhl.
22. Britse, Lina. 2006. Frö- och groningskaraktärer hos Styrax officinalis (Styracaceae) och deras samband med artens begränsade spridningsförmåga i Italien. (20p) Handledare: Karin Bengtsson, Francesco Spada.
23. Garnett, Jason. 2006. Best Environmental Practices and Technology on U.S. Golf Courses: Factors Affecting Implementation (Thesis in Coastal Zone Management, 10p). Handledare: Kjell Larsson 24. Persson, Måns. 2007. Reproduktionsbiologiska studier av salmbär, Rubus caesius. (20p). Handledare:
Bertil Ståhl, Jette Knudsen.
25. Hallenfur, Lotta. 2007. Corydalis gotlandica (Papaveraceae) – reproduktionssystem och morfologi i olika populationer. (20p). Handledare: Bertil Ståhl, Jette Knudsen.
26. Sundin, Josefin. 2007. Mating system and sexual selection of River lamprey, Lampetra fluviatilis, on Gotland. (10p). Handledare: Kjell Larsson, Nils Ljunggren.
27. Semenov, Oleg. 2007. Different ways of natural gas transportation. Their advantages and disadvantages in the light of the North European Gas Pipeline. (Thesis in Coastal Zone Management, 15 ECTS credits). Handledare: Kjell Larsson.
28. Bardtrum, Jens. 2007. Bycatches of Birds in the Gotlandic Turbot Fishery. (Thesis in Coastal Zone Management, 15 ECTS credits). Handledare: Anders Nissling.
29. Ljunggren, Nils. 2007. Lekbeteende och populationsstruktur hos flodnejonöga, Lampetra fluviatilis, på Gotland. (30 hp). Handledare: Kjell Larsson, Mikael Svensson.
30. Buhre, Louise. 2008. Habitatets betydelse för dårgräsfjärilens, Lopinga achine, förekomst på Gotland. (15 hp). Handledare: Bertil Widbom.
31. Lindell, Mattias. 2008. Akvariestudier av stensimpans, Cottus gobio, födoval och jaktbeteende. (15 hp). Handledare: Bertil Widbom
32. Sällebrant, John. 2008. Habitatpreferenser för juvenil skrubbskädda (Platichtys flesus) och piggvar (Scophtalmus maximus) – bottensubstratets betydelse för överlevnad och tillväxt hos den gotländska populationen. (30 hp). Handledare: Anders Nissling.
33. Strömbom, Markus. 2008. Tardigrades on epiphytic lichens in the Visby area – abundances and morphometrics. (15 hp). Handledare: Bertil Widbom.
34. Röstlund, Karolina. 2008. Kannibalistiskt beteende hos flodkräfta, Astacus astacus: Effekter av tidigare födoval. (15 hp). Handledare: Bertil Widbom.
35. Bolander, Sebastian. 2008. Betydelsen av uppvandrande större fisk för bottenfaunasamhällets struktur i två åar på Gotland. (15 hp). Handledare: Bertil Widbom.
36. Ridbäck, Ulrika. 2008. A floristic study of Polylepis forest fragments in the central Andes of Ecuador. (15 hp). Handledare: Bertil Ståhl.
37. Hallin, Borit. 2009. En studie av några hotade åkerogräs på Gotland. (30 hp). Handledare: Karin Bengtsson.
38. Siitonen, Sanna. 2009. Havsöringsfisket på Gotland. För vem och till vilket värde? (30 hp) Handledare: Patrik Rönnbäck.
39. Kulsdom Asterhag, Laila. 2009. Mnemiopsis leidyi – utbredning och födoval i svenska vatten. (30 hp). Handledare: Bertil Widbom.
40. Enström, Isabel. 2009. Substistence use and management of mangrove ecosystems – a study of community based conservation in Samoa. (15 hp). Handledare: Patrik Rönnbäck.
41. Nygren, Daniel. 2009. Födoval hos juvenil piggvar (Psetta maxima): Effekter av bytesstorlek. (15 hp). Handledare: Anders Nissling, Bertil Widbom.
42. Nygren, Daniel. 2009. Direkta effekter av insekticiden deltametrin på zooplankton och bottenfauna – en fältstudie av bieffekter av insekticidinducerad eliminering av signalkräfta på Gotland. (15 hp). Handledare: Bertil Widbom.
43. Enström, Lars. 2009. Gamla tallars betydelse för biologisk mångfald på Gotland. (15 hp). Handledare: Bertil Widbom.
44. Winberg, Peder. 2010. Ecological and energetic properties of a system. Assessing the importance of system dependence (30 hp). Handledare: Bertil Widbom.
45. Persson, Åsa. 2010. Mixotrofa dinoflagellater i två vikar på Gotland. Förekomst och påverkande faktorer (30 hp). Handledare: Bertil Widbom.
46. Södergren, Carin. 2010. How stimuli by toys affect pigs growth, health and welfare (15 hp). Handledare: Gunilla Rosenqvist.
47. Lindqvist, Charlotte. 2010. Does female scent trigger male response? A behavioral study on the broad-nosed pipefish (Sygnathus typhle) in the Baltic Sea (15 hp). Handledare: Gunilla Rosenqvist. 48. Andersson, Martin. 2010. Muddring i Ireån. Indirekta effekter på bottenfaunan nedströms (15 hp).
Handledare: Bertil Widbom.
49. Olsson Hedman, Mia. 2011. Effekter på insektsfaunan efter restaurering av Salmbärshagen I Stenkyrka s:n, Gotland (30 hp). Handledare: Bertil Widbom.
50. Kangasniemi, Sanna. 2011. Färgval hos blomkrabbspindeln (Misumena vatia) med och utan konkurrens (15 hp). Handledare: Bertil Widbom.
51. Johansson, Karl-Magnus. 2011. Fredningseffekter och rekryteringsproblem hos abborre (Perca
fluviatilis) i Stockholms skärgård (15 hp). Handledare: Anders Nissling.
52. Wallin, Jakob. 2011. Plant-pollinator networks in three habitats on a Baltic island (30 hp). Handledare: Jette Knudsen.