commissioned by SUHF, 2020
Multiplying
Economic Value:
The Impact of
Swedish
Universities
SUHF has commissioned Oxford Economics to produce this report on the economic
impact of Swedish universities on society. The background to the report is SUHF’s
desire to be able to demonstrate, with the support of facts, how the sector’s acti
vities contribute to society in various ways. In addition to examining the financial
impact of higher education institutions, work is underway aimed at making visible
the contribution of higher education institutions to society’s skills supply and to
Agenda 2030.
The economic effects of higher education institutions are, of course, direct, but
above all indirect, and include many different types of impact. There is no easy
way to estimate these indirect effects and in order to obtain the facts various dif
ferent routes can be taken. In a first step, SUHF has chosen to make this some
what basic study, which covers only measurable economic effects based on pu
blicly available data, taken from open sources.
The present report thus describes direct and certain indirect economic effects,
but does not include, for example, an analysis of how the supply of skilled labour
affects where businesses choose to locate operations (and the consequent eco
nomic growth) or the effects of innovation generated by higher education institu
tions. The only measurable effect of increased skills included in the report is the
effect caused by higher education leading to the individual’s salary being higher,
an area dealt with towards the end of the study.
An example of another method with broader funding, but with significantly
greater demands for active participation from higher education institutions, is the
report ”The Economic Contribution of the LERU Universities in 2016”, produced by
BIGGAR Economics, which according to the executive summary, describes how
higher education institutions, ”create economic benefits by transferring tangible
and intellectual property, expertise, learning and skills […] to businesses and the
wider community”. In the same way, there are good reasons to believe that the
economic impact not described in the report is significantly greater than that
which is described. The present report will therefore be supplemented at a later
stage in order to be able to shed more light from different perspectives on the over
all impact that the activities of higher education institutions have on society.
MULTIPLYING
ECONOMIC
VALUE: THE
IMPACT OF
SWEDISH
UNIVERSITIES
REPORT FOR SUHF
3
Oxford Economics
Oxford Economics was founded in 1981 as a commercial venture with Oxford University’s business college to provide economic forecasting and modelling to UK companies and financial institutions expanding abroad. Since then, we have become one of the world’s foremost independent global advisory firms, providing reports, forecasts and analytical tools on more than 200 countries, 250 industrial sectors, and 7,000 cities and regions. Our best-in-class global economic and industry models and analytical tools give us an unparalleled ability to forecast external market trends and assess their economic, social and business impact.
Headquartered in Oxford, England, with regional centres in London, New York, and Singapore, Oxford Economics has offices across the globe in Belfast, Boston, Cape Town, Chicago, Dubai, Frankfurt, Hong Kong, Houston, Johannesburg, Los Angeles, Melbourne, Mexico City, Milan, Paris, Philadelphia, Sydney, Tokyo, and Toronto. We employ 400 full-time staff, including more than 250 professional economists, industry experts, and business editors—one of the largest teams of macroeconomists and thought leadership specialists. Our global team is highly skilled in a full range of research techniques and thought leadership capabilities, from econometric modelling, scenario framing, and economic impact analysis to market surveys, case studies, expert panels, and web analytics.
Oxford Economics is a key adviser to corporate, financial and government decision-makers and thought leaders. Our worldwide client base now comprises over 1,500 international organizations, including leading multinational companies and financial institutions; key government bodies and trade associations; and top universities, consultancies, and think tanks.
March 2020
All data shown in tables and charts are Oxford Economics’ own data, except where otherwise stated and cited in footnotes, and are copyright © Oxford Economics Ltd.
This report is confidential to the Association of Swedish Higher Education Institutions and may not be published or distributed without their prior written permission.
The modelling and results presented here are based on information provided by third parties, upon which Oxford Economics has relied in producing its report and forecasts in good faith. Any
subsequent revision or update of those data will affect the assessments and projections shown. To discuss the report further please contact:
Andy Logan: alogan@oxfordeconomics.com
Alice Gambarin: agambarin@oxfordeconomics.com
Oxford Economics
4 Millbank, Westminster, London SW1P 3JA Tel: +44 (0)20 3910 8000
4
TABLE OF CONTENTS
Executive summary ... 4
1. Introduction... 7
Our Methodology ... 9
2. Universities and their multiplier impacts ... 11
2.1 The direct impact... 11
2.2 Universities’ multiplier impacts ... 15
2.3 Universities’ total expenditure impacts ... 18
3. Impact of international students and visitors spending ... 20
3.1 International students’ subsistence expenditure ... 20
3.2 Visitors’ expenditure ... 22
4. Economic impact of universities, the international students they attract and their visitors ... 24
5. Universities’ contribution to the Swedish economy’s productive capacity .... 27
5.1 Universities’ contribution to Swedish human capital ... 27
5.2 Universities’ contribution to productivity growth ... 31
Wider impacts... 34
6. Conclusion... 35
Methodological appendix ... 36
4
EXECUTIVE SUMMARY
The higher education sector makes a sizeable contribution to the Swedish economy and society at large. Universities educate hundreds of thousands of students from all parts of Sweden and the world every year, helping to build their human capital, which in turn augments the productive capacity of the local economy.
Universities also employ thousands of staff throughout the country and generate and deliver taxes to the national and municipal government. But on top of this, they also have an important part to play in supporting a wide range of industries—their supply chains stretch far and wide, contributing GDP and sustaining jobs, as the impact ripples through the economy (known as the “indirect” impact). In the wider consumer economy, the presence of universities is strongly felt, as their own staff and employees within their supply chains spend money on retail, accommodation, leisure and transport (known as the “induced” impact). Similarly, international students and their visitors also spend in the consumer economy.
Moreover, universities play a role in creating and supporting the initial development of graduates’ start-ups and driving innovation and creativity through knowledge transfer across Sweden. Each of these channels, in turn, supports further GDP, employment, tax receipts and wider economic benefits. While the latter are difficult to measure and quantify, they are nevertheless an important component of the sector’s contribution to the Swedish economy and are therefore acknowledged in this study.
This report starts by investigating the core economic impact of Swedish universities. In this study, this is measured annually in terms of their
contribution to national GDP, the jobs they support across the country, and the tax revenues they generate. It then focuses on how universities also have a longer-term impact, as they boost productivity of the Swedish economy by building human capital through the education they provide, and enhancing the wider pool of knowledge through academic exploration and research.
In 2017-18, Swedish universities directly employed 76,000 people, 53% of whom were female. By buying goods and services from Swedish firms in their supply chains, and through the consumer spending supported by the wages they pay their staff, an additional 41,000 jobs were sustained in that year. On top of the impact of universities themselves, expenditure of the almost 38,000 international students who studied at Swedish universities in 2017-18, and that of the friends and family who visited them, stimulated another 4,000 jobs.
Adding all of these employment impacts, we find that the activity of universities, the international students they attract and their visitors, supported more than 121,000 jobs in Sweden in 2017-18.1 This was
equivalent to 2.4% of all employment in Sweden. To give a sense of scale, this was larger than the entire population of Örebro, the seventh largest city in Sweden and one of the largest inland hubs of the country.
1 Employment is calculated on a “headcount” basis.
121,000 jobs
Contribution to employment supported in 2017-18 by Swedish universities, their international students and visitors to these students.
5
Universities’ own direct gross value added contribution, at SEK 49.6 billion in 2017-18, was as large as that made by a number of sizable industries. For example, it was almost as large as that produced by the agriculture, forestry and fishing industry across Sweden.
When also including multiplier impacts and the activity supported by international students and visitors, we estimate that universities
supporteda SEK 93.2 billion gross value added contribution to Swedish GDP in 2017-18. This accounted for 1.9% of all the economic activity
generated in the nation that year. Put another way, around SEK 1 in every SEK 52 of Swedish GDP was attributable to the activities of universities and their international students’ and visitors’ expenditure. This was equivalent to roughly half the gross value added produced by all firms and other institutions in Uppsala County.
Furthermore, Swedish universities, together with their international students and visitors, supported SEK 36.6 billion in tax revenues for the Swedish national and municipal government in 2017-18. This amount equated to over 80% of the direct funding Swedish universities received from
government sources in the same year. Over 98% of this was related to universities own activities and procurement.
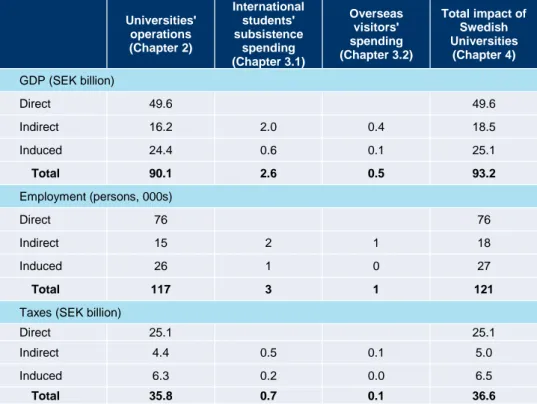
Fig. 1. The economic impact of Swedish universities, 2017-18
Universities' operations (Chapter 2) International students' subsistence spending (Chapter 3.1) Overseas visitors' spending (Chapter 3.2) Total impact of Swedish Universities (Chapter 4) GDP (SEK billion) Direct 49.6 49.6 Indirect 16.2 2.0 0.4 18.5 Induced 24.4 0.6 0.1 25.1 Total 90.1 2.6 0.5 93.2 Employment (persons, 000s) Direct 76 76 Indirect 15 2 1 18 Induced 26 1 0 27 Total 117 3 1 121
Taxes (SEK billion)
Direct 25.1 25.1 Indirect 4.4 0.5 0.1 5.0 Induced 6.3 0.2 0.0 6.5
Total 35.8 0.7 0.1 36.6
Source: Oxford Economics
Despite all the short-term benefits universities bring, it is their ability to boost the productive capacity (or supply side) of the economy that matters in the longer term. We estimate the education universities provided in 2017-18 increased the value of graduates’ human capital by some SEK 83.6 billion. In other words, for every SEK 1 students invest in their higher education in the
SEK93.2 bn
Contribution to GDP supported in 2017-18 by Swedish universities, their international students and visitors to these students.
SEK36.6 bn
Tax contribution supported in 2017-18 by Swedish universities, their international students and visitors to these students.
6 form of forgone money while studying, they receive a cumulative of SEK 3.30 in higher future earnings.
Moreover, innovation through research and development plays a fundamental role in sustaining long-run economic growth. In 2017-18, universities undertook SEK 38.8 billion of R&D. This was estimated to have delivered benefits equating to SEK 6.7 billion in GDP, equivalent to SEK 1,300 for every household in Sweden.
In addition to their core economic impacts, the higher education sector makes a significant contribution to Sweden’s knowledge economy. Universities upskill students and boost their productive potential; some of them then become entrepreneurs and start their own businesses, often with support from their university. The higher education sector also plays a vital role in fostering innovation in Sweden, with its wide-ranging research helping to generate new ideas and apply them in a business setting. Universities also benefit Swedish firms through their business support, which is achieved through knowledge transfers, research collaborations, and consultancy activities. These impacts show the wider critical role of universities in shaping the Swedish economy.
SEK38.8 bn
Amount invested by Swedish universities on R&D during 2017-18.
7
1. INTRODUCTION
This study, commissioned by SUHF—the Association of Swedish Higher Education—provides an assessment of universities’ contribution to the economy of Sweden. It does so in three ways. First, it employs a standard approach called economic impact assessment to model universities’ economic
impact in terms of their annual contribution to GDP, employment and tax revenues, using Swedish Higher Education Authority’s (UKÄ) data. This explores the short-term impacts of 45 universities, colleges, artistic colleges, and individual training coordinators as they stimulate economic activity across Sweden.2
The assessment focuses on their operational, supply chain and wage payment spending in 2017-18. As part of this exercise, it also looks at the subsistence expenditure of the international students and the visitors that universities attract. This is additional expenditure in the Swedish economy, so creates extra economic activity and employment beyond that generated by Swedish
residents’ spending.3
Furthermore, in recognition of the wider role universities play, the report looks at the longer-term impacts these have on the Swedish economy. In particular, we look at how universities increase the long-run productive potential of the economy, sometimes referred to as “supply side” developments.
This study looks at two of the major ways universities impact the supply side of the economy. First, it looks at the impact universities have on workforce productivity, through raising the level of human capital. This enhances the available pool of skills and capabilities firms and other employers can access in Sweden. Second, the report also investigates the benefits universities’ research and innovation deliver to the Swedish economy. This research may result in new products and services or might improve existing ones. As there is considerable controversy over the best way of estimating both effects, the estimates should be regarded as illustrative.
Last but not least, staff and students at Swedish universities enhance the local economy in notable other ways. Universities help build students’ human capital, which in turn augments the productive capacity of the economy. Such creative knowledge and education in turn boost innovation among businesses in Sweden. All these softer positive impacts are difficult to quantify, but
nonetheless constitute important contributions of the Swedish higher education sector that it is important to acknowledge.
The report is structured as follows:
2 The full list of institutions can be found in the appendix.
3 It is important to note that Swedish students also spend money locally while studying for their degree. Most of
this subsistence spending is likely to be funded through government-funded student grants and loans. Such living expenses create wider economic benefits for the Swedish economy. However, we cannot argue that these students’ expenditure is truly “additional” to the Swedish economy, because, even if universities didn’t exist, the majority of students would likely get a job and stay in Sweden. Therefore, subsistence spending of domestic students is not incorporated in the total economic contribution of Swedish universities to the Swedish economy.
8
• Chapter 2 demonstrates the economic impact of universities’ expenditure and the activity that they stimulate around the Swedish economy;
• Chapter 3 looks at the expenditure undertaken by the international students and visitors that universities attract to Sweden;
• Chapter 4 summarises the expenditure impacts generated by universities, the international students and the visitors they attract;
• Chapter 5 highlights how universities enhance the productive potential of the Swedish economy, through their educational role and their investment in R&D.
9
OUR METHODOLOGY
This study quantifies the contribution universities make to the Swedish economy using a standard means of analysis called economic impact assessment. The results presented are for the academic year ended June 2018, reflecting the latest year for which UKÄ data were available at the time of writing.
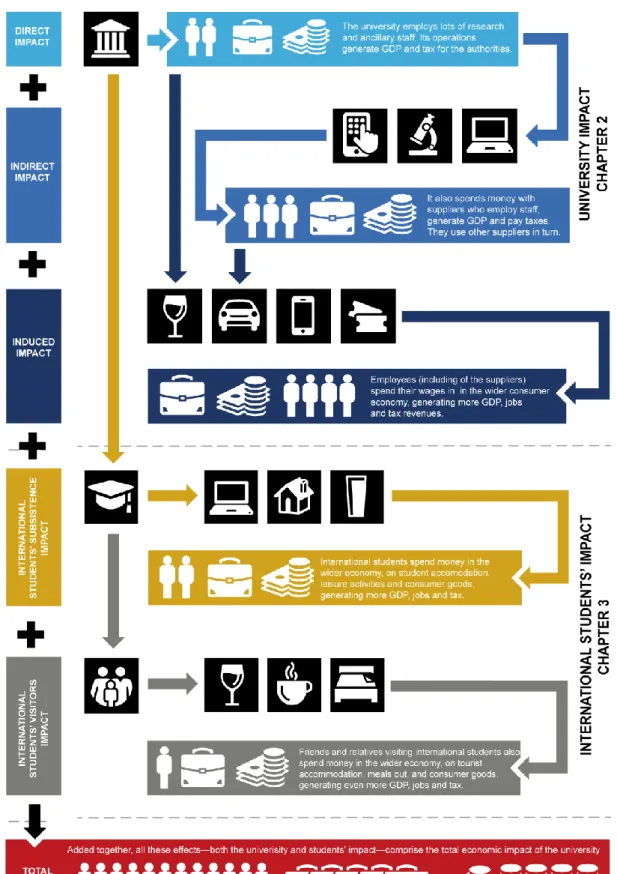
To assess the contribution universities make to the economy, this report quantifies the impact of three types of expenditure undertaken by Swedish universities (also summarised in Fig. 2):
• Direct impact relates to the operational expenditure universities undertake to supply their teaching and research activities.
• Indirect impact is the result of universities’ expenditure on inputs of goods and services from Swedish suppliers. Additionally, this impact includes international students’ subsistence expenditure and the spending of their visitors.
• Induced impact arises as universities, the firms in their supply chains, and firms in the supply chains of businesses providing the consumer goods purchased by international students and visitors, pay their staff wages. These workers spend their earnings in retail, leisure and other outlets. These impacts then ripple out across these outlets’ Sweden-based supply chains.
The sum of these channels makes up the total of the higher education sector’s expenditure impacts. The economic contribution is measured using three metrics:
• Gross value added (GVA) contribution to Gross Domestic Product (GDP) is a measure of net output.4 It is defined as the value of an industry’s sales minus the
value of inputs of goods and services used up in their production. It is the measure Statistics Sweden (SCB) uses to quantify the contribution to the economy of each individual producer, industry or sector.
• Employment ismeasured on a headcount basis to facilitate comparison with employment data for other industrial sectors sourced from the SCB.
• Tax revenues flowing to the Swedish national and municipal government, including all income taxes, social security contributions, and corporation taxes attributable to universities’ activities.
The results are presented on a gross rather than a net basis. They therefore ignore any displacement of activity from other sectors, nor do they consider what the resources currently used by universities, or stimulated by their expenditure, could alternatively produce in their second most productive usage. This is because it is impossible to know what the labour and capital would have produced if they were employed in their second most productive use. Through their work, Swedish universities generate benefits not only for the economy, but also for wider society. For example, they boost productivity by providing high-quality education, and foster innovation with their R&D. These wider channels of impact are analysed in Chapter 5.
4 GDP measures the total economic output of a country. It is used to judge the rate of growth of the economy,
and to define whether the country enters a recession. GDP equals the sum of GVA and taxes minus subsidies on production.
10
11
2. UNIVERSITIES AND THEIR
MULTIPLIER IMPACTS
This chapter investigates the economic activity stimulated by Swedish universities through their own operations, and the expenditure required to provide teaching, research, and other services. It looks at the three channels of expenditure they support and the activity this spending stimulates. These are: universities’ own operational spending; the impact of their procurement from suppliers located in Sweden; and the payment of wages by the higher education sector and its suppliers to workers based in the country.
2.1 THE DIRECT IMPACT 2.1.1 Income
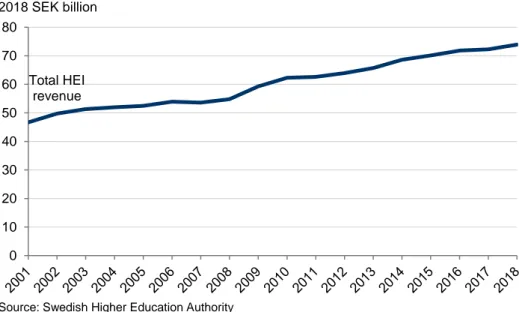
In 2017-18, universities in Sweden received SEK 73.9 billion in income.5
Since 2017, the sector’s income has risen by SEK 3.0 billion in nominal terms or 4.3%. After allowing for price inflation, this equated to 2.3% growth in real terms. Over the period 2001-18, the revenue of the higher education sector in Sweden has grown by an average real annual growth rate of 2.7%.
Fig. 3. Total revenue of Swedish HEIs, constant prices, 2001-18
In 2017-18, direct government funding provided universities with SEK 44.3 billion in income, or 60% of their total earnings. Grants from other organisations (like research funding agencies and foundations) were the second largest source of income, providing SEK 21.8 billion, or 29% of the
5 UKÄ, “Resultaträkning (tkr)”,
https://www.uka.se/statistik--analys/statistikdatabas-hogskolan-i-siffror/ekonomi.html?indicator=resultatrakning Total HEI revenue 0 10 20 30 40 50 60 70 80 M il li on s
Source: Swedish Higher Education Authority
12 total. Income from fees and other remuneration was third in importance, with funding of SEK 7.7 billion, or 10% of the total.
Fig. 4. Universities’ income by source, 2017-18
2.1.2 Gross value added
Income does not isolate the contribution universities make to the Swedish economy, as it includes the value of inputs purchased from other industries. Therefore, this section focuses on universities’ direct gross value added contribution.In 2017-18, universities made a SEK 49.6 billion gross value added contribution.This was equivalent to 1.0% of the Swedish GDP.6 The
higher education sector contributes to GDP mainly through the wages it pays out to its staff (Fig. 5).
Since 2017, universities’ direct gross value added contribution rose by 2.2% in real terms, as a result of both an increase in employee compensation and gross operating surplus. In both years, 93% of the GVA contribution came through staff costs.
6 Swedish GDP data were sourced from SCB and downloaded through Haver.
44.3 7.7
21.8
0.2
Direct government funding (including framework funding)
Income from fees and other remuneration (including capital gains from sale of fixed assets)
Grants from other organisations (research funding agencies, foundations..)
Financial income (interest income, exchange rate gains and returns from financial assets)
Source: Swedish Higher Education Authority
13
Fig. 5. Gross value added contribution to GDP made by universities, 2017-18
To give a sense of scale, universities’ direct gross value added contribution to GDP was almost as large as that produced by human health activities (Fig. 6).7
Fig. 6. Industry comparisons by gross value added contributions in 2018
2.1.3 Employment
Universities provide significant numbers of jobs all around Sweden. In 2017-18, Swedish higher education institutions employed 76,200 people.8 This
7 Gross value added comparators were sourced from SCB and downloaded through Haver.
8 Employment on a “headcount” basis. This is equivalent to 61,400 full-time equivalent jobs (SCB: Employees in
higher education). Compensation of employees 46.3 Gross operating surplus 3.3
Source: Swedish Higher Education Authority
SEK billion 66.4 52.8 49.6 47.0 33.2 31.9
Agriculture Forestry & Fishing
Human Health Activities
HEI
Food, Beverages, and Tobacco
Rubber Plastic & Non-Metallic Minerals Furniture & Other Manufacturing
Installation
0 10 20 30 40 50 60 70
Source: Haver, Oxford Economics
14 was equivalent to around 1.5% of all people in employment across the
country.9 This was roughly 13% of the 590,000 people employed in the
education sector.10
To help support the sector’s expansion, over the past year, the number of people employed at universities grew by 0.9%. Since 2001, total
employment in the sector increased by 27%; this was a faster rate of growth than the whole economy, where employment increased by 18% over the same period.11
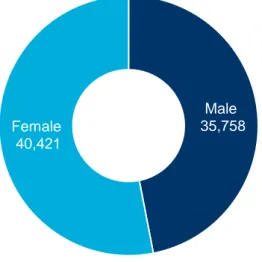
Universities are key employers of female workers. In 2017-18 they
employed just over 40,400 female staff, accounting for 1.7% of Swedish female employment. This was 53% of their total workforce (Fig. 7), a greater proportion than the share of female employees in the whole economy (48%).
Fig. 7. University employment by gender, 2017-18
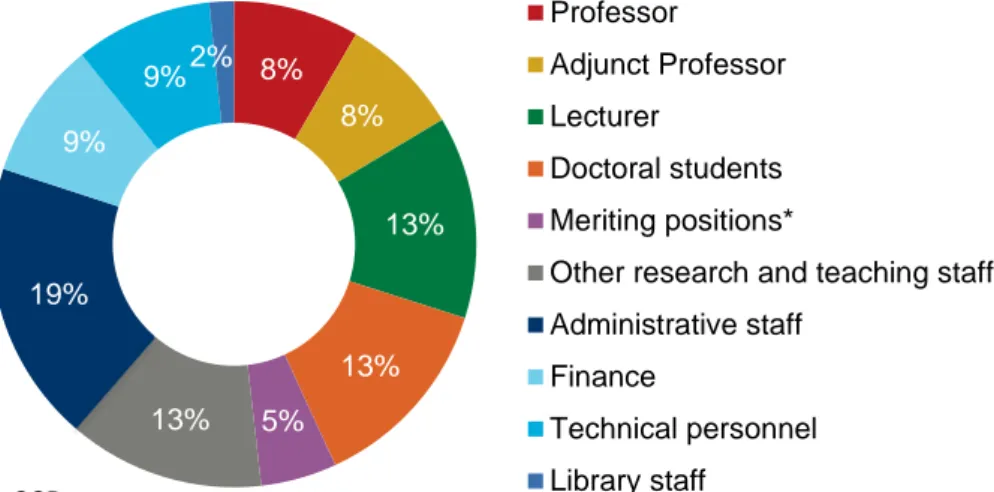
Universities employ a range of people across the skills spectrum. Some 30% of universities’ workforce was employed in academic occupations in 2017-18 (including professors, lecturers, and adjunct professors), while
administrative staff comprised another 19% of the workforce.
9 Based on 5.1 million working age people in employment in Sweden, sourced from SCB’s Labour Force Survey
and downloaded through Haver.
10 SCB data, downloaded from Haver.
11 Calculated using data on the number of working age people in employment in Sweden, sourced from SCB’s
Labour Force Survey and downloaded through Haver.
Male 35,758 Female 40,421 Source: SCB Number of employees
15
Fig. 8. Share of employment by occupation, 2017-18
Universities’ workforce is also highly international. Some 35% of the teaching and research staff were either born outside Sweden or by parents both born abroad. Among professors and university lecturers, the percentage was 28% and 26%, respectively.
2.1.4 Tax receipts
The sector’s significant workforce in Sweden also means that it makes a substantial contribution to tax authorities across the Swedish national and municipal government. In 2017-18, universities and their staff made an estimated SEK 25.1 billion tax contribution. This figure encompasses both types of labour taxes, namely income tax, and employer social security contributions.12
These tax contributions would be sufficient to cover the 2018 central government expenditure on financial support for students (SEK 21.2 billion spent in 2018).13 Further, they accounted for over half (57%) of the
direct government funding received by universities in 2017-18.
2.2 UNIVERSITIES’ MULTIPLIER IMPACTS
However, the economic impact of universities in Sweden extends far beyond their direct operations. The higher education sector also purchases inputs of goods and services from Swedish suppliers and pays wages that are then spent in the consumer economy. These knock-on impacts ripple out across the economy, touching all corners of Sweden.
12 Income tax contributions have been estimated using average salaries for selected occupations (in specific,
SSYK 2313: Professors; SSYK 2314: University and higher education lecturers; SSYK 2315: Research assistants; SSYK 2316: PhD Students; SSYK 2321: University and higher education teachers not elsewhere classified; SSYK 2624: Librarians and archivists; and SSYK 3361: Administrative secretaries and related associate professionals) and data on municipal, national income tax and social security allowances and rates.
13 Ministry of Finance, Central government budget in figures, 18 September 2019.
8% 8% 13% 13% 5% 13% 19% 9% 9%2% Professor Adjunct Professor Lecturer Doctoral students Meriting positions*
Other research and teaching staff Administrative staff
Finance
Technical personnel Library staff
Source: SCB
* Meriting positions refer to those who are employed as research assistants, assistant lecturers or have postdoctoral employment
16
2.2.1 Universities’ indirect impacts
Universities purchase inputs from a wide range of suppliers and this
procurement expenditure stimulates economic activity across many industrial sectors throughout the Swedish economy. This spending supports employment, gross value added, and tax receipts across the country.
In 2017-18, universities’ procurement spending totalled SEK 21.7 billion,
of which SEK 19.6 billion, or 90%, is estimated to have been spent with Swedish suppliers in industries other than the education sector.14 Of this, real
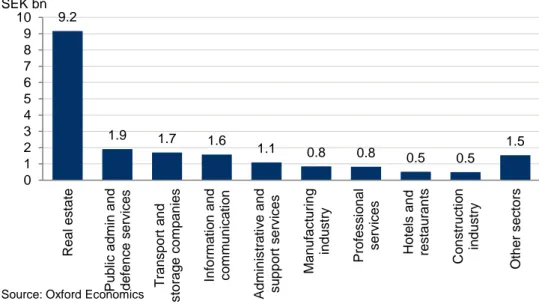
estate (premise-related expenses, including rents) and the public administration sector benefited the most from universities’ operational procurement, receiving 47% and 10% of spending, respectively (Fig. 9).
Fig. 9. Universities’ operational expenditure by industry, 2017-18 15
This procurement stimulates economic activity along the sector’s Swedish supply chain, as, in turn, universities’ suppliers make purchases from their own supply chains.
In 2017-18, we calculate that universities’ SEK 19.6 billion procurement from Swedish businesses supported a SEK 16.2 billion gross value added contribution to Swedish GDP along the sector’s domestic supply chain.
Industries which experienced the largest boost to their gross value added from this procurement were real estate and administrative and support services (Fig. 10), accounting for 35% (SEK 5.6 billion) and 9% (SEK 1.4 billion) of the gross value added supported at universities’ suppliers, respectively. Universities- supported activity in information and communication services also collectively contributed another SEK 1.4 billion to Swedish GDP in 2017-18.
14 Education spending has not been included in the supply chain impact as it is captured in the direct impact. 15 Basic prices exclude expenditure on taxes and imports.
9.2 1.9 1.7 1.6 1.1 0.8 0.8 0.5 0.5 1.5 Rea l e s ta te Pu b lic a d m in a n d d e fe n c e s e rv ic e s Tra n s p o rt a n d s tora g e c om p an ies In fo rm a ti o n a n d c o m m u n ic a ti o n Ad m in is tra ti v e a n d s u p p o rt s e rv ic e s M a n u fa c tu ri n g in d u s try Pro fe s s io n a l s e rv ic e s Ho te ls a n d re s ta u ra n ts Con s tru c ti o n in d u s try O th er s ec to rs 0 1 2 3 4 5 6 7 8 9 10
Source: Oxford Economics
17
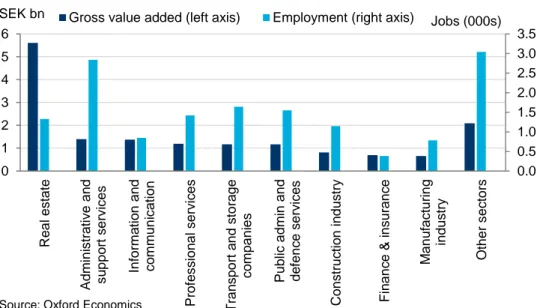
Fig. 10. The employment and gross value added universities support along their supply chain by industrial sector, 2017-18
This indirect GDP impact was associated with an employment
contribution of almost 15,000 jobs in Sweden in 2017-18. Some19% of these were in the administrative services sector, and a further 11% were employed by the transport and storage sector. Fewer jobs were supported in real estate and ICT, compared to their share of gross value added, as these sectors have higher labour productivity.
Universities’ supply chain expenditure is estimated to have generated SEK 4.4 billion in tax receipts along its supply chain. This encompasses corporation tax and labour taxes, such as income tax and social security contributions.
2.2.2 Universities’ induced impact
The third and last expenditure channel is the “induced” impact. This describes the gross value added, employment, and tax receipts supported by the universities’ and their suppliers’ payment of wages to staff, who spend a proportion of this income in the consumer economy.
In 2017-18, the higher education sector paid its employees in Sweden a total of SEK 37.6 billion in gross wages.16 University employees, and
workers at firms in universities’ supply chains, spend part of their disposable income at retail, leisure and other outlets. This in turn supports economic activity at these establishments, and in those businesses’ domestic supply chains.
We estimate that this wage-financed consumption supported a SEK 24.4 billion contribution to GDP in 2017-18. The employment created by wage-financed consumer spending benefits a wide range of industries. The greatest
16 This was estimated using average salaries for selected occupations and the numbers employed by the higher
education sector in each specific occupation. The total grass wage figure was then cross checked against UKÄ’s staff costs figure to ensure consistency.
0.0 0.5 1.0 1.5 2.0 2.5 3.0 3.5 R ea l e s ta te Ad m in is tra ti v e a n d s u p p o rt s e rv ic e s In form a ti o n an d c o m m u n ic a ti o n Pro fe s s io n a l s e rv ic e s Tra n s p o rt a n d s to ra g e c o m p a n ie s Pu b lic a d m in a n d d e fe n c e s e rv ic e s Con s tru c ti o n i n d u s try Fi n a n c e & in s u ra n c e M a n u fa c tu ri n g in du s try O th e r s e c to rs 0 1 2 3 4 5 6 Th ou s a nd s
Gross value added (left axis) Employment (right axis)
Source: Oxford Economics
SEK bn
18 boost in value added was seen in real estate (Fig. 11), and the retail trade sector, where gross value added increased by SEK 5.2 billion and SEK 4.2 billion, respectively.
Fig. 11. The employment and gross value added supported by universities’ and their suppliers’ payment of wages, 2017-18
Wage-consumption is estimated to have supported 26,200 jobs in 2017-18. The employment supported by this wage-financed consumer spending benefits a wide range of industries, with the pattern of activity by sector very different to that seen in the indirect channel. Some 4,800 people, or 18% of the total, were employed in the retail and wholesale industry, while 3,300 people, or 13%, worked in the hospitality industry (including at restaurants, hotels, and amusement and recreational services providers).
Swedish universities’ wage consumption impacts supported some SEK 6.3 billion in tax contributions. This encompasses corporation taxes and labour taxes such as income tax and social security contributions.
2.3 UNIVERSITIES’ TOTAL EXPENDITURE IMPACTS
Aggregating across the direct, indirect and induced economic impacts, we calculate that universities’ total economic contribution to Swedish GDP amounted to SEK 90.1 billion in 2017-18. This equated to 1.9% of the economic activity that occurred in Sweden in the same year. To put this into context, universities supported a similar gross value added contribution to the entire GDP of Kalmar County, home to the island of Öland, designated as a World Heritage Site by UNESCO.
Analysis of where the gross value added was created suggests that some SEK 49.6 billion was generated at universities themselves, and SEK 40.6 billion elsewhere in the economy (Fig. 12). This suggests universities’ gross value added multiplier was 1.82, so for every SEK 1 million in gross value added generated on campus, a further SEK 0.82 million in gross value added was supported elsewhere in the Swedish economy.
0.0 1.0 2.0 3.0 4.0 5.0 6.0 7.0 8.0 R ea l e s ta te Tra d e Fi n a n c e & in s u ra n c e In fo rm a ti o n a n d c o m m u n ic a ti o n Hum a n h e a lth a n d s o c ia l wo rk Tra n s p o rt a n d s to ra g e c o m p a n ie s M a n u fa c tu ri n g in d u s try Ad m in is tra ti v e a n d s u p p o rt s e rv ic e s Hot e ls a n d re s ta u ra n ts O th e r s e c to rs 0 1 2 3 4 5 6 Th ou s a nd s
Gross value added (left axis) Employment (right axis)
Source: Oxford Economics
19
Fig. 12. Total impact of Swedish higher education institutions, 2017-18
In 2017-18, universities’ impact on the Swedish labour market amounted to 117,400 jobs. This equated to roughly 2.3% of all employment in Sweden. Universities therefore had an employment multiplier of 1.54. In other words, for every 100 jobs located on campus, universities supported a further 54 jobs in other industries across the Swedish economy.
Further, summing the three channels of impact, we find that universities’ expenditure supported around SEK 35.8 billion in tax receipts in 2017-18.
This encompasses corporation tax and labour taxes (including income tax, and employer social security). This tax revenue was equivalent to 3.3% of total central government revenue in that year.17
17 Government Offices of Sweden, "Central government budget in figures"
<https://www.government.se/articles/2019/09/central-government-budget-in-figures/> [accessed 28 October 2019] 49.6 25.1 16.2 4.4 24.4 6.3 90.1 35.8 76 15 26 117 0 20 40 60 80 100 120 140
Gross value added (left axis)
Tax (left axis) Employment (right axis) 0 10 20 30 40 50 60 70 80 90 100 Th ou s a nd s Bill io ns
Direct Indirect Induced
Source: Oxford Economics
20
3. IMPACT OF INTERNATIONAL
STUDENTS AND VISITORS
SPENDING
3.1 INTERNATIONAL STUDENTS’ SUBSISTENCE EXPENDITURE
Every year, universities attract a substantial number of overseas students into Sweden. These students then spend money on a wide range of goods,
services and activities in the local economy. As this expenditure is additional to that undertaken by Swedish residents, it creates extra activity in the domestic economy.
This chapter analyses the number of international students who come to Sweden to study and the scale of their off-campus subsistence spending. The term off-campus implies the income is not received by the university at which they study. Therefore, expenditures on university-provided course-related activities such as tuition fees and field trips are excluded, as the value of this spending is captured in Chapter 2 of this report. This section presents the number of jobs, the gross value added and tax receipts international students’ off-campus subsistence spending generates in Sweden.
There were approximately 37,800 international students enrolled at Swedish universities in 2017-18, up from 35,900 in the previous academic year (Fig. 13).Figures show that 64% of them were full degree students (24,300), while the remaining 36% were exchange students (13,600). International students accounted for 11% of the student body registered at Swedish universities. The most represented countries were Germany, Finland and China.
Fig. 13. International students enrolled at Swedish universities
0 5,000 10,000 15,000 20,000 25,000 30,000 35,000 40,000 45,000 50,000 19 97 /98 19 98 /99 19 99 /0 20 00 /01 20 01 /02 20 02 /03 20 03 /04 20 04 /05 20 05 /06 20 06 /07 20 07 /08 2 0 0 8 /0 9 20 09 /10 20 10 /11 20 11 /12 20 12 /13 20 13 /14 20 14 /15 20 15 /16 2 0 1 6 /1 7 20 17 /18
21
International students spent an estimated SEK 2.4 billion in the Swedish economy in 2017-18. This figure includes subsistence spending like
accommodation, food, and leisure activities. Student subsistence spending has been calculated using the cost of living in Sweden, produced by Study in Sweden, an organisation promoting Sweden as a higher education destination.18
We have not made an allowance for the proportion of subsistence spending funded by Swedish earnings. This is because evidence suggests that, while international students are allowed to work while studying in Sweden, opportunities for part-time work are limited and most jobs require knowledge of Swedish.
The subsistence spending of international students generated an
estimated SEK 2.6 billion of gross value added in Sweden in 2017-18. This economic activity was stimulated both from the initial supplier and along their supply chain, but also through the wage consumption impacts detailed as part of the induced impact.
Rent payments for accommodation meant the real estate sector benefitted the most from international students’ expenditure. Its gross value added contribution was almost SEK 870 million, or 34% of the total impact from this expenditure (Fig. 14).
The hospitality and entertainment sectors were also significant
beneficiaries of the international students’ subsistence spending. The SEK 320 million and SEK 240 million boost to their gross value added
comprised 12% and 9% of the total increase in value added from the presence of the international students, respectively.
International students’ subsistence expenditure supported an estimated 2,900 jobs in Sweden in 2017-18. Of these,nearly 880 jobs, or 30%, were in the hospitality sector. The entertainment sector was the second largest beneficiary, with an additional 450 jobs, or 15% of the total due to the international students spend.
18 "Cost of Living in Sweden", in Study in Sweden <https://studyinsweden.se/life-in-sweden/cost-of-living/>
[accessed 9 August 2019] It should be noted that no allowance was made for university-provided housing. This is because UKÄ’s report suggests that, unlike other countries where supplying accommodation is the responsibility of the university, in Sweden housing is paid for by the student. In other words, we assumed that international students do not reside in university-provided accommodation. Similarly, Swedish universities tend to not provide internal catering facilities, so expenditure on food and meals was treated as off-campus.
22
The impact of international students’ off campus subsistence spending, 2017-18
The economic activity and employment sustained by international students’ subsistence spending also generated SEK 660 million in tax revenues for the Swedish national and municipal government in 2017-18.
This figure encompasses corporation tax and labour taxes (including income tax and social security contributions). It was sufficient to pay the salaries of 1,820 social workers.19
3.2 VISITORS’ EXPENDITURE
Friends and relatives might visit international students studying at Swedish universities. Parents may travel to Sweden to drop off or collect their children, attend open days and graduation ceremonies, or visit whilst on holiday. As the expenditure they undertake in Sweden is additional to that spent by local residents, it stimulates extra economic activity within the country.
Unfortunately, it is not known how many visitors from home each international student receives. The analysis (described in detail in the appendix) uses data on students’ nationality, the nationality of the wider population, and the origin of visitors to friends and relatives in Sweden to estimate the number of visitors each student receives, and how much they spend.
In 2017-18, visitors to international students in Sweden spent an estimated SEK 530 million. In the first place, this expenditure is likely to benefit the retail and hospitality sectors. However, such impact will also ripple out along their supply chains to the rest of the economy, with the associated wage-consumption impacts.
19 SCB, “Average monthly pay, pay dispersion etc., non-manual workers private sector (SLP) by occupational
(SSYK 2012), sex, observations and year”. The average total pay for a social worker was SEK 362,400 per annum in 2018. 0 100 200 300 400 500 600 700 800 900 1,000 Re a l e s ta te H ot e ls an d re s ta u ra n ts Es ta b lis h m e n ts fo r a rts , en te rt a in m e nt… Tra d e Tra n s p o rt a n d s to ra g e c o m p a n ie s Fi n a n c e & in s u ra n c e Ad m in is tra ti v e a n d s u p p o rt s e rv ic e s In fo rm a ti o n a n d c o m m un ic a ti on Pro fe s s io n a l s e rv ic e s O th e r 0.0 0.1 0.2 0.3 0.4 0.5 0.6 0.7 0.8 0.9
1.0 Gross value added (left axis) Employment (right axis)
Source: Oxford Economics
23
Overseas visitors’ spending generated an estimated SEK 500 million in gross value added in 2017-18. It supported a further 750 jobsandSEK 150 million in tax receipts.
Fig. 15. The impact of visitors to international students, 2017-18
0 50 100 150 200 250 300 350 Tra d e Hot e ls a n d re s ta u ra n ts Rea l e s ta te Tra n s p o rt a n d s to ra g e c o m p a n ie s O th e r s e rv ic e c o m p a n ie s Ad m in is tra ti v e a n d s u p p o rt s e rv ic e s Es ta b lis h m e n ts fo r a rts , e n te rt a in m e n t a n d re c re a ti o n Fi n an c e & i ns ura nc e Pro fe s s io n a l s e rv ic e s O th e r 0.0 0.0 0.0 0.1 0.1 0.1 0.1 0.1 0.2
Gross value added (left axis) Employment (right axis)
Source: Oxford Economics
24
4. ECONOMIC IMPACT OF
UNIVERSITIES, THE
INTERNATIONAL STUDENTS THEY
ATTRACT AND THEIR VISITORS
The total economic contribution universities make to the Swedish economy is the sum of the three different streams of expenditure they support. This includes the expenditure they undertake to operate, their procurement and payment of wages (Chapter 2); the expenditure of the international students they attract into Sweden (Section 3.1); and those students’ visitors’ expenditure (Section 3.2).
In 2017-18, universities’ expenditure, and that of their international students and their visitors, stimulated SEK 93 billion of gross value added (Fig. 16). This accounted for 1.9% of Swedish GDP in the same period. Put another way, around SEK 1 in every SEK 52 of Swedish GDP was
attributable to the activities of universities and their international students and visitors.
Of this contribution, SEK 50 billion, or 53%, was generated by universities themselves on campus. Their procurement expenditure and payment of wages stimulated another SEK 41 billion elsewhere in the economy or 44% of the total. The international students’ and their visitors’ expenditure jointly supported the remaining SEK 3 billion, or 3%.
Fig. 16. Total gross value added sustained by Swedish universities, 2017-18
In total, universities and their international students and visitors
supported over 121,000 jobs in 2017-18. This was equivalent to 2.4% of total
50 50 50 50 41 41 41 3 0.5 93 Universities themselves Universities' supply chain and
wage-financed spending Additional students' subsistence spending Visitors to additional students' spending Total 0 10 20 30 40 50 60 70 80 90 100 Bill io ns
Source: Oxford Economics
25
Swedish employment. Of this employment, more than 76,000 workers, or 63%, were employed by the universities themselves. A further 41,000 jobs, or 34%, were supported by universities’ indirect and induced impacts (Fig. 17). Another 4,000 jobs, or 3%, were sustained by international students and their visitors’ expenditure.
Fig. 17. Total employment supported by Swedish universities, 2017-18
Swedish universities supported SEK 37 billion in tax receipts for the Swedish national and municipal government in 2017-18 (0). Over 98% of this was related to universities own activities and procurement. The total tax contribution was equivalent to 3.4% of total central government revenue in the same period and it equated to over 80% of the direct funding universities received from government sources in 2017-18.
76 41 3 1 121 Universities themselves Universities' supply chain and
wage-financed spending Additional students' subsistence spending Visitors to additional students' spending Total 0 20 40 60 80 100 120 140 Th ou s a nd s
Source: Oxford Economics
26
Fig. 18. Total impact of Swedish universities, their international students and overseas visitors, 2017-1820
Universities' operations (Chapter 2) International students' subsistence spending (Chapter 3.1) Overseas visitors' spending (Chapter 3.2) Total impact of Swedish Universities (Chapter 4) GDP (SEK billion) Direct 49.6 49.6 Indirect 16.2 2.0 0.4 18.5 Induced 24.4 0.6 0.1 25.1 Total 90.1 2.6 0.5 93.2 Employment (persons, 000s) Direct 76 76 Indirect 15 2 1 18 Induced 26 1 0 27 Total 117 3 1 121
Taxes (SEK billion)
Direct 25.1 25.1 Indirect 4.4 0.5 0.1 5.0 Induced 6.3 0.2 0.0 6.5 Total 35.8 0.7 0.1 36.6
20 As explained, subsistence spending of Swedish students is not considered part of the total economic impact,
as such spending cannot be treated as truly “additional” to the Swedish economy. The majority of Swedish university students would have remained in Sweden even if the university sector did not exist.
27
5. UNIVERSITIES’ CONTRIBUTION
TO THE SWEDISH ECONOMY’S
PRODUCTIVE CAPACITY
When assessing the value that universities deliver to the Swedish economy, it is possible to consider either the expenditure impacts (known as demand-side) or the impact universities have on the productive capacity of the economy (known as supply-side). An example of demand-side analysis is the standard economic impact approach, which traces the footprint from the spending of universities, international students and their visitors, and has been undertaken in Chapters 2 to 4.
However, the Swedish higher education sector also contributes important “supply side” impacts, through improving the productive capacity of the
economy. Two of the most conspicuous ways that universities achieve this are through improving the Swedish skill base, and through driving innovation with their research and development activities. The remainder of this chapter presents an exploration of those impacts.
The findings presented in this section cannot be considered “additive” to those presented in Chapters 2 to 4. The demand-led analysis considers the impact that university-linked expenditures has on economic metrics such as GDP or employment (impacts that may have arisen anyway, in the absence of
universities’ activities) in a particular year. By contrast, the supply-side impacts discussed here describe how universities boost the productive potential of the economy year after year. The difference between potential and actual, and the different timeframes, mean it is not possible to add the two impacts.
While the scale of the contributions described in this Chapter is substantial, the real contribution of Swedish universities is far greater than these numbers suggest, as there are limits to our ability to measure economic value. For instance, the Swedish higher education sector is involved in a broad variety of world-leading research that will contribute to building the grounds for the know-how of the future. Yet, considerable time lags and difficulty attributing outcomes to individual entities make it hard to measure these contributions.
Moreover, Swedish universities have numerous wider impacts, which, though often difficult to quantify, are equally significant (see the remainder of this Chapter, as well as the box on page 34). For example, universities drive business growth by helping their researchers and students develop business ideas and turn them into companies. While this activity clearly creates economic value, we were unable to identify Sweden-wide statistics on the number of businesses directly supported by higher education institutions and therefore could not quantify this potentially sizeable contribution.
5.1 UNIVERSITIES’ CONTRIBUTION TO SWEDISH HUMAN CAPITAL
On average, across OECD countries, adults (age 25-64) with a tertiary degree have an earnings advantage of about 54% compared to those with upper
28 secondary education (Fig. 19). In Sweden, the relative earnings of tertiary degree holders are well below the OECD average, even though the share of educated people is large (47% in 2017). However, Swedish tertiary-educated people have among the highest employment rates across OECD countries, at 89% in 2017.
Even if relatively smaller than in other OECD countries, gaining a tertiary degree in Sweden brings about positive income uplifts, as illustrated in the remainder of this section.
In 2017-18, some 349,300 students attended and 65,600 graduated from a university in Sweden. For the graduates that remain in the country, the education received willdeepen the pool of skills available within the workforce, which is a driver of productivity and growth. In other words, universities
contribute to enhancing the Swedish stock of human capital. Human capital describes the aggregate knowledge and skills of individuals within the Swedish labour market, which are accumulated over time and used in the production of goods and services. It is an important indicator of an economy’s long-term health, with higher levels of human capital associated with greater potential output in the future.
The approach adopted for this report follows the method used by the European Commission’s Guide to CBA.21 This method estimates the discounted (present)
value of individuals’ future lifetime employment income.22 This approach
enables us to assess the value of universities’ investment in skills by measuring the difference that their qualifications make to their lifetime incomes. This reflects the increased productivity associated with higher education.
In this section, we measure the impact of universities’ investment on human capital during the 2017-18 academic year. For this assessment, we mapped out the average lifetime earnings patterns of students graduating from university or college against what they would have earned if they had any other lower level of education.
We then aggregated the graduate earnings premium across their lifetime for the 65,600 graduates in 2017/18, factoring in their age. We find that universities’ investment in skills during 2017-18 increased the Swedish stock of human capital by some SEK 83.6 billion. This reflects the change in highest qualification level among degree holders during that year.
This number is calculated as the net present value of all post-degree earnings (SEK 120.7 billion) minus the net present value of all the costs associated with the degree (37.1 billion). 23 Dividing the former by the latter yields a benefit-cost
ratio of 3.3. In other words, for every SEK 1 students invest in their higher education in the form of forgone money while studying, they receive a cumulative of SEK 3.30 in higher future earnings.
21 European Commission, "Guide to Cost-Benefit Analysis of Investment Projects", December 2014. 22 For more detail on this methodology, see Appendix.
23 As university is free in Sweden, the only cost of getting a degree is the foregone income (there are no fees
29
Fig. 19. Relative earnings of workers, 25-64 year-olds with income from employment, upper secondary education = 100
Tertiary education relative earnings Chile 237 Mexico 195 Hungary 194 United States 175 Turkey 171 Portugal 169 Czech Republic 169 Germany 169 Ireland 168 Slovak Republic 168 Israel 159 Poland 156 France 155 Switzerland 155 OECD average 154 Japan 152 Spain 151 Netherlands 150 United Kingdom 150 Luxembourg 148 Austria 146 Latvia 145 Korea 145 Canada 144 Belgium 141 Finland 141 Greece 140 Italy 138 New Zealand 132 Australia 131 Denmark 129 Norway 127 Estonia 127 Sweden 115
Around 58% of the growth in human capital for the 2017-18 cohort of graduates was seen within those aged 25-34 (Fig. 21). By contrast, mature students (aged 35+) were smaller in number and see a lower lifetime earnings impact. As explained further in the appendix, this estimate assumes that the higher wages of graduates reflect their greater marginal productivity, on average. In reality, other determinants of wages include idiosyncratic dynamics of (local) labour demand and supply, collective bargaining, prevailing price levels, etc. In addition, the difference in the lifetime earnings of graduates and non-graduates is assumed to reflect the value of education delivered by the higher education institution, as proxied by the award of the degree. However, other structural variations between these two groups (such as their aspirations,
30 expectations, self-beliefs, etc.) may also drive some of the observed
divergence in lifetime earnings.
Fig. 20. Monthly salary profile for graduates (excl. postgraduate) compared to high school graduates from the NV and SP programs.24
Fig. 21. Number of graduates and net present value of their lifetime earnings uplift, 2017/18
It should be noted that universities’ contributions to the Swedish human capital go beyond disseminating the academic content of traditional degree courses. In 2009, Sweden adopted an entrepreneurship education strategy, implemented by the Swedish Agency for Education. Thanks to this strategy,
entrepreneurship education is now embedded across all levels and types of education. In keeping with this strategy, many universities offer enterprise
24 NV = natural sciences secondary school; SP = social sciences secondary school.
0 5,000 10,000 15,000 20,000 25,000 30,000 35,000 40,000 45,000 50,000 20 23 26 29 32 35 38 41 44 47 50 53 56 59 62 65 68 71 74 77 80 83
With degree Without degree
Source: SCB, SACO, Oxford Economics
SEK 2018 0 10 20 30 40 50 60
24 and younger 25-34 35 and over
0 5,000 10,000 15,000 20,000 25,000 30,000 35,000 40,000
Number of graduates (left axis) Present value of earnings uplift (right axis)
Source: Oxford Economics
31 programmes that are focused on equipping students with skills required for the workplace or entrepreneurship.
Examples include internships (also known as a traineeship or praktik in Swedish), knowledge transfer programmes, and the assistance of career counsellors. Moreover, the networks and contacts that students establish at universities, among faculty as well as other students, can form an important foundation for a successful career. These connections increase students’ access to new employment or entrepreneurial opportunities, ultimately helping them forge careers in areas where they can be more productive and contribute more to the economy. These factors, in addition to the knowledge and skills imparted through university courses, are contributors to the higher future earnings that are observed among university graduates.
Partly as a result of these initiatives,and thanks to the strong technical training offered in Swedish universities, a significant number of university graduates go on to be successful entrepreneurs. For example, the Stockholm
University Inkubator develops and accelerates innovative business ideas from researchers, students, alumni and employees, offering start-ups business development support and a personal business coach, as well as workplace, infrastructure, and networking opportunities. While this activity clearly creates economic value, we were unable to identify Sweden-wide statistics on the number of businesses directly supported by higher education institutions and therefore could not quantify this potentially sizeable contribution.
Swedish universities also offer professional education programmes,
further contributing to the stock of human capital, by providing the opportunity for training throughout an individual’s lifetime. Through such courses,
universities provide education and upskilling that is focused on the needs of employees, employers, and individuals. For example, Lund University’s offer range from half-day courses to entire Master’s programmes, often adopting an interdisciplinary approach.
5.2 UNIVERSITIES’ CONTRIBUTION TO PRODUCTIVITY GROWTH
The 2019 European Innovation Scoreboard ranked Sweden as the number one innovation leader in Europe, based on a composite indicator averaging across several dimensions. One of these is the R&D expenditure in the public sector, which includes the government and the higher education sector. This clearly indicates the fundamental role played by universities in determining the innovation potential of a country.
Swedish universities undertake a significant amount of research and development (R&D). In 2017, they performed SEK 38.8 billion of R&D, this was double the amount they undertook in 1997, having allowed for price inflation (Fig. 22).25
25 SCB, "R&D expenditure in higher education sector, total by higher education institution, field of science and
32
Universities’ R&D comprises roughly 30% of all the research carried out nationwide.26 The Karolinska Institute in Stockholm ranks as the major
academic institution in Sweden when it comes to research, with a focus on human health, from basic experimental research to patient-oriented and nursing research.27 The returns from R&D, however, are not limited to the
organisation(s) conducting the activity themselves. The research can also lead to gains for other entities, and benefit the wider economy and society, through so-called “positive spillover impacts”. For example, even when research outputs are commercialised, it is impossible to quantify the totality of benefits that these have for society. For medical research, for instance, new
technologies can have life-changing impacts on patients, but these benefits are very difficult to capture in monetary terms.
Fig. 22. R&D investment in higher education sector, 1993-2017
Similar to the human capital contributions, there is no single agreed upon methodology for calculating the returns on investment in research and
development, although a number of academic studies have sought to quantify the economic benefits of R&D. Most recently, van Elk et al. (2019) investigated the returns to public R&D investments across 22 OECD countries, finding a 3.1% elasticity for Sweden.28
26 Swedish Institute, "Universities aiming for innovation"
<https://sweden.se/society/universities-aiming-for-innovation/> [accessed 14 November 2019]
27 Times Higher Education, "World University Rankings 2020"
<https://www.timeshighereducation.com/world-university-rankings/2020/world-ranking#!/page/0/length/25/sort_by/rank/sort_order/asc/cols/stats> [accessed 14 November 2019]
28 Roel van Elk, Bas ter Weel, Karen van der Wiel, Bram Wouterse, "Estimating the Returns to Public R&D
Investments: Evidence from Production Function Models", De Economist, 167 (2019): 45-87. The results used here are those of the augmented model, which includes production factors, such as public capital, the stock of inward and outward foreign direct investments and the shares of high-tech imports and exports. This yields a statistically significant positive effect of public R&D on Total Factor Productivity for Sweden. The estimated elasticity equals 3.1% for Sweden.
0 5 10 15 20 25 30 35 40 45 1993 1995 1997 1999 2001 2003 2005 2007 2009 2011 2013 2015 2017 Th ou s a nd s
Source: SCB, Haver, Oxford Economics
33
Drawing upon this article, we follow an input-based approach to estimate the return on research and development undertaken by universities. This involves first calculating the stock and value of R&D undertaken by all Swedish institutions (including universities), then estimating the knowledge stock built up through these investments, taking into account depreciation. In our estimate, we assume a depreciation rate of 15% a year, following once again the van Elk paper.
The R&D performed by Swedish universities in 2017 (the last available data point) is estimated to deliver substantial benefits to Swedish GDP. These equate to an estimated SEK 6.7 billion in GDP, equivalent to SEK 1,300 for every household in Sweden.
34
WIDER IMPACTS
Universities play a key role in local communities in many ways that are not easily quantified. In this box, we attempt to highlight some of these softer outcomes of the higher education sector that benefit Sweden’s economy and society more broadly.
The most relevant contribution of the higher education sector is through boosting students’
skill levels. In Section 5.1, we looked at the productivity uplift of graduates with a university degree as opposed to non-graduates. This is certainly a widely accepted methodology to estimate the contribution of the education sector in raising human capital levels, but not all benefits of education can be quantified. Education has been found to improve personal lives and help societies run smoothly. According to the Organization for Economic Cooperation and Development (OECD), educated people are more actively involved in various societal activities such as “voting, volunteering, political interest and interpersonal trust.”29
Secondly, many universities offer a range of services to help drive business growth across Sweden. For example, Stockholm University actively helps its researchers, teachers, and PhD students to develop business ideas, with services ranging from facilitating business
partnerships to providing advice on copyrights and financing opportunities. The University also has an incubator and a holding company to provide additional support to entrepreneurs. Thirdly, several universities in Sweden buildstrategic partnerships with the objective of creating long-term collaborations and enhancing the quality of academic research and education. For instance, Uppsala University has ongoing collaborations on personal mobility (with the municipality of Uppsala being a key partner), education, and recruitment (with ABB being a major partner).
Lastly, universities’ students and staff undertake research, a core component of the higher education sector. In Section 5.2, we estimated the economic returns to universities’ R&D investments, but not all benefits can be robustly quantified. Research projects in Sweden range from research by the Uppsala University’s Department of Business Studies into organisation and management to Lund’s University’s Software Engineering Research Group, which studies software platform management and system safety. Research across such a wide range of disciplines stimulates innovation, leading to new products, processes, and technologies that improve efficiency and productivity. Research in socially important fields like life sciences and education can also have wider benefits, such as improving the efficiency in the use of limited resources in the healthcare and public policy areas.
This study has measured the quantifiable economic value of Swedish universities. This box, however, demonstrates that there are significant wider benefits to the economy and society stemming from the higher education sector. The value of these benefits to the individuals affected, and to society at large, is very difficult to quantify. It is therefore important to understand the economic contribution of the higher education sector as part of this wider context.